. 2023 Mar 16;83(6):942-960.e9.
doi: 10.1016/j.molcel.2023.02.013. Epub 2023 Mar 8.

Oxygen toxicity causes cyclic damage by destabilizing specific Fe-S cluster-containing protein complexes

Affiliations

Oxygen toxicity causes cyclic damage by destabilizing specific Fe-S cluster-containing protein complexes

Alan H Baik et al. Mol Cell. .

Abstract

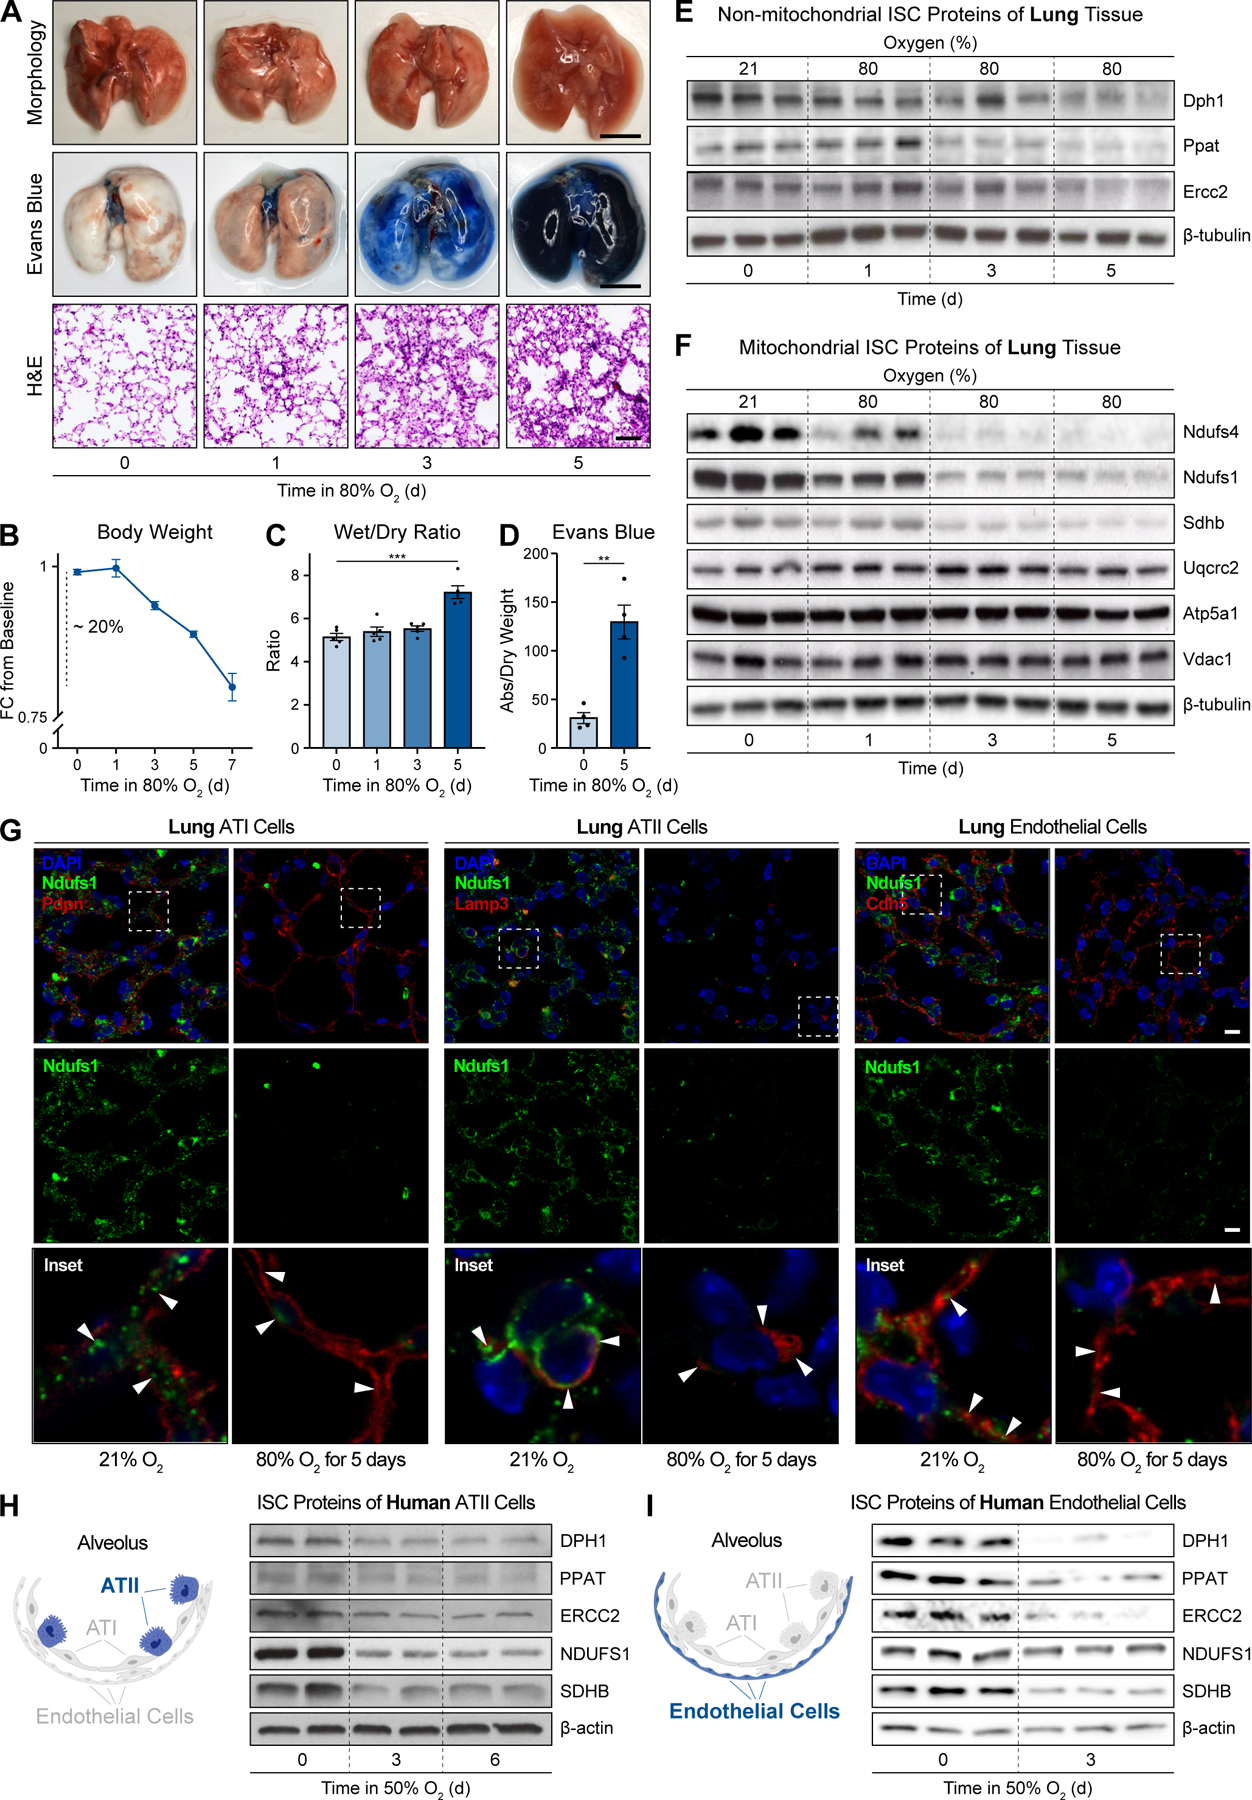
Oxygen is toxic across all three domains of life. Yet, the underlying molecular mechanisms remain largely unknown. Here, we systematically investigate the major cellular pathways affected by excess molecular oxygen. We find that hyperoxia destabilizes a specific subset of Fe-S cluster (ISC)-containing proteins, resulting in impaired diphthamide synthesis, purine metabolism, nucleotide excision repair, and electron transport chain (ETC) function. Our findings translate to primary human lung cells and a mouse model of pulmonary oxygen toxicity. We demonstrate that the ETC is the most vulnerable to damage, resulting in decreased mitochondrial oxygen consumption. This leads to further tissue hyperoxia and cyclic damage of the additional ISC-containing pathways. In support of this model, primary ETC dysfunction in the Ndufs4 KO mouse model causes lung tissue hyperoxia and dramatically increases sensitivity to hyperoxia-mediated ISC damage. This work has important implications for hyperoxia pathologies, including bronchopulmonary dysplasia, ischemia-reperfusion injury, aging, and mitochondrial disorders.

Keywords: DNA damage; Fe-S clusters; hyperoxia; lung injury; mitochondria; oxygen; purine synthesis; redox; translation fidelity.


Conflict of interest statement

Declaration of interests I.H.J. is a consultant for Maze Therapeutics and has patents related to hypoxia therapy for metabolic disorders.

Figures

Figure 1.
Figure 1.. Genome-wide screen and proteomics identify pathways dependent on specific iron-sulfur cluster enzymes that are susceptible to oxygen toxicity.
A) K562 cell counts after 4 days at 1.5%, 21%, and 50% O2 (***p<0.001, ****p<0.0001, unpaired t-test with Welch’s correction, Mean +/− SEM). B) Genome-wide CRISPR screen design using Brunello library and exposure to 21% vs 80% O2 (n=2 replicates). C) Cumulative growth of cells exposed to 21% versus 50% O2 throughout the screen, (n=2). D) Gene ranking by essentiality in 21% versus 50% O2 (MAGeCK-MLE algorithm). Bar plots (right) showing ISC-containing proteins and ISC assembly proteins relative to screen rankings. E) Enrichment analysis of buffering genes. F) Pie graph (left) and manually curated categories (right) of depleted proteins in hyperoxia. G) Box plot of different ISC levels in 50% O2 relative to 21% O2. H) Volcano plot highlighting depleted ISC-containing proteins in hyperoxia with a FC<0.5 ([2Fe-2S] proteins (blue), [4Fe-4S] proteins (red), both (purple) (Benjamini-Hochberg adjusted p-values). I) Validation of cytosolic/nuclear ISC proteins sensitive to oxygen (21%-50% O2) in K562 cells. J) Validation of oxygen-sensitive ETC proteins (21%-50% O2) in K562 cells as a function of time and O2.
Figure 2.
Figure 2.. Protein degradation leads to depletion of specific ISC-containing proteins in hyperoxia that is not rescued by normalization of superoxide levels.
A) qPCR of relevant ISC genes in 21% versus 50% O2 (n=3 biological replicates, unpaired t-test with Welch’s correction). B) Levels of ISC proteins following exposure to 21% versus 50% O2 and cycloheximide treatment for 0–3 days. C and D). Levels of ISC proteins following exposure to 21% versus 50% O2 and to bortezomib or bafilomycin for last 12 hours of oxygen exposure. E) Effects of inducible CLPP knock down on select ETC protein levels (CI: NDUFS1, NDUFS2; CII: SDHB). F and G). DHE and MitoSOX measurements of K562 cells treated with the C I inhibitor rotenone or 50% O2 for different timepoints. Cells were co-treated with vehicle or MnTBAP (unpaired t-test with Welch’s correction). H). Levels of ISC proteins (following exposure to 21% versus 50% O2 and MnTBAP for 3 days. All experiments performed in biological triplicate. Bar plots show mean +/− SEM. *p<0.05, **p<0.01, “ns” not significant.
Figure 3.
Figure 3.. Hyperoxia induces acute lung injury in a mouse model and leads to degradation of specific ISC-containing proteins in mouse and human lung cells.
A) Whole lung images (top; scale bar: 500 μm), Evans blue extravasation (middle; scale bar: 500 μm), and H&E (15X) of lung (bottom; scale bar: 100 μm) from WT mice exposed to normoxia and 80% O2,1–5 days. B) Mice body weights over time in 80% O2. C) Wet-to-dry ratio and D) Evans blue dye quantification in same samples (n=5 per group, unpaired t-test with Welch’s correction). E and F) Levels of ISC-containing non-ETC and ETC proteins from lung tissue from WT mice exposed to normoxia and 80% oxygen, 1–5 days (n=3 per group). G) Immunofluorescence (20X) from WT mice exposed to normoxia or 80% O2 for 5 days, co-staining for the ISC-containing C I protein NDUFS1 (green) and lung cell markers (red): podoplanin (alveolar type I), lamp3 (alveolar type II), and cdh5/VE-cadherin (endothelial). DAPI (blue). White arrows (bottom row) point to NDUFS1 (Scale bar: 10 μm). Representative images shown. H, I) Non-ETC and ETC ISC-containing proteins from primary human alveolar type II cells and endothelial cells exposed to normoxia and 50% O2 for up to 6 days. Data shown as mean +/− SEM. **p<0.01, ***p<0.001.
Figure 4.
Figure 4.. Hyperoxia decreases DPH1/DPH2 proteins, inhibits diphthamide biosynthesis, and increases ribosomal frameshifting.
A) DPH synthesis gene KOs are buffering hits. B) DPH synthesis enzymes are depleted in hyperoxia (Benjamini-Hochberg adjusted p-values). C) Role of the DPH proteins in diphthamide biosynthesis on the eukaryotic elongation factor (eEF2). CRISPR screen hits (blue outline), proteomics hits (turquoise box) and ISC are highlighted. D) Diphtheria-toxin (DT) resistance based on relative cell counts in K562 cells following KO of DPH1/DPH2 compared to normoxia and 50% O2. E) Diphthamide synthesis based on ADP-ribosylation assay (see schematic) in K562 cells under normoxia or hyperoxia. F) Rates of −1 ribosomal frameshifting in K562 cells (*p<0.05, **p<0.01 by unpaired t-test with Welch’s correction. Mean +/− SEM). G) ADP-ribosylation assay in lung tissue from WT mice exposed to normoxia versus 80% O2 for 5 days (n=3). Experiments performed in at least biological triplicate.
Figure 5.
Figure 5.. One carbon metabolism and purine synthesis are impaired in hyperoxia due to loss of SC-containing PPAT.
A) 1C metabolism and IMP biosynthesis gene KOs are buffering hits. B) ISC-containing PPAT is depleted in hyperoxia (Benjamini-Hochberg adjusted p-values). C) Schematic of 1C/purine biosynthesis pathways, showing CRISPR screen hits (blue outline), proteomics hits (turquoise box), and ISC. D) Hyperoxia and PPAT KO in normoxia confer resistance to methotrexate. E) Overlap of changing metabolites between hyperoxia-treated and PPAT KO cells. F) Purine synthesis and salvage pathway metabolite levels in 21% O2, 50% O2, and PPAT KO (n=4, unpaired t-test with Welch’s correction). G) Volcano plot showing depleted metabolites in lung tissue from mice exposed to 80% O2 for 5 days relative to normoxia. H) Metabolites in purine synthesis and salvage pathways in lung tissue from mice exposed to normoxia or 80% O2, 5 days (n=7 mice each condition). Bar plots show mean +/− SEM. *p<0.05, **p<0.01, ***p<0.001, ****p<0.0001.
Figure 6.
Figure 6.. Nucleotide excision repair (NER) is compromised in hyperoxia due to loss of ERCC2/XPD.
A) Gene KOs in the TFIIH complex involved in transcription-coupled NER are buffering hits. B) The ISC-containing protein XPD (encoded by ERCC2) is depleted in hyperoxia (Benjamini-Hochberg adjusted p-values). C) Schematic of TFIIH multi-protein complex. CRISPR screen hits (blue outline), proteomics hits (turquoise box) and ISCs. D) Representative comet images of cells exposed to 21% versus 50% O2, ERCC2 KO or UV light. DNA damage quantified based on comet tail (% tail DNA) (unpaired t-test with Welch’s correction). Scale bar: 500 μm. E) In vitro luciferase assay of NER in 50% O2, 21% O2, and ERCC2 KO. n=3 replicates (unpaired t-test with Welch’s correction. Mean +/− SEM). F) Representative comet images of single cells isolated from lung tissue from WT mice exposed to 21% versus 80% O2, 5 days. DNA damage quantified based on DNA content in comet tail. Scale bar: 400 μm. ***p<0.001, ****p<0.0001.
Figure 7.
Figure 7.. Hyperoxia decreases ETC proteins, leading to impaired ETC function and lung hyperoxia. Genetic ETC dysfunction causally demonstrates cyclic oxygen toxicity model.
A) S-plot of ETC genes (red dots) relative to buffering and sensitizing hits (black dots). B) ETC proteins (red dots) are depleted in hyperoxia (Benjamini-Hochberg adjusted p-values). C) Schematic of ETC (CI-V) depicting CRISPR screen hits (blue outline), proteomics hits (turquoise box), and ISCs. D) Basal and maximal oxygen consumption rates in hyperoxia vs. normoxia, K562 cells (n=3 replicates). E) Proteomics data schematic of ETC complex I proteins from lung tissue of WT mice exposed to normoxia or 80% O2 (1 and 5 days), and WT mice exposed to 80% O2 for 5 days then returned to 21% O2 (n=6 per group). F) Complex I/II activity from mitochondria isolated from WTC57Bl/6 mice exposed to normoxia vs 80% O2 for 1–5 days (Tukey’s multiple comparisons test). G) Enrichment analysis of the most affected gene pathways in hyperoxia vs. normoxia genome-wide CRISPR screen compared to previously published genetic screens using piericidin A, antimycin A (ETC inhibitors), ethidium bromide (mt DNA replication inhibitor), and H2O2, using hypergeometric test. Circle radius represents gene ratio of overlapping top buffering genes in gene sets. H) In vivo lung tissue PO2 measurements using Clark electrode (mV) from ventilated mice with various fraction of inspired oxygen (FiO2) following exposure to 21% versus 80% O2 for 3 and 5 days (unpaired t-test with Welch’s correction). I) Evans blue dye extravasation (top; scale bar: 500 μm) and H&E images (bottom; scale bar: 100 μm) of lung tissue from WT and Ndufs4 KO mice exposed to 50% O2, 2 days. J) Lung wet-to-dry ratio from WT and Ndufs4 KO mice exposed to normoxia and 50% oxygen, 2d (n=3 per group). K) Evans blue dye quantification from same samples L) Lung tissue PO2 measurements (mV) from ventilated WT and Ndufs4 KO mice (P35–40) with different fraction of inspired oxygen (FiO2)(unpaired t-test with Welch’s correction). M) ETC and non-ETC ISC-containing proteins from lung tissue in WT and Ndufs4 KO mice (P40–45) at 21% O2 (n=3 WT; n=4 Ndufs4 KO). N) Model of cyclic oxygen toxicity. Bar plots show mean +/− SEM. *p<0.05, **p<0.01, ***p<0.001, ****p<0.0001.

References

    1. Hodgskiss MSW, Crockford PW, Peng Y, Wing BA, and Horner TJ (2019). A productivity collapse to end Earth’s Great Oxidation. Proc Natl Acad Sci USA 116, 17207–17212. 10.1073/pnas.1900325116. - DOI - PMC - PubMed
    1. Lyons TW, Reinhard CT, and Planavsky NJ (2014). The rise of oxygen in Earth’s early ocean and atmosphere. Nature 506, 307–315. 10.1038/nature13068. - DOI - PubMed
    1. Friedman ES, Bittinger K, Esipova TV, Hou L, Chau L, Jiang J, Mesaros C, Lund PJ, Liang X, FitzGerald GA, et al. (2018). Microbes vs. chemistry in the origin of the anaerobic gut lumen. Proc Natl Acad Sci U S A 115, 4170–4175. 10.1073/pnas.1718635115. - DOI - PMC - PubMed
    1. Stewart FJ, Newton ILG, and Cavanaugh CM (2005). Chemosynthetic endosymbioses: adaptations to oxic-anoxic interfaces. Trends Microbiol 13, 439–448. 10.1016/j.tim.2005.07.007. - DOI - PubMed
    1. Griffith OW (1999). Biologic and pharmacologic regulation of mammalian glutathione synthesis. Free Radic Biol Med 27, 922–935. 10.1016/s0891-5849(99)00176-8. - DOI - PubMed

Publication types