. 2023;16(1):133-159.
doi: 10.1016/j.jcmgh.2023.03.001. Epub 2023 Mar 7.

Ferroptosis Suppressor Protein 1 Inhibition Promotes Tumor Ferroptosis and Anti-tumor Immune Responses in Liver Cancer

Affiliations

Ferroptosis Suppressor Protein 1 Inhibition Promotes Tumor Ferroptosis and Anti-tumor Immune Responses in Liver Cancer

Jacinth Wing-Sum Cheu et al. Cell Mol Gastroenterol Hepatol. 2023.

Abstract

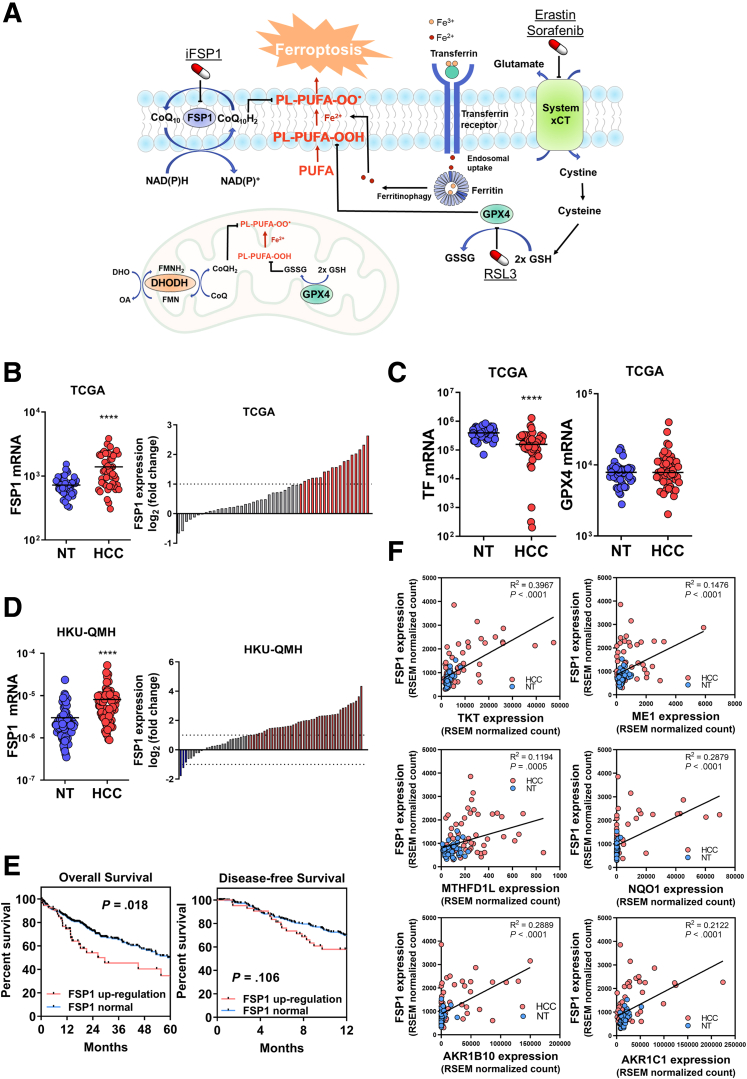
Background & aims: Hepatocellular carcinoma (HCC) is a highly aggressive malignancy with dreadful clinical outcome. Tyrosine kinase inhibitors and immune checkpoint inhibitors are the only United States Food and Drug Administration-approved therapeutic options for patients with advanced HCC with limited therapeutic success. Ferroptosis is a form of immunogenic and regulated cell death caused by chain reaction of iron-dependent lipid peroxidation. Coenzyme Q10 (CoQ10)/ferroptosis suppressor protein 1 (FSP1) axis was recently identified as a novel protective mechanism against ferroptosis. We would like to explore whether FSP1 could be a potential therapeutic target for HCC.

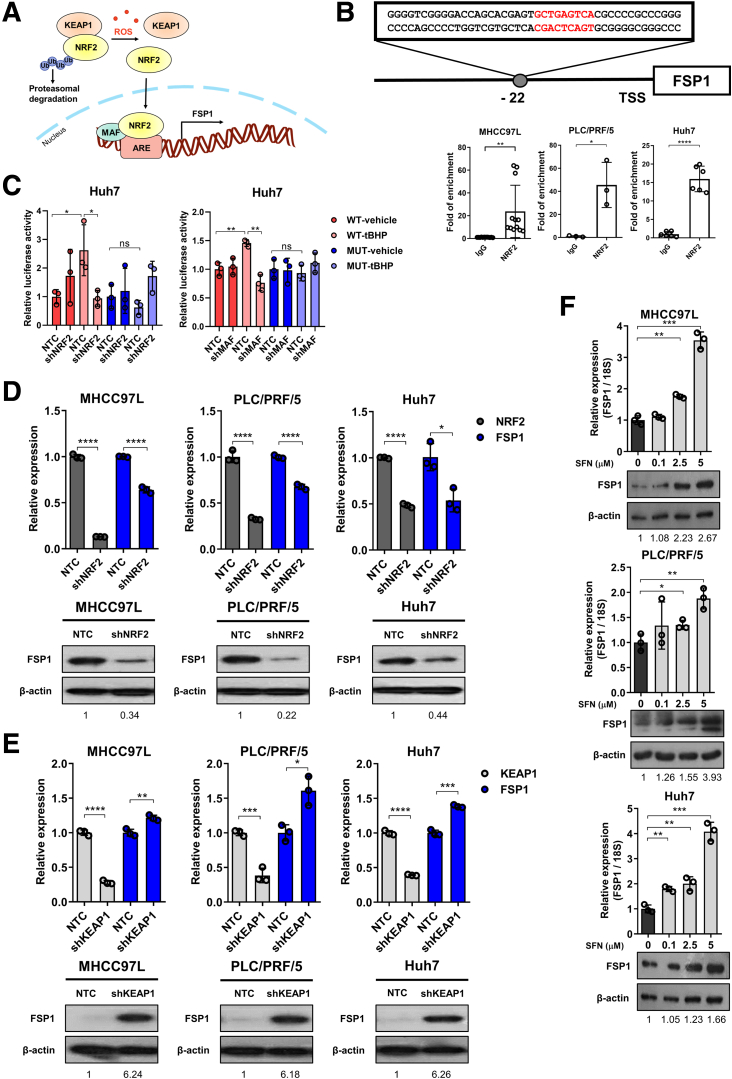
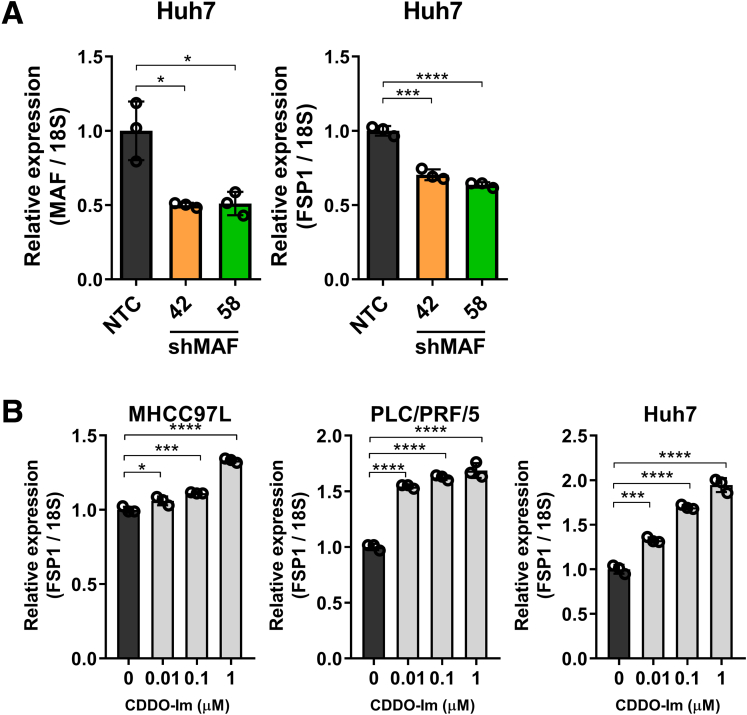
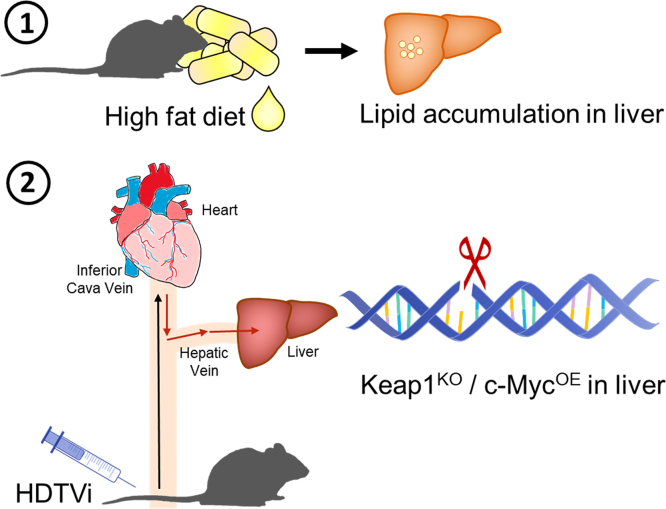
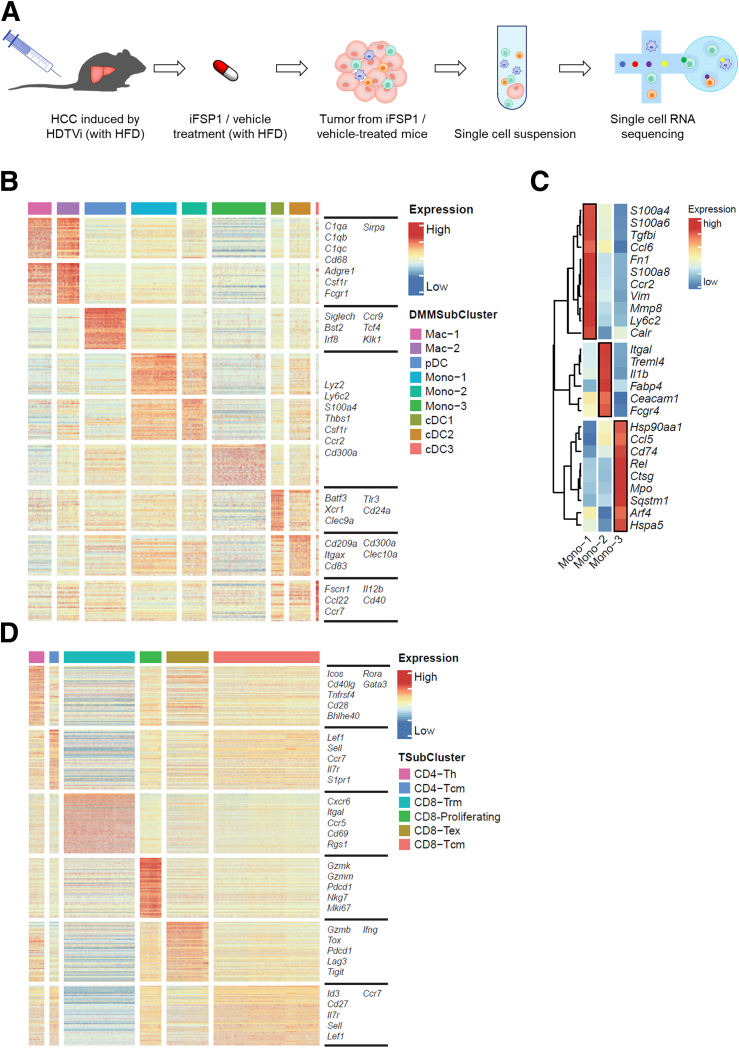
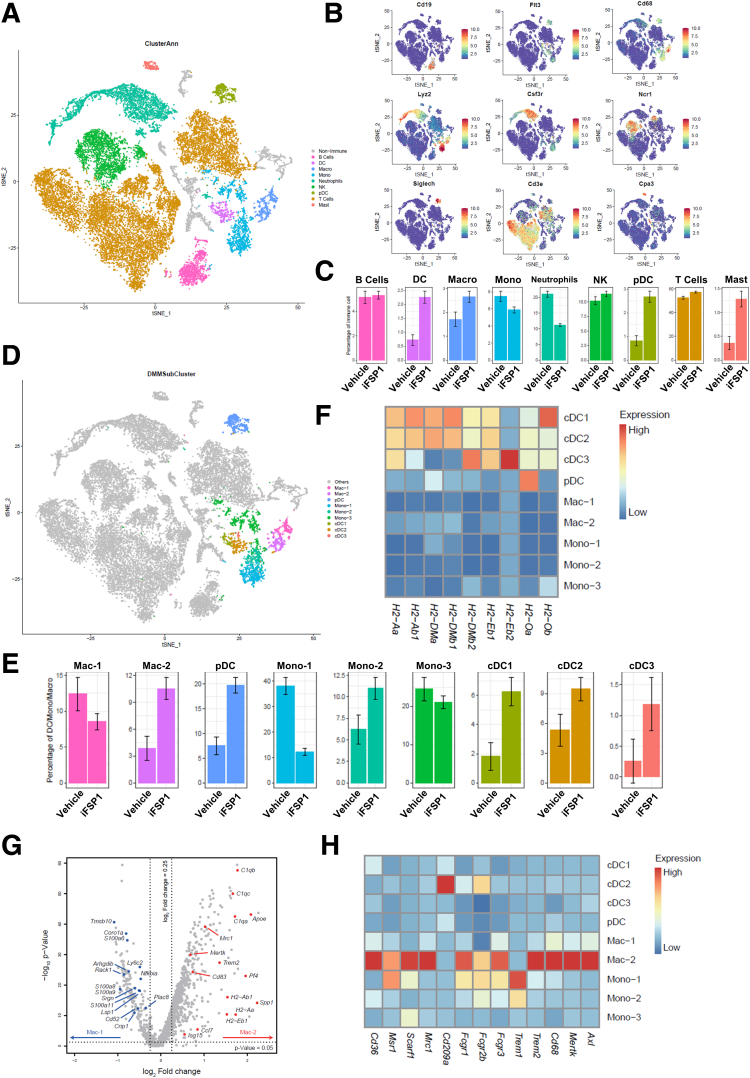
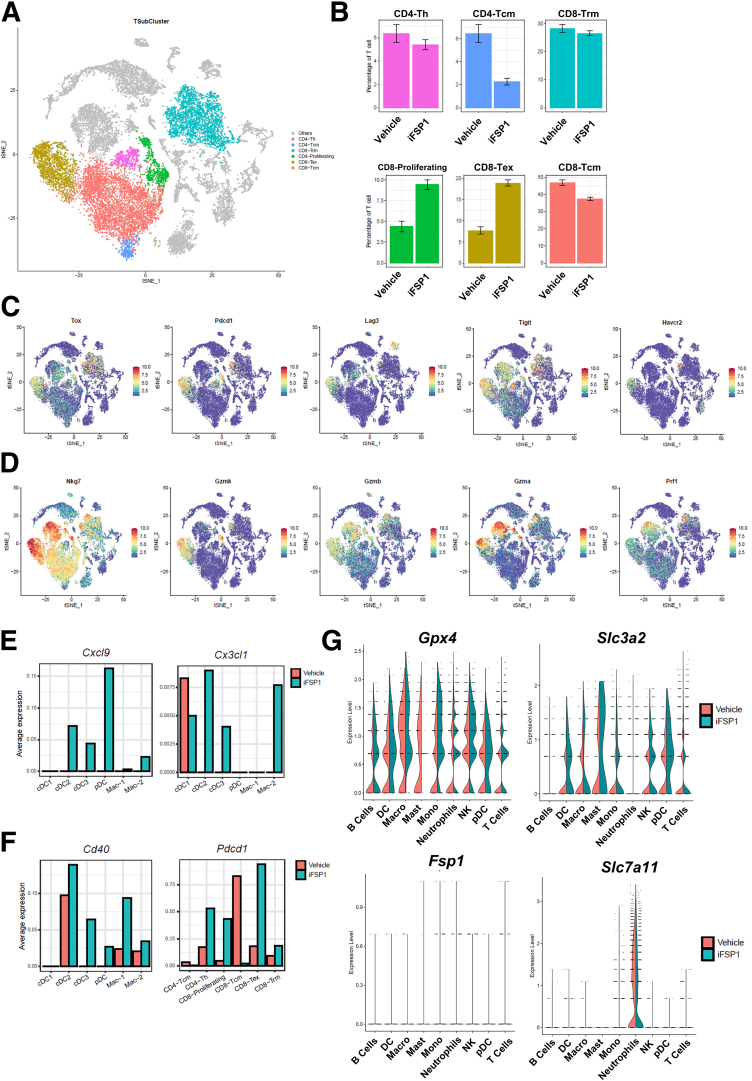
Methods: FSP1 expression in human HCC and paired non-tumorous tissue samples were determined by reverse transcription-quantitative polymerase chain reaction, followed by clinicopathologic correlation and survival studies. Regulatory mechanism for FSP1 was determined using chromatin immunoprecipitation. The hydrodynamic tail vein injection model was used for HCC induction to evaluate the efficacy of FSP1 inhibitor (iFSP1) in vivo. Single-cell RNA sequencing revealed the immunomodulatory effects of iFSP1 treatment.

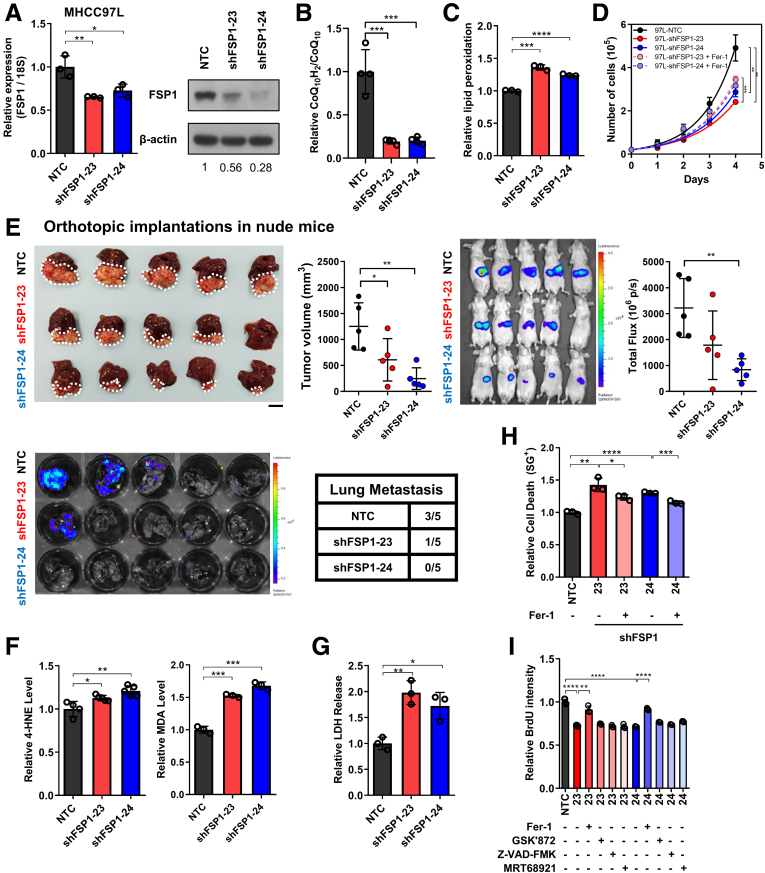
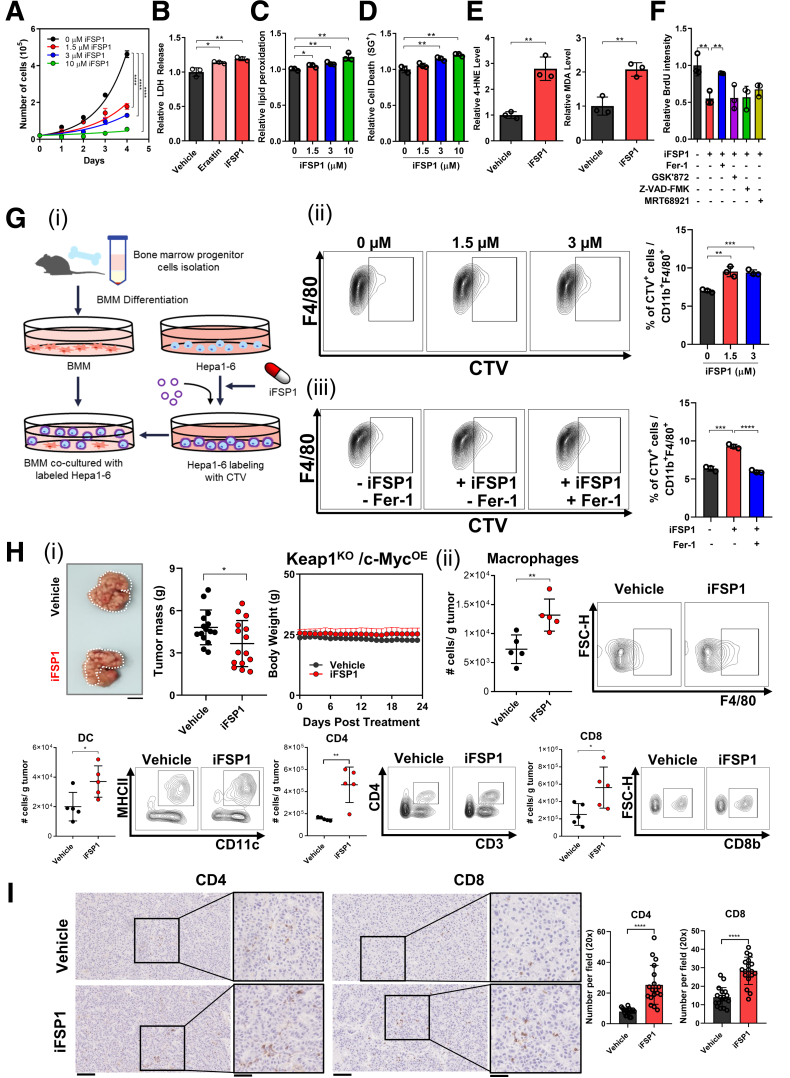
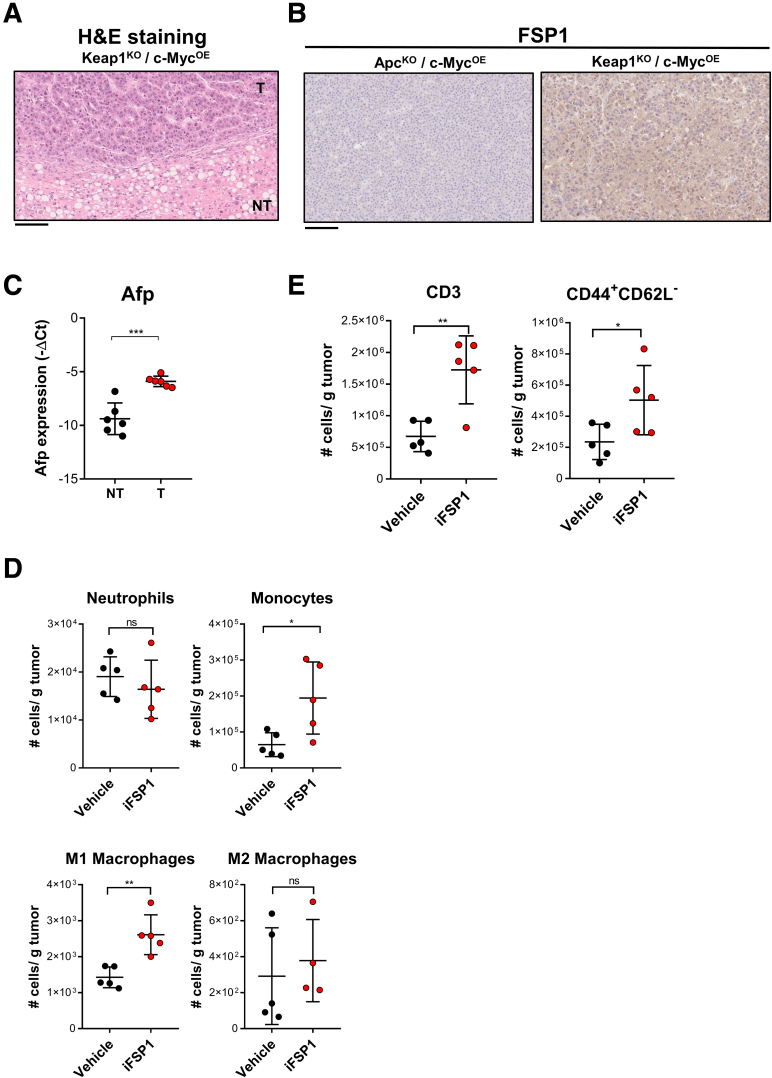
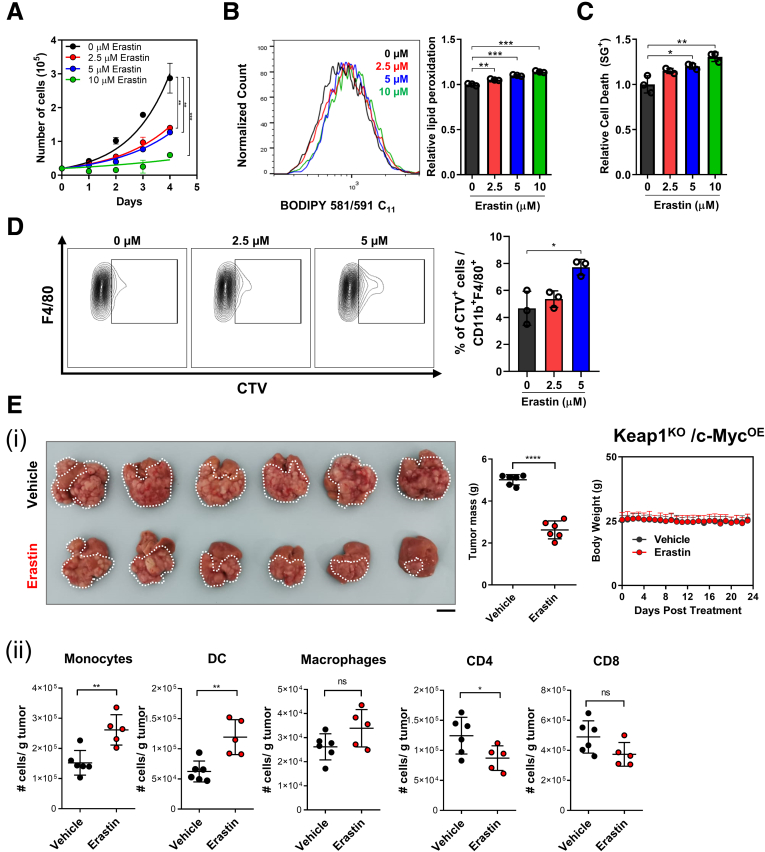
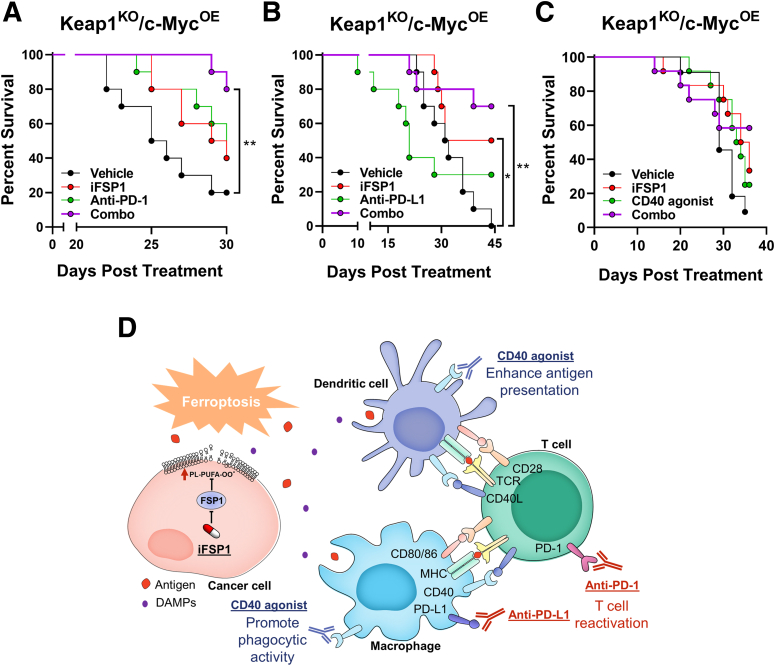
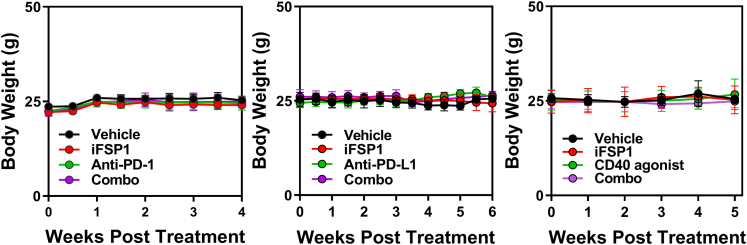
Results: We showed that HCC cells greatly rely on the CoQ10/FSP1 system to overcome ferroptosis. We found that FSP1 was significantly overexpressed in human HCC and is regulated by kelch-like ECH-associated protein 1/nuclear factor erythroid 2-related factor 2 pathway. FSP1 inhibitor iFSP1 effectively reduced HCC burden and profoundly increased immune infiltrates including dendritic cells, macrophages, and T cells. We also demonstrated that iFSP1 worked synergistically with immunotherapies to suppress HCC progression.

Conclusions: We identified FSP1 as a novel, vulnerable therapeutic target in HCC. The inhibition of FSP1 potently induced ferroptosis, which promoted innate and adaptive anti-tumor immune responses and effectively suppressed HCC tumor growth. FSP1 inhibition therefore represents a new therapeutic strategy for HCC.

Keywords: Hepatocellular Carcinoma; Immunogenic Cell Death; Lipid Peroxidation; Regulated Cell Death.


Figures

Figure 1
Figure 1
FSP1 is overexpressed in human HCC. (A) Schematic representation of pathways involved in ferroptosis regulation. (B) Left: TCGA data revealed upregulation of FSP1 in 49 human HCC tissues compared with corresponding NT liver tissues. Right: Waterfall plot showed upregulation of FSP1 in 37% (18/49) of patients with HCC retrieved from TCGA by at least 2-fold. (C) Left: TCGA data revealed downregulation of TF in human HCC tissues compared with corresponding NT liver tissues. Right: TCGA data revealed GPX4 is not upregulated in human HCC tissues compared with corresponding NT liver tissues. (D) Left: RT-qPCR results from an expanded cohort of 70 human HCC tissues from our institute demonstrated upregulation of FSP1 compared to corresponding NT liver tissues. Right: Waterfall plot showed upregulation of FSP1 in 63% (44/70) of patients with HCC by at least 2-fold. (E) Analysis of TCGA data revealed patients with HCC with FSP1 upregulation (Z-score > 1) are associated with poorer overall and disease-free survival. (F) TCGA data revealed positive correlations between expression of FSP1 with expressions of known NRF2-targeted genes including TKT, ME1, MTHFD1L, NQO1, AKR1B10, and AKR1C1 in human HCC and NT liver tissues. ∗∗∗∗P < .0001 vs NT. B‒D, F: Student t test. E: Kaplan-Meier followed by log-rank test. RSEM = RNA-Seq expression estimation by expectation maximization.
Figure 2
Figure 2
FSP1 is regulated by NRF2 in human HCC. (A) Schematic representation of FSP1 regulation mediated by the KEAP1/NRF2 pathway. (B) Top: ARE was located at -22 bp upstream of the transcription start site (TSS) of FSP1. Bottom: ChIP assay on HCC cells including MHCC97L, PLC/PRF/5, and Huh7 using NRF2, and IgG antibodies demonstrated specific and dramatic enrichment of NRF2 at the identified putative ARE of FSP1. (C) Left: Luciferase reporter assay showed that tert-Butyl Hydroperoxide (tBHP) treatment induced luciferase activities in Huh7 cells transfected with luciferase plasmid containing WT ARE we identified but not those with MUT ARE or knockdown of NRF2. Right: Luciferase reporter assay showed that tBHP-induced luciferase activities in Huh7 cells expressing WT ARE were abrogated upon knockdown of MAF. (D) Knockdown of NRF2 in MHCC97L, PLC/PRF/5, and Huh7 cells significantly downregulated FSP1 expressions at mRNA and protein levels confirmed by RT-qPCR and Western blotting, respectively. (E) Knockdown of KEAP1 in MHCC97L, PLC/PRF/5, and Huh7 cells significantly upregulated FSP1 expressions at mRNA and protein levels confirmed by RT-qPCR and Western blotting, respectively. (F) Activation of NRF2 upon treatments of 0.1, 2.5, 5 μM NRF2 activator SFN resulted in dose-dependent upregulation of FSP1 mRNA and protein expressions in MHCC97L, PLC/PRF/5, and Huh7 cells as confirmed by RT-qPCR and Western blotting, respectively. Error bars indicate mean ± SD. ∗P < .05, ∗∗P < .01, ∗∗∗P < .001, ∗∗∗∗P < .0001 vs IgG, NTC, or 0 μM as indicated. Student t test.
Figure 3
Figure 3
FSP1 is regulated by NRF2 and MAF in human HCC. (A) Left: Knockdown of MAF in Huh7 cells is confirmed by RT-qPCR. Right: Knockdown of MAF in Huh7 cells significantly downregulated FSP1 expressions at mRNA level as confirmed by RT-qPCR. (B) Activation of NRF2 upon treatments of 0.01, 0.1, 1 μM NRF2 activator CDDO-Im resulted in dose-dependent upregulation of FSP1 mRNA expressions in MHCC97L, PLC/PRF/5, and Huh7 cells as confirmed by RT-qPCR. ∗P < .05, ∗∗∗P < .001, ∗∗∗∗P < .0001 vs NTC or 0 μM as indicated. Error bars indicate mean ± SD. Student t test.
Figure 4
Figure 4
FSP1 knockdown induced ferroptotic HCC cell death. (A) Stable FSP1-knockdown subclones (shFSP1) were established using shRNAs. RT-qPCR and Western blotting confirmed the knockdown efficiencies at mRNA and protein levels, respectively. (B) LC-MS demonstrated decrease in relative CoQ10H2/CoQ10 ratio in MHCC97L-shFSP1 cells. (C) BODIPY 581/591 C11 staining in MHCC97L-shFSP1 cells revealed a significant increase in lipid peroxidation. (D) Cell proliferation rates of MHCC97L-NTC and -shFSP1 cells by cell counting daily revealed that FSP1 knockdown significantly suppressed HCC cell growth. Suppressed growth rates were rescued using ferroptosis inhibitor Fer-1. (E) Orthotopic implantation of luciferase-labeled MHCC97L-NTC and MHCC97L-shFSP1-23, and MHCC97L-shFSP1-24 cells into the livers of nude mice (n = 5 mice per experimental group) revealed that FSP1 knockdown suppressed HCC tumor formation in vivo. Top, left: Representative picture of orthotopic xenografts and quantification of tumor volume. Top, right: Bioluminescent images of mice implanted with different stable subclones. Bottom: Bioluminescent images of mice lung tissues with corresponding incidence of lung metastases. (F) Quantitative measurements of natural lipid peroxidation by-products Left: 4-HNE and Right: MDA in MHCC97L-NTC and MHCC97L-shFSP1 cells further suggest increased lipid peroxidation upon FSP1 knockdown. (G) Quantification of relative LDH release in MHCC97L-NTC and MHCC97L-shFSP1 cells demonstrated that intracellular lipid peroxidation induced by FSP1 knockdown significantly increased cell death. (H) SYTOX Green (SG+) staining in MHCC97L-NTC and MHCC97L-shFSP1 cells demonstrated increased cell death from FSP1 knockdown were rescued with Fer-1. (I) Cell proliferation rates of MHCC97L-NTC and MHCC97L-shFSP1 cells determined using BrdU assay indicated that Fer-1, not inhibitors of other modes of RCD GSK’872 (necroptosis), Z-VAD-FMK (apoptosis), and MRT68921 (autophagy), can rescue proliferation rates suppressed by FSP1 knockdown. Error bars indicate mean ± SD. ∗P < .05, ∗∗P < .01, ∗∗∗P < .001, ∗∗∗∗P < .0001 vs NTC or Fer-1 as indicated. Student t test. E: scale bar = 1 cm
Figure 5
Figure 5
iFSP1 induced ferroptosis and enhanced anti-tumor immune response. (A) Cell proliferation rates of MHCC97L cells determined by cell counting daily were significantly suppressed by treatments of 1.5, 3, and 10 μM FSP1 inhibitor iFSP1 in dose-dependent manner. (B) Quantification of relative LDH release from MHCC97L cells demonstrated that erastin and iFSP1 significantly induced cell death. (C) BODIPY 581/591 C11 staining in MHCC97L cells revealed significant increase of lipid peroxidation from treatments of 1.5, 3, and 10 μM iFSP1 in dose-dependent manner. (D) SYTOX Green (SG+) staining in MHCC97L cells revealed that treatments of 1.5, 3, and 10 μM iFSP1 resulted in significant increase in cell death dose-dependently. (E) Quantitative measurements of Left: 4-HNE and Right: MDA in MHCC97L cells with iFSP1 or vehicle treatment further suggested iFSP1 significantly increased lipid peroxidation. (F) Cell proliferation rates of MHCC97L cells treated with iFSP1 and vehicle determined using BrdU assay indicated that Fer-1, not inhibitors of other modes of RCD GSK’872 (necroptosis), Z-VAD-FMK (apoptosis), and MRT68921 (autophagy), can rescue proliferation rates suppressed by iFSP1 treatment. (G) Extent of phagocytosis by BMMs of iFSP1 pre-treated Hepa1-6 cells was determined by phagocytosis assay. (i) Schematic representation of the experimental design. (ii) Ferroptotic Hepa1-6 cells induced by iFSP1 pre-treatment were more frequently phagocytosed by BMMs. (iii) Fer-1 treatment abrogated the increase of phagocytosis by BMMs of iFSP1 pre-treated Hepa1-6 cells. (H) In vivo HCC tumors were induced via HDTVi of plasmids carrying Keap1KO/c-MycOE in C57BL/6N mice fed with HFD. (i) Administration of iFSP1 through intraperitoneal injection significantly reduced HCC tumor size compared with vehicle (n = 15 mice per experimental group). Left: Representative picture of harvested tumors. Middle & Right: Quantifications of tumor mass and body weight of mice. (ii) Administration of iFSP1 enhanced infiltration of macrophages, DCs, CD4+ T cells, and CD8+ T cells in HDTVi-induced HCC tumors. (I) IHC staining demonstrated the administration of iFSP1 enhanced the recruitment of CD4+ and CD8+ T cells in HDTVi-induced HCC tumors. Left: Representative staining of CD4+ and CD8+ T cells from harvested tumors treated with Vehicle or iFSP1. Right: Quantifications of number of CD4+ and CD8+ T cells stained per field. Error bars indicate mean ± SD. ∗P < .05, ∗∗P < .01, ∗∗∗P < .001, ∗∗∗∗P < .0001 vs vehicle or 0 μM as indicated. Student’s t test. H: Scale bar = 1 cm. I: original = 20× magnification, scale bar = 100 μm; Inset = 40× magnification, scale bar = 50 μm
Figure 6
Figure 6
Schematic diagram illustrating murine HCC model used for iFSP1 efficacy testing.In vivo HCC tumors were induced in HFD-fed C57BL/6N mice by HDTVi of plasmids carrying KeapKO/c-MycOE.
Figure 7
Figure 7
Characterization of murine tumor model used and the immune landscape change upon iFSP1 treatment. (A‒C) In vivo HCC tumors were induced via HDTVi of plasmids carrying Keap1KO/c-MycOE (or ApcKO/c-MycOE) in C57BL/6N mice fed with HFD. (A) Representative hematoxylin and eosin staining of Keap1KO/c-MycOE HCC tumor. (B) Representative staining of FSP1 expression from ApcKO/c-MycOE or Keap1KO/c-MycOE HCC tumors at protein level by IHC staining. (C) RT-qPCR demonstrated the upregulation of Afp in tumorous (T) tissues when compared with NT liver tissues in Keap1KO/c-MycOE HCC tumor. (D) Administration of iFSP1 altered myeloid cells infiltration, including neutrophils (CD11b+ Ly6G+), monocytes (CD11b+ Ly6C+), M1 macrophages (CD11b+ F4/80+ CD86+ MHCII+), and M2 macrophages (CD11b+ F4/80+ CD206+) in HDTVi-induced HCC tumors. (E) Administration of iFSP1 increased number of T cells (CD3+) and T effector cells (CD44+ CD62L-) in HDTVi-induced HCC tumors. ∗P < .05, ∗∗P < .01, ∗∗∗P < .001 vs NT or vehicle as indicated. Student t test. A‒B: 20× magnification, scale bar = 100 μm.
Figure 8
Figure 8
Erastin effectively induced ferroptotic HCC cell death. (A) Cell proliferation rates of MHCC97L cells determined by cell counting daily were significantly suppressed by treatments of 2.5, 5, and 10 μM ferroptosis inducer erastin in dose-dependent manner. (B) BODIPY 581/591 C11 staining in MHCC97L cells revealed significant increase of lipid peroxidation from treatments of 2.5, 5, and 10 μM erastin in dose-dependent manner. (C) SYTOX Green (SG+) staining in MHCC97L cells revealed that treatments of 2.5, 5, and 10 μM erastin resulted in significant increase in cell death dose-dependently. (D) Ferroptotic Hepa1-6 cells induced by erastin pre-treatment were more frequently phagocytosed by BMDMs. (E) In vivo HCC tumors were induced via HDTVi of plasmids carrying Keap1KO/c-MycOE in C57BL/6N mice fed with HFD. (i) Administration of erastin through intrperitoneal injection significantly reduced HCC tumor size compared with vehicle (n = 6 mice per experimental group). Left: Representative picture of harvested tumors. Middle & Right: Quantifications of tumor mass and body weight of mice. (ii) Administration of erastin increased the number of monocytes, DCs and macrophages, while it decreased the number of CD4+ T cells and CD8+ T cells in HDTVi-induced HCC tumors. Error bars indicate mean ± SD. ∗P < .05, ∗∗P < .01, ∗∗∗P < .001, ∗∗∗∗P < .0001 vs vehicle or 0 μM as indicated. Student t test. E: Scale bar = 1 cm.
Figure 9
Figure 9
ScRNA-seq revealed iFSP1 altered immune landscape in mouse HCC. (A) Schematic diagram illustrating experimental design. (B) Gene expression heatmap of myeloid clusters showed the selected marker genes for each subset. (C) Gene expression heatmap of monocytes showed the selected marker genes for each subset. (D) Gene expression heatmap of T cells showed the selected marker genes for each subset. B, D: Expression: Z-score normalized expression. C: Expression: Z-score normalized mean expression.
Figure 10
Figure 10
iFSP1 promoted anti-tumorigenic immune cells infiltration. (A) tSNE plot revealed clusters of major cell populations isolated from mouse HCC tumor treated with iFSP1 or vehicle. (B) tSNE plots showed the selected marker genes of major immune cell populations. (C) Percentage change of major immune cell clusters revealed the increase of DCs, macrophages, and T cells in tumor upon iFSP1 treatment. (D) tSNE plot illustrated further sub-clustering of selected myeloid cells. (E) Percentage change of myeloid cell subsets demonstrated iFSP1 treatment led to an increase in all DC subsets but differential effect on macrophages and monocytes. (F) Heatmap showing expression of major histocompatibility complex II genes in the myeloid subsets indicated that DCs expressed the highest level of antigen-presenting signature. (G) Volcano plot showing differentially expressed genes between Mac-1 and Mac-2 revealed that phagocytosis-related genes were enriched in Mac-2. P-value < .05 and log2 (fold change) > 0.25. (H) Heatmap showing expression of phagocytosis-related genes in the myeloid subsets indicated that Mac-2 expressed the highest level of phagocytic signature. B: Expression: normalized expression. C, E: Error bars indicate 95% confidence interval. F, H: Expression: Z-score normalized mean expression.
Figure 11
Figure 11
ScRNA-seq revealed FSP1 as a potent therapeutic target in HCC. (A) tSNE plot showed further clustering of T cells into 6 subsets. (B) Percentage change of T cell subsets revealed an increase in proliferating and exhausted CD8+ T cells upon iFSP1 treatment. (C) tSNE plots showed the expression level of T cell exhaustion markers. (D) tSNE plots showed the expression level of cytotoxic markers. (E) Average expression level of Cxcl9 and Cx3cl1 were induced upon iFSP1 treatment in DC and macrophage subsets. (F) Average expression level of Cd40 in DC and macrophage subsets and Pdcd1 in T cell subsets were induced upon iFSP1 treatment. (G) Left: Violin plots showed the expression level of Gpx4 and Fsp1in major immune cell populations. Right: Violin plots showed the expression level of Slc3a2 and Slc7a11 in major immune cell populations. B: Error bars indicate 95% confidence interval. C‒G: Expression: normalized expression.
Figure 12
Figure 12
Combination of iFSP1 and immunotherapies prolonged HCC survival. (AB) Co-administrations of iFSP1 with ICIs, (A) anti-PD-1 and (B) anti-PD-L1 antibodies, respectively, synergistically prolonged the survival of tumor-bearing C57BL/6N mice (n = 10 mice per experimental group). (C) Co-administrations of iFSP1 and CD40 agonist prolonged the survival of tumor-bearing C57BL/6N mice (n = 12 mice per experimental group). (D) Schematic summary of immunomodulatory effects and treatment strategies of iFSP1. AC: Log-rank test.
Figure 13
Figure 13
Body weights of mice upon drug administration. Body weights of tumor-bearing mice co-treated with iFSP1 and anti-PD-1, anti-PD-L1, or CD40 agonist.

References

    1. Sung H., Ferlay J., Siegel R.L., et al. Global Cancer Statistics 2020: GLOBOCAN estimates of incidence and mortality worldwide for 36 cancers in 185 countries. CA Cancer J Clin. 2021;71:209–249. - PubMed
    1. Llovet J.M., Kelley R.K., Villanueva A., et al. Hepatocellular carcinoma. Nat Rev Dis Primers. 2021;7:6. - PubMed
    1. Dixon S.J., Lemberg K.M., Lamprecht M.R., et al. Ferroptosis: an iron-dependent form of nonapoptotic cell death. Cell. 2012;149:1060–1072. - PMC - PubMed
    1. Jiang X., Stockwell B.R., Conrad M. Ferroptosis: mechanisms, biology and role in disease. Nat Rev Mol Cell Biol. 2021;22:266–282. - PMC - PubMed
    1. Li J., Cao F., Yin H.L., et al. Ferroptosis: past, present and future. Cell Death Dis. 2020;11:88. - PMC - PubMed

Publication types