. 2023 Mar 9;14(1):1295.
doi: 10.1038/s41467-023-36896-0.

Circadian clock molecule REV-ERBα regulates lung fibrotic progression through collagen stabilization

Affiliations

Circadian clock molecule REV-ERBα regulates lung fibrotic progression through collagen stabilization

Qixin Wang et al. Nat Commun. .

Abstract

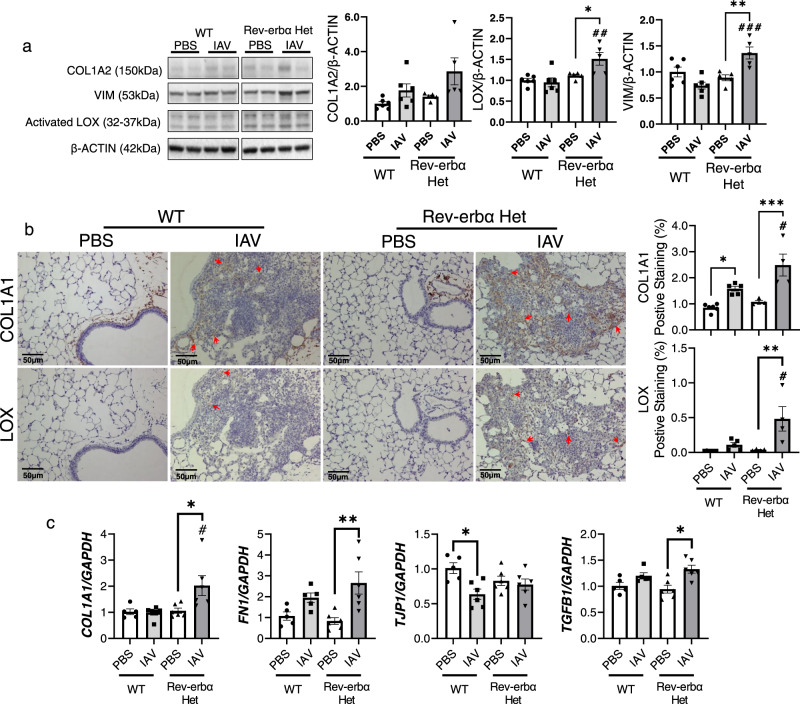
Molecular clock REV-ERBα is central to regulating lung injuries, and decreased REV-ERBα abundance mediates sensitivity to pro-fibrotic insults and exacerbates fibrotic progression. In this study, we determine the role of REV-ERBα in fibrogenesis induced by bleomycin and Influenza A virus (IAV). Bleomycin exposure decreases the abundance of REV-ERBα, and mice dosed with bleomycin at night display exacerbated lung fibrogenesis. Rev-erbα agonist (SR9009) treatment prevents bleomycin induced collagen overexpression in mice. Rev-erbα global heterozygous (Rev-erbα Het) mice infected with IAV showed augmented levels of collagens and lysyl oxidases compared with WT-infected mice. Furthermore, Rev-erbα agonist (GSK4112) prevents collagen and lysyl oxidase overexpression induced by TGFβ in human lung fibroblasts, whereas the Rev-erbα antagonist exacerbates it. Overall, these results indicate that loss of REV-ERBα exacerbates the fibrotic responses by promoting collagen and lysyl oxidase expression, whereas Rev-erbα agonist prevents it. This study provides the potential of Rev-erbα agonists in the treatment of pulmonary fibrosis.


Conflict of interest statement

The authors declare no competing interests.

Figures

Fig. 1
Fig. 1. Decreased REV-ERBα protein abundance and increased protein levels of COL1A1 and LOX in IPF lungs compared to healthy control.
Healthy control and IPF formalin fixed-paraffin embedded (FFPE) lung samples were purchased from Origene Inc. Healthy controls contained 100% normal lung architecture with 85% alveoli surface area. IPF patient samples contained at least 50% lesion surface area. The protein abundance of REV-ERBα, COL1A1, and LOX were visualized and determined by IHC. a The comparisons of protein distribution and abundance were performed between healthy control and IPF patient (n = 10 per group), b or between the healthy area and lesion area from the same IPF patient. The images were taken, and the positive stained area was calculated by ImageJ (n = 5 per group). Data were shown as mean ± SEM, unpaired t-test was used for a and b. Bar size: 50 µm. (*p < 0.05, ***p < 0.001; scale bar: 50 μm).
Fig. 2
Fig. 2. Altered circadian and profibrotic mRNA and protein expressions were observed in bleomycin induced fibrotic responses.
Lungs from C57BL/6J WT mice (Combined male and female (n = 2–3 each) for analysis) dosed with bleomycin at day 14 were snap-frozen and used for RNA isolation. RNA isolated from lung homogenates were used to identify the circadian and profibrotic related gene expressions by our customized nanostring panel through nCounter SPRINT Profiler. The transcripts levels of RNA targets (Normalized Count) were normalized and visualized by nSolver software. a Dysregulated genes are shown as a heatmap with circadian genes on top and profibrotic genes on the bottom. b Selected gene expressions were shown as a bar graph (n = 6 mice per group). c Proteins isolated from lung homogenates were used to detect the abundance of REV-ERBα, LOX, Activated LOX, and COL1A1. Represented blots are shown here, and protein expression fold change was calculated based on the normalization of β-ACTIN (n = 4–6 mice per group). Data were shown as mean ± SEM, unpaired two-side t-test was used for b and c. (*p < 0.05, **p < 0.01, ***p < 0.001 vs. PBS).
Fig. 3
Fig. 3. The health status of mice, circadian genes and fibrotic genes and protein expressions were affected by bleomycin injury in different time points (7 a.m. vs. 7 p.m.).
C57BL/6J WT female mice were used for testing. a The body weights and survival rate were monitored until day 14 post-injury. (n = 3–5 mice per group, *p < 0.05, **p < 0.01 vs. bleomycin 7 a.m. group). Lungs were harvested, and H&E staining was performed to identify the injured area percentage. b RNA was isolated from lungs homogenates, and gene expression analysis was conducted using customized nanostring panel through nCounter SPRINT Profiler, and transcripts levels were normalized and visualized by nSolver software. The dysregulated genes were shown as a heatmap with circadian and profibrotic genes. Selected gene expressions were shown as bar graph (n = 3 mice per group). c Proteins isolated from lung homogenates were tested via western blot (REV-ERBα, LOX, Activated LOX, LOXL2, and COL1A1) represented blots were showing and change fold was normalized to β-ACTIN (n = 4–5 mice per group). d Lung sections were used for IHC, and the abundance and localization of COL1A1 and LOX were detected (n = 3–4 mice per group). Data were shown as mean ± SEM, two-way ANOVA followed Tukey’s multiple comparisons test was performed in a (Body weight change (%)) and one-way ANOVA followed Šídák’s multiple comparisons test was used in a (injured area (%); and bd). Bar size: 1000 µm in a, and 25 µm in d. (*p < 0.05, **p < 0.01, ***p < 0.001 between groups; ##p < 0.01 vs. Bleo 7 a.m. group; &&&p < 0.001 vs. PBS 7 a.m. group).
Fig. 4
Fig. 4. Rev-erbα agonist (SR9009) treatment helped to reduce the collagen overexpression occurred in bleomycin induced lung fibrosis.
C57BL/6J WT mice (equal number of male and female mice) were dosed with bleomycin for 14 days, and SR9009 was given via i.p. injection at a dose of (100 mg/kg) daily. a The body weights and the survival rate was monitored until day 14 post-injury (n = 8–12 mice per group). b Lungs were harvested, and H&E staining was performed to identify the injured area percentage (n = 8 mice per group). c RNA was isolated, and gene expression analysis was conducted using nCounter Fibrosis panel via nCounter SPRINT Profiler, and transcripts levels were normalized and visualized by nSolver. The dysregulated genes focused on collagen dynamics and ECM remodeling were shown as a heatmap and selected gene expressions were shown as bar graphs (n = 8 mice per group). d Proteins isolated from lung homogenates were detected via western blot (COL1A1, COL4A1, LOXL2, and Activated LOX), represented blots were shown and fold change was normalized to β-ACTIN (n = 8 mice per group). e Lung sections were stained by COL1A1 and COL4A1 via IHC, and the abundance and localization were determined by ImageJ (n = 8 mice per group). Data were shown as mean ± SEM, multiple unpaired t-test was used for a, and one-way ANOVA followed Šídák’s multiple comparisons test was used in bd. Bar size: 1000 µm in b and e, ×4 magnification, and 50 µm in e, ×20 magnification. (*p < 0.05, **p < 0.01, ***p < 0.001 vs. PBS group; #p < 0.05, ###p < 0.001 vs. Bleo group).
Fig. 5
Fig. 5. IAV induced lung injury and profibrotic responses exaggerated in Rev-erbα Het mice compared to WT mice.
WT and Rev-erbα Het mice were infected (103 PFU/mouse) with IAV or PBS control for 15 days. a Body weights were monitored during infection, and virus-specific antibodies in serum were detected by ELISA (n = 5–19 mice per group, *p < 0.05, **p < 0.01, ***p < 0.01 vs. IAV infected WT mice). b During sacrifice, lung mechanics (resistance, compliance, and elastance) were measured. (n = 3–4 mice per group). c H&E stained lung sections were used to analyze the injured area induced by IAV infection. Regions within the black squares were shown with ×20 magnification (n = 4–6 mice per group). Data were shown as mean ± SEM, two-way ANOVA followed Tukey’s multiple comparisons test was performed in a (bodyweight change (%)), multiple unpaired t-test was used for a (virus-specific antibodies titer), one-way ANOVA followed Šídák’s multiple comparisons test was used in b, c, unpaired two-side t-test was used in b (Resistance IAV-WT vs. IAV Rev-erbα Het; Elastance PBS-WT vs. IAV-WT; Compliance PSB-WT vs. IAV-WT and IAV-WT vs. IAV Rev-erbα Het). Bar size: 1000 µm in c (×4 magnification), and 50 µm in c (×20 magnification) (*p < 0.05, **p < 0.01, ***p < 0.001 between groups; #p < 0.05, ##p < 0.01 vs. IAV infected WT mice).
Fig. 6
Fig. 6. IAV infection induced dysregulation of profibrotic gene expression exacerbated in Rev-erbα Het mice.
WT and Rev-erbα Het mice (equal number of male and female mice) were dosed with IAV (103 PFU) for 15 days, and lungs were homogenized for RNA isolation. Gene expression analysis was conducted using nCounter Fibrosis Panel via nCounter SPRINT Profiler. RNA expressions were normalized and analyzed via nSolver software and ROSALIND service. a The dysregulated gene expressions between groups were shown as volcano plots, the cut off filter is at least 10% change (up or downregulation), and p < 0.05. b, c Overlapping gene expression changes among groups were shown by Venn diagrams with the same cutoff line used for volcano plots. d The overview of gene expression focused on collagen dynamics were shown as a heatmap, and the selected gene transcript levels (collagens and lysyl oxidases) were shown as a bar graph separately. Data are shown as mean ± SEM, one-way ANOVA followed Šídák’s multiple comparisons test was used in d, unpaired two-side t-test was used in d (COL1A1 PBS-WT vs. IAV-WT and COL3A1 PBS-WT vs. IAV-WT). (n = 6 mice per group; *p < 0.05, **p < 0.01, ***p < 0.001 between groups; ##p < 0.01 compared with IAV infected WT group).
Fig. 7
Fig. 7. IAV infection induced dysregulation of profibrotic progression exacerbated in Rev-erbα Het mice.
WT and Rev-erbα Het mice (equal number of male and female) infected (103 PFU/mouse) with IAV for 15 days, and lungs were separated for RNA/protein isolation, or fixed with 10% formalin for FFPE sections. a The protein abundance of COL1A2, VIM and activated LOX were measured by western blot. Representative blot images were shown. Different targets were run on the same membrane: COL1A2, VIM and activated LOX were probed in the same membrane and β-ACTIN was used as an endogenous control (n = 5–6 mice per group). b The localizations of COL1A1 and LOX were determined by immunohistochemical staining, and red arrows were used to indicate the regions of interest. The positive staining area was calculated via ImageJ (n = 4–6 mice per group). c RNA isolated from lung homogenates was used to measure the gene expression (COL1A1, FN1, TJP1 and TGFB1) via qRT-PCR, and GAPDH was used as an endogenous gene for normalization (n = 5–6 mice per group). Data are shown as mean ± SEM, one-way ANOVA followed Šídák’s multiple comparisons test was used in ac. Bar size: 50 µm in b. (n = 4–6; *p < 0.05, **p < 0.01, ***p < 0.001 between groups; #p < 0.05, ##p < 0.01 compared with IAV infected WT group).
Fig. 8
Fig. 8. Rev-erbα agonist inhibits TGFβ induced fibroblast differentiation and antagonists exacerbate it.
Human primary lung fibroblast were treated with TGFβ (2 ng/ml) with or without Rev-erbα agonist (GSK4112, 20 µM) or antagonist (SR8278, 20 µM) for 2 days. a Protein was isolated for western blot analysis (αSMA, COL1A1, LOX, and Fibronectin (FN)). Represented blots are shown with densitometry analysis (n = 3–4 cells per group). b Immunofluorescence staining showed the distribution and protein abundance of COL1A1 and αSMA, DAPI was used for nuclear staining (×20). Relative fluorescence intensity was calculated in ImageJ, as fluorescence intensity per cell (n = 4 cells per group). c RNA was isolated for gene expression measurement via qPCR (ACTA2, COL1A1, COL4A1, FN1, LOX, LOXL1, LOXL2, and NR1D1). GAPDH was used as an endogenous control for RNA and protein fold change normalization (n = 4 cells per group). Data are shown as mean ± SEM, one-way ANOVA followed Šídák’s multiple comparisons test was used in ac, unpaired two-side t-test was used in a (COL1A1 Ctrl vs. TGFβ, LOX TGFβ vs. TGFβ + GSK4112, FN TGFβ vs. TGFβ + SR8278). d Schematic demonstrating how both Rev-erbα agonist and antagonist regulates ECM deposition in lung fibroblast induced by TGFβ, and the schematic is created with Biorender.com. Bar size: 50 µm in b. (*p < 0.05, **p < 0.01, ***p < 0.001 vs. Ctrl group; #p < 0.05, ###p < 0.001 vs. TGFβ group).

References

    1. Huapaya JA, Wilfong EM, Harden CT, Brower RG, Danoff SK. Risk factors for mortality and mortality rates in interstitial lung disease patients in the intensive care unit. Eur. Respir. Rev. 2018;27:180061. doi: 10.1183/16000617.0061-2018. - DOI - PMC - PubMed
    1. Pain M, et al. Tissue remodelling in chronic bronchial diseases: from the epithelial to mesenchymal phenotype. Eur. Respir. Rev. 2014;23:118–130. doi: 10.1183/09059180.00004413. - DOI - PMC - PubMed
    1. Huang WJ, Tang XX. Virus infection induced pulmonary fibrosis. J. Transl. Med. 2021;19:496. doi: 10.1186/s12967-021-03159-9. - DOI - PMC - PubMed
    1. Antoniou KM, et al. Interstitial lung disease. Eur. Respir. Rev. 2014;23:40–54. doi: 10.1183/09059180.00009113. - DOI - PMC - PubMed
    1. Maher TM, et al. Pirfenidone in patients with unclassifiable progressive fibrosing interstitial lung disease: design of a double-blind, randomised, placebo-controlled phase II trial. BMJ Open Respir. Res. 2018;5:e000289. doi: 10.1136/bmjresp-2018-000289. - DOI - PMC - PubMed

Publication types

MeSH terms

Substances