. 2023 Mar 9;8(1):108.
doi: 10.1038/s41392-023-01368-w.

SARS-CoV-2 spike protein induces IL-18-mediated cardiopulmonary inflammation via reduced mitophagy

Affiliations

SARS-CoV-2 spike protein induces IL-18-mediated cardiopulmonary inflammation via reduced mitophagy

Shuxin Liang et al. Signal Transduct Target Ther. .

Abstract

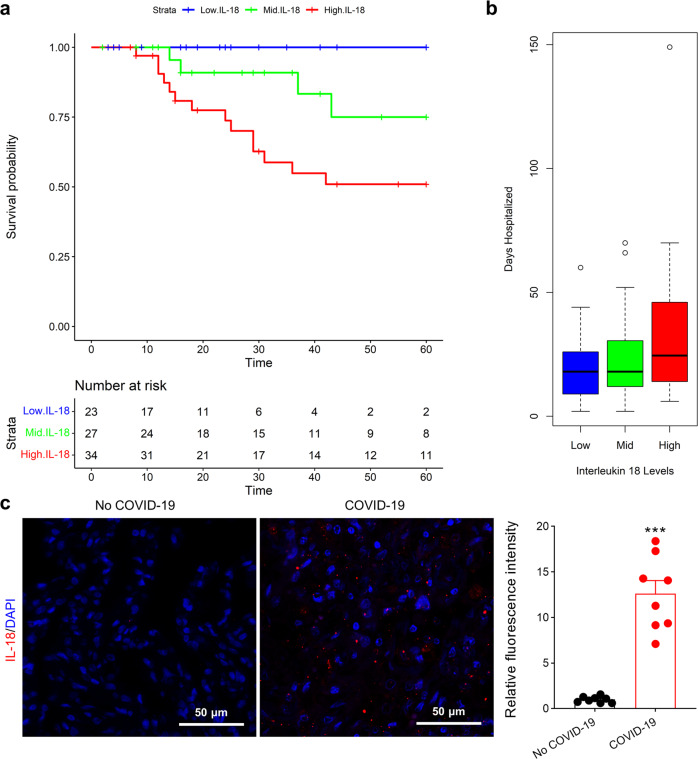
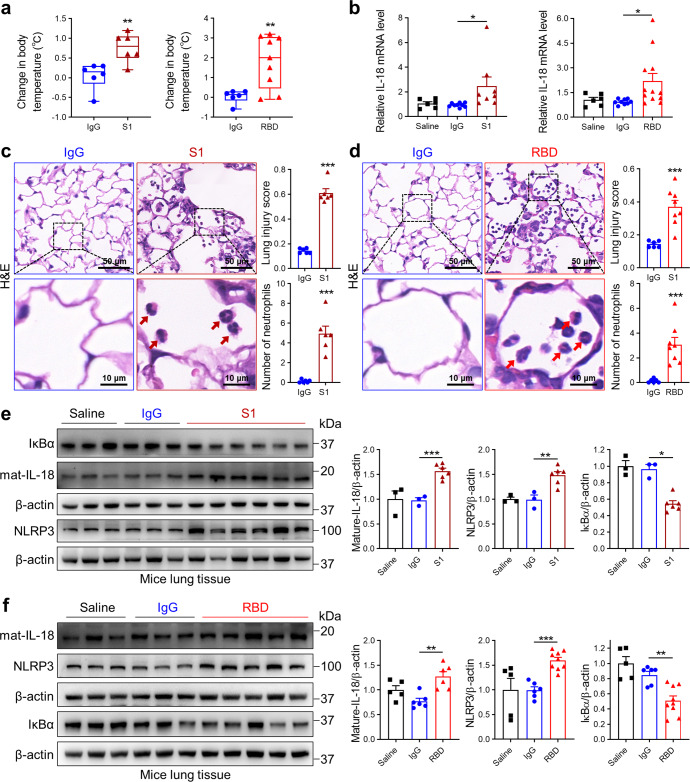
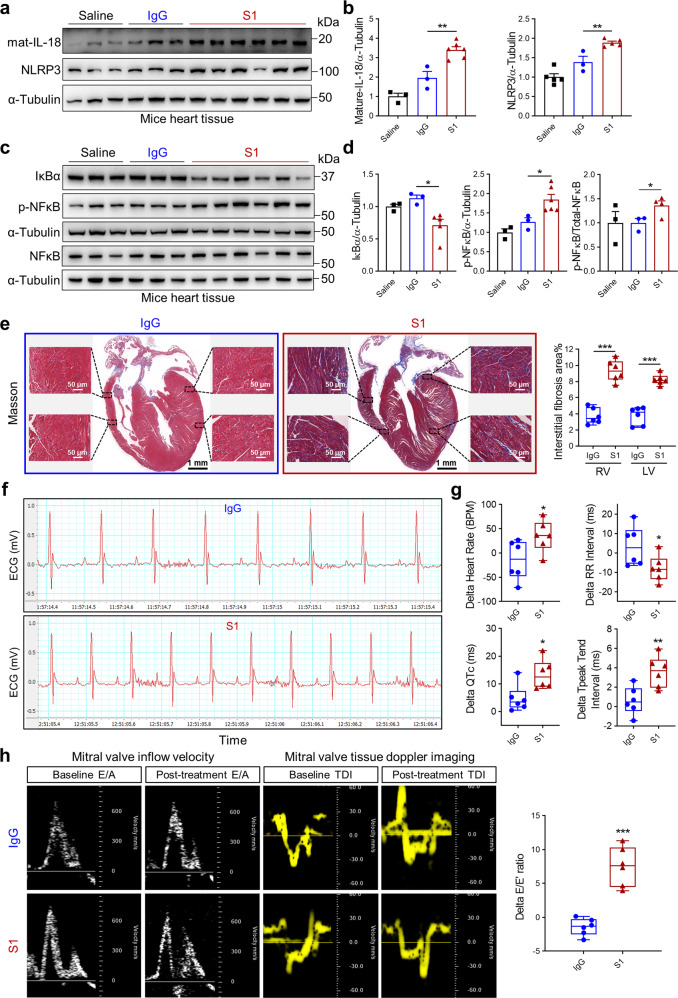
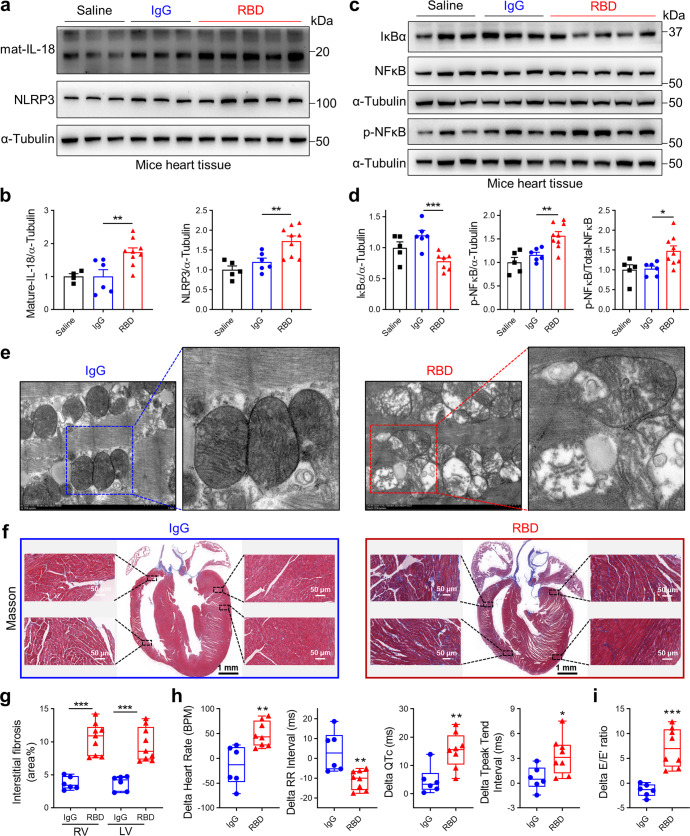
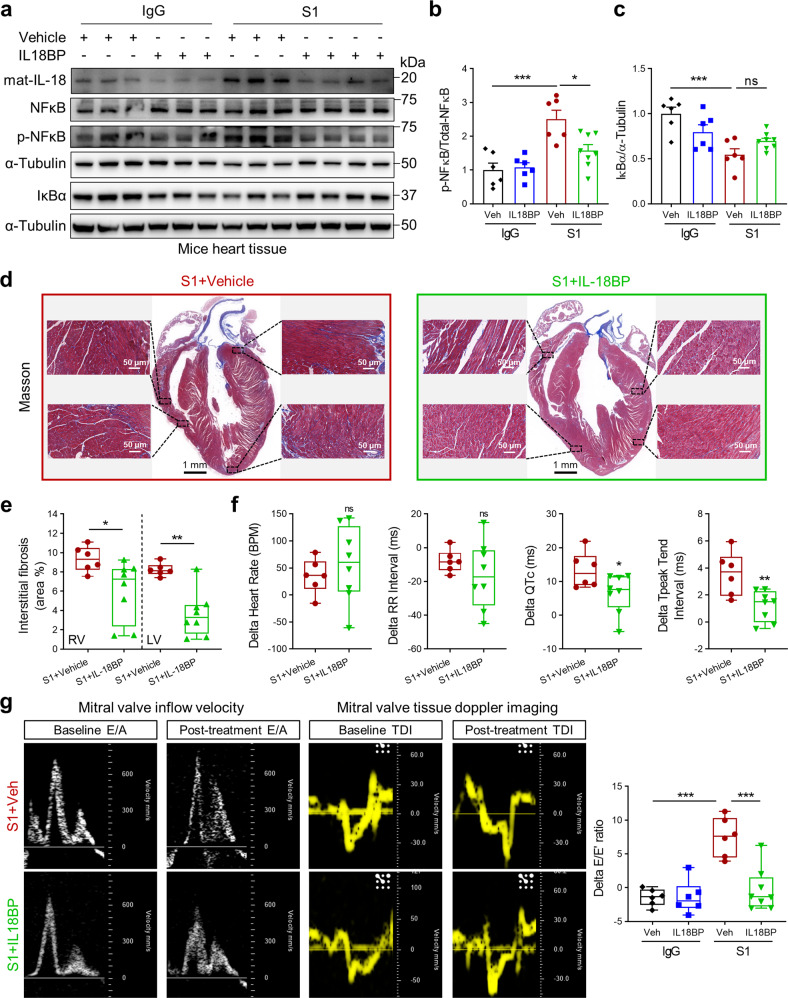
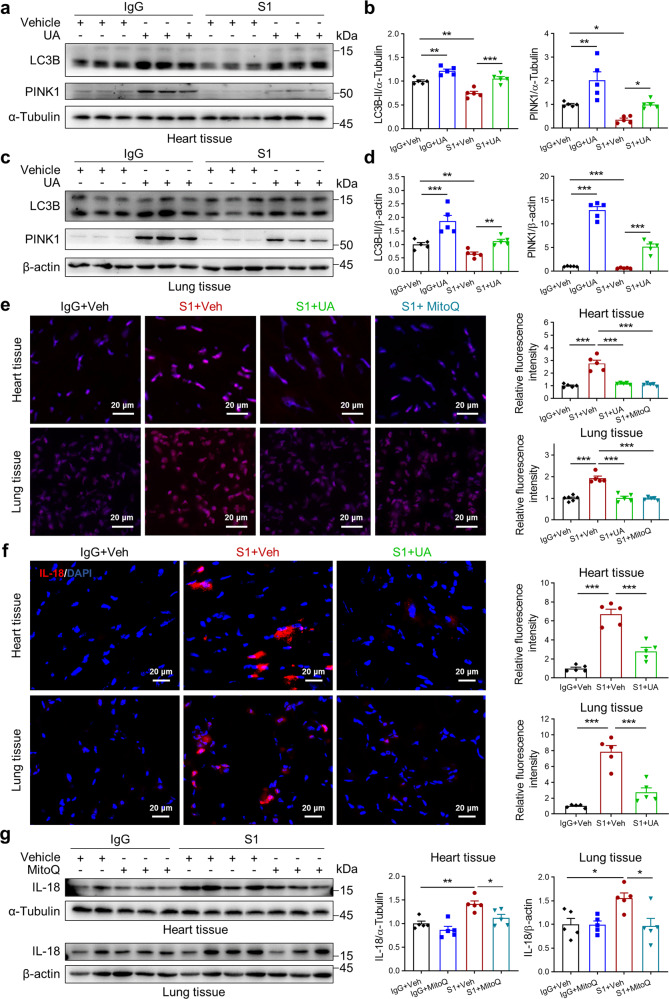
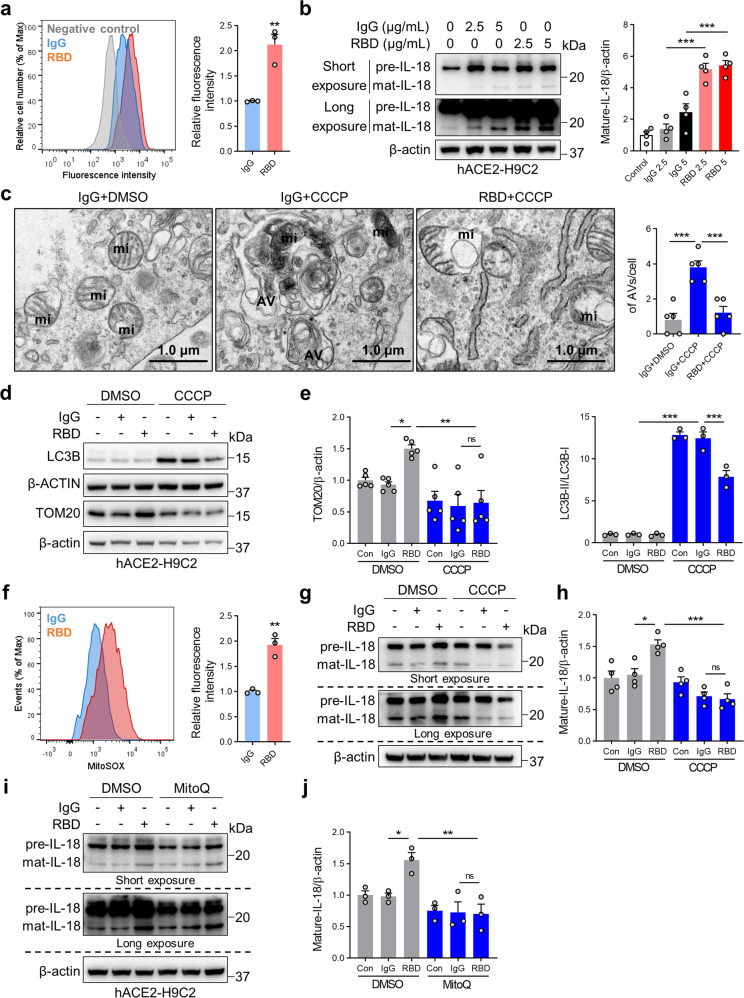
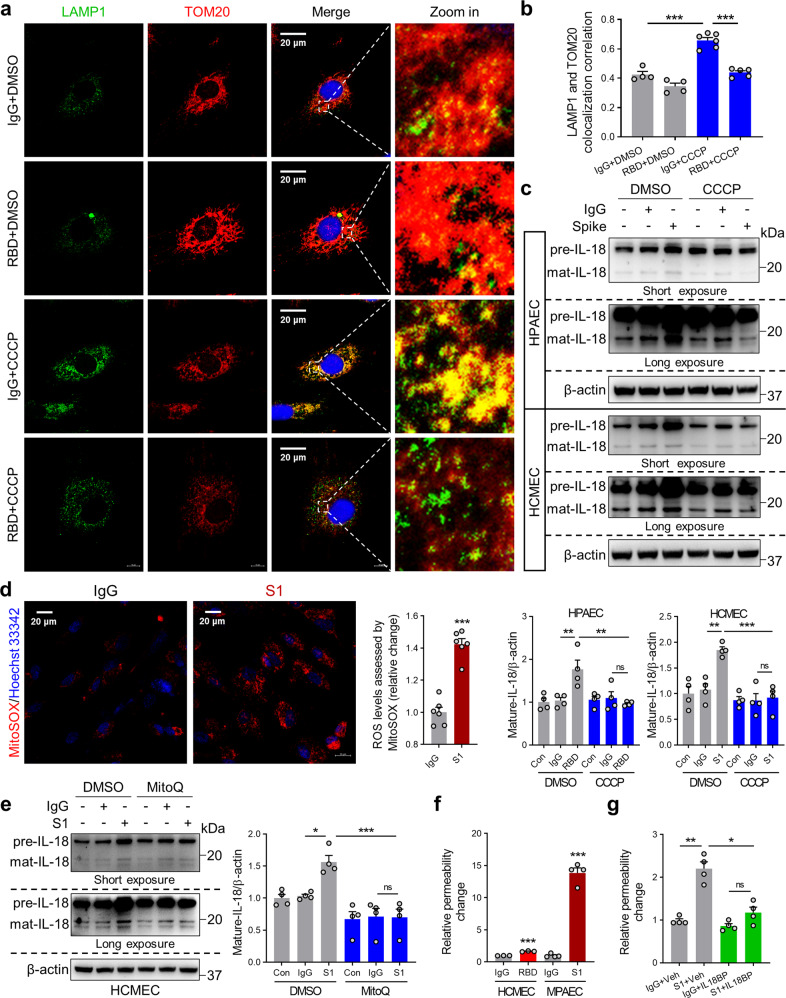
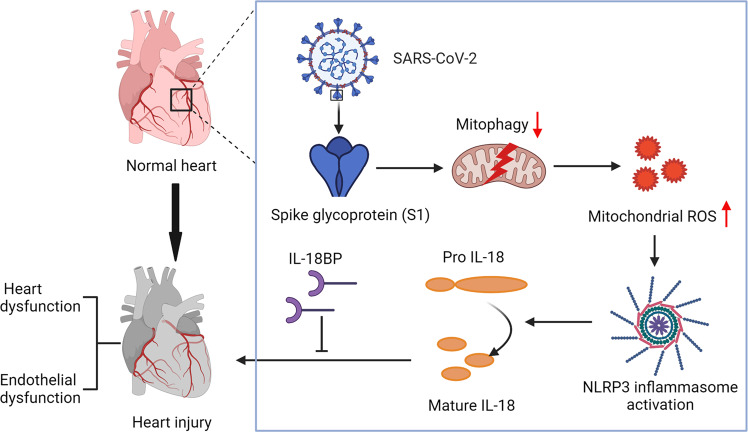
Cardiopulmonary complications are major drivers of mortality caused by the SARS-CoV-2 virus. Interleukin-18, an inflammasome-induced cytokine, has emerged as a novel mediator of cardiopulmonary pathologies but its regulation via SARS-CoV-2 signaling remains unknown. Based on a screening panel, IL-18 was identified amongst 19 cytokines to stratify mortality and hospitalization burden in patients hospitalized with COVID-19. Supporting clinical data, administration of SARS-CoV-2 Spike 1 (S1) glycoprotein or receptor-binding domain (RBD) proteins into human angiotensin-converting enzyme 2 (hACE2) transgenic mice induced cardiac fibrosis and dysfunction associated with higher NF-κB phosphorylation (pNF-κB) and cardiopulmonary-derived IL-18 and NLRP3 expression. IL-18 inhibition via IL-18BP resulted in decreased cardiac pNF-κB and improved cardiac fibrosis and dysfunction in S1- or RBD-exposed hACE2 mice. Through in vivo and in vitro work, both S1 and RBD proteins induced NLRP3 inflammasome and IL-18 expression by inhibiting mitophagy and increasing mitochondrial reactive oxygenation species. Enhancing mitophagy prevented Spike protein-mediated IL-18 expression. Moreover, IL-18 inhibition reduced Spike protein-mediated pNF-κB and EC permeability. Overall, the link between reduced mitophagy and inflammasome activation represents a novel mechanism during COVID-19 pathogenesis and suggests IL-18 and mitophagy as potential therapeutic targets.


Conflict of interest statement

The authors declare no competing interests.

Figures

Fig. 1
Fig. 1
Hospitalization burden and survival curves stratified by IL-18 levels after COVID-19 diagnosis. a Kaplan–Meier curves illustrate significant (P-value = 5.71E−03) overall survival differences stratified by IL-18 tertiles based on time from COVID-19 test to 60-day follow-up (discharge or death). There was worse survival if IL-18 levels were high (red, above cutoffs of 102 pg/mL versus green, 48.6–102 pg/mL versus blue, below cutoffs of 48.6 pg/mL). Each line indicates the predicted survival probability over follow-up time. b Boxplot of IL-18 tertiles and days spent hospitalized is plotted. c IL-18 fluorescence microscopy of human lung from COVID-19 patients vs. non-COVID-19 patients
Fig. 2
Fig. 2
Spike protein induces lung inflammation and IL-18 expression. Transgenic hACE2 mice were administered recombinant SARS-CoV-2 Spike S1 and RBD protein (5 μg/mouse/d) for via tracheal intubation. After 10 days, mice were sacrificed. a Body temperature change is more in Spike protein-treated mice compared to IgG-treated mice (Student’s t-test, N = 6–9). b IL-18 gene expression levels are higher in the blood of Spike protein-treated mice (Student’s t-test). c, d Lung sections were examined by hematoxylin and eosin staining. Representative micrographs, neutrophil cell count and scored for lung injury are shown (Student’s t-test, N = 6–8). Red arrows suggest neutrophils. e, f Representative western blots and quantifications of IκBα (Student’s t-test), IL-18 (Student’s t-test) and NLRP3 (Student’s t-test) in lung tissues from saline-, IgG- and RBD/S1 protein-treated mice (N = 3–9). Data indicate mean ± SE. *p < 0.05, **p < 0.01, ***p < 0.001 relative to IgG exposure
Fig. 3
Fig. 3
Spike 1 protein induces cardiac IL-18 expression, fibrosis, and heart dysfunction in hACE2-KI mice. a, b Western blots of IL-18 and NLRP3 levels in heart tissues. Quantitative data shown in right panel (b) (Student’s t-test, N = 3–5). Representative western blots showing protein levels of IκBα, NF-κB, phospho-NF-κB (c) and summarized data (d) in heart tissues (Student’s t-test, N = 3–6). e Representative Masson Trichrome staining images of heart from IgG- versus S1 protein-treated mice. Fibrosis area percentage was higher in S1 protein-treated mice heart tissues (Student’s t-test, N = 6). f, g Heart rate, RR interval, QTc interval, Tp-Te interval were measured by electrocardiograms (ECG) in mice after S1 exposure (Student’s t-test, N = 6). h Representative echocardiogram images of mitral valve inflow velocity and tissue doppler and summarized data showing impaired diastolic function (increased delta E/E’) after S1 exposure (Student’s t-test, N = 6). Values are mean ± SE. *p < 0.05, **p < 0.01, ***p < 0.001 relative to IgG exposure
Fig. 4
Fig. 4
Spike RBD protein induces cardiac IL-18 expression, fibrosis mitochondria injury, heart dysfunction in hACE2-KI mice. a, b Western blots of IL-18 and NLRP3 levels in heart tissues. Quantitative data shown in panel below (b) (Student’s t-test, N = 5–9). Representative western blots showing IκBα, NF-κB, phospho-NF-κB protein levels (c) and summarized data (d) in heart tissues (Student’s t-test, N = 5–9). e Representative images from transmission electron microscopy (TEM) after IgG and RBD treatment. f, g Representative Masson Trichrome staining images of heart from IgG- versus RBD protein-treated mice. Fibrosis area percentage was higher in RBD protein-treated mice heart tissues (Student’s t-test, N = 6–9). h Heart rate, RR interval, QTc interval, Tp-Te interval were measured by electrocardiograms (ECG) in mice after RBD exposure (Student’s t-test, N = 6–8). i Diastolic function was impaired (increased delta E/E’) after RBD exposure (Student’s t-test, N = 6–8). Values are mean ± SE. *p < 0.05, **p < 0.01, ***p < 0.001
Fig. 5
Fig. 5
IL-18BP reduces fibrosis and improves function in Spike protein-treated hACE2-KI mice. ac Western blots of IL-18, NF-κB, phospho-NF-κB and IκBα levels in heart tissues. Quantitative data shown in right panel (b, c) (1-way ANOVA test, N = 5–8). d, e Representative Masson Trichrome staining images of heart from IgG- versus S1 protein-treated mice with IL-18BP treatment. Fibrosis area percentage was reduced with IL-18BP injection (Student’s t-test, N = 6–8). f Heart rate, RR interval, QTc interval, Tp-Te interval were measured by electrocardiograms (ECG) in mice after S1 and IL-18BP exposure (Student’s t-test, N = 6–8). g IL-18BP exposure improved impaired diastolic function (1-way ANOVA test, N = 6–8). Values are mean ± SE. *p < 0.05, **p < 0.01, ***p < 0.001
Fig. 6
Fig. 6
Spike protein induces IL-18 expression via reduced mitophagy and increased mitoROS production in vivo. Western blots (a) and quantitative data (b) of LC3B and PINK1 levels in heart tissues from IgG- versus S1 protein-treated mice with UA treatment (1-way ANOVA test, N = 5). Western blots (c) and quantitative data (d) of LC3B and PINK1 levels in lung tissues from IgG- versus S1 protein-treated mice with UA treatment (1-way ANOVA test, N = 5). e Representative DHE staining images and quantitative data of heart and lung from IgG- versus S1 protein-treated mice with UA or MitoQ treatment (1-way ANOVA test, N = 5). Scale bar, 20 μm. f Representative immunofluorescence images and quantitative data showing stained IL-18 in heart and lung tissue from IgG- versus S1 protein-treated mice with UA treatment (1-way ANOVA test, N = 5). Nuclei counterstained with DAPI. Scale bar, 20 μm. g Western blots and quantitative data of IL-18 levels in heart and lung tissues from IgG- versus S1 protein-treated mice with MitoQ treatment (1-way ANOVA test, N = 5). Values are mean ± SE. *p < 0.05, **p < 0.01, ***p < 0.001
Fig. 7
Fig. 7
Spike protein augments IL-18 levels in H9C2 cells via impairment of mitophagy and mitochondrial ROS production. a After incubation with RBD protein (2.5 μg/mL) for 3 h, binding of RBD protein to human ACE2 was detected by FACS. Representative histograms (left panel) and summarized data (right panel) are presented. The X-axis represents fluorescence intensity, and the Y-axis shows cell number normalized as a percentage of the maximum (% of max) (Student’s t-test, N = 3). b IL-18 protein levels were measured using western blot (1-way ANOVA test, N = 4). c Representative TEM images of mitochondrial structure in hACE2-H9C2 cells treated with IgG (2.5 μg/mL) or RBD (2.5 μg/mL) protein in the presence of CCCP (10 μM) (1-way ANOVA test, N = 5). Representative immunoblot (d) and quantitative analysis (e) of LC3B and TOM20 in IgG (2.5 μg/mL) or RBD (2.5 μg/mL), -treated hACE2-H9C2 cells with or without CCCP (10 μM) (1-way ANOVA test, N = 5). f Flow cytometry of hACE2-H9C2 cells labeled with MitoSOX Red after treatment with RBD protein. Data are representative of three independent experiments (Student’s t-test, N = 3). g, h Western blot analysis of IL-18 in the presence of CCCP (10 μM) and RBD protein (2.5 μg/mL) (1-way ANOVA test, N = 4). i, j hACE2-H9C2 cells were treated with IgG (2.5 μg/mL) or RBD (2.5 μg/mL) protein in the presence of MitoQ (1 μM) or DMSO incubated for 1 h. Samples were immunoblotted with IL-18 antibody (1-way ANOVA test, N = 3). Data are shown as the mean ± SE. *p < 0.05, **p < 0.01, ***p < 0.001, ns no significant differences. AV autophagic vacuole; mi mitochondrion
Fig. 8
Fig. 8
Spike protein induces IL-18 expression via impairment of mitophagy resulting in EC permeability. Representative immunofluorescence images (a) and summary data (b) showing stained TOM20 and LAMP1 in HPAEC in the presence of CCCP (10 μM) and RBD protein (2.5 μg/mL) (1-way ANOVA test, N = 4–6). Nuclei counterstained with DAPI. Scale bar, 20 μm. c Protein extracts were subjected to western blot analysis for IL-18 after CCCP and RBD/S1 (2.5 μg/mL) protein treatment in HPAEC and HCMEC (1-way ANOVA test, N = 4). d Representative images of MitoROX staining and quantitative analysis of fluorescence intensity in IgG- and S1 protein-treated HCMEC. Scale bar, 20 μm (Student’s t-test, N = 6). e Representative immunoblots and quantitative analysis of IL-18 in HCMEC with or without IgG (2.5 μg/mL) or S1 (2.5 μg/mL) protein and MitoQ (1 μM) stimulation (1-way ANOVA test, N = 4). f Measurement of endothelial cell permeability in HCMEC or mice primary PAEC (MPAEC) treated with Spike protein (Student’s t-test, N = 3–4). g Measurement of permeability in HPAEC treated with S1 protein (5 μg/mL) and IL-18BP (2 μg/mL) (1-way ANOVA test, N = 4). Results represent means ± SE. *p < 0.05, **p < 0.01, ***p < 0.001. ns no significant differences
Fig. 9
Fig. 9
Model illustrating the associations between SARS-CoV-2 signaling, mitophagy inhibition, IL-18 activation, and heart injury. Upon infection, Spike protein can inhibit mitophagy and induces mitochondrial ROS production, thus leading to inflammasome activation, IL-18 maturation, and the occurrence of heart injury. The schematic illustration was designed by BioRender

References

    1. Agricola E, et al. Heart and lung multimodality imaging in COVID-19. JACC Cardiovasc. Imaging. 2020;13:1792–1808. doi: 10.1016/j.jcmg.2020.05.017. - DOI - PMC - PubMed
    1. Merad M, Martin JC. Pathological inflammation in patients with COVID-19: a key role for monocytes and macrophages. Nat. Rev. Immunol. 2020;20:355–362. doi: 10.1038/s41577-020-0331-4. - DOI - PMC - PubMed
    1. Turnquist C, Ryan BM, Horikawa I, Harris BT, Harris CC. Cytokine storms in cancer and COVID-19. Cancer Cell. 2020;38:598–601. doi: 10.1016/j.ccell.2020.09.019. - DOI - PMC - PubMed
    1. Rodrigues TS, et al. Inflammasomes are activated in response to SARS-CoV-2 infection and are associated with COVID-19 severity in patients. J. Exp. Med. 2021;218:e20201707. doi: 10.1084/jem.20201707. - DOI - PMC - PubMed
    1. Chi Y, et al. Serum cytokine and chemokine profile in relation to the severity of coronavirus disease 2019 in China. J. Infect. Dis. 2020;222:746–754. doi: 10.1093/infdis/jiaa363. - DOI - PMC - PubMed

Publication types