. 2023 Mar 9;14(1):1293.
doi: 10.1038/s41467-023-36759-8.

N-acetylneuraminic acid links immune exhaustion and accelerated memory deficit in diet-induced obese Alzheimer's disease mouse model

Affiliations

N-acetylneuraminic acid links immune exhaustion and accelerated memory deficit in diet-induced obese Alzheimer's disease mouse model

Stefano Suzzi et al. Nat Commun. .

Abstract

Systemic immunity supports lifelong brain function. Obesity posits a chronic burden on systemic immunity. Independently, obesity was shown as a risk factor for Alzheimer's disease (AD). Here we show that high-fat obesogenic diet accelerated recognition-memory impairment in an AD mouse model (5xFAD). In obese 5xFAD mice, hippocampal cells displayed only minor diet-related transcriptional changes, whereas the splenic immune landscape exhibited aging-like CD4+ T-cell deregulation. Following plasma metabolite profiling, we identified free N-acetylneuraminic acid (NANA), the predominant sialic acid, as the metabolite linking recognition-memory impairment to increased splenic immune-suppressive cells in mice. Single-nucleus RNA-sequencing revealed mouse visceral adipose macrophages as a potential source of NANA. In vitro, NANA reduced CD4+ T-cell proliferation, tested in both mouse and human. In vivo, NANA administration to standard diet-fed mice recapitulated high-fat diet effects on CD4+ T cells and accelerated recognition-memory impairment in 5xFAD mice. We suggest that obesity accelerates disease manifestation in a mouse model of AD via systemic immune exhaustion.


Conflict of interest statement

M. Schwartz is a consultant of ImmunoBrain Checkpoint LTD. The remaining authors declare no competing interests.

Figures
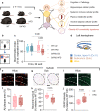
Fig. 1
Fig. 1. High-fat diet accelerated disease manifestations relative to control diet in 5xFAD mice.
a Overview of the experimental strategy. a, c Reduction in novelty discrimination in HFD-fed 5xFAD mice. Evaluation of cognition with the NOR test (b) at 8 mo, 24 weeks of diet (wod; c). Mice from two independent experiments, sample n: WT CD = 13, WT HFD = 16, 5xFAD CD = 15, 5xFAD HFD = 12. Statistical analyses: two-way ANOVA followed by Fisher’s LSD post hoc test. d, Brain regions analyzed for histopathology. e, f Assessment of Aβ plaques load in the hippocampal hilus of 5xFAD mice. g, h Neuronal survival in the subiculum (Sub) of 5xFAD mice. i, j, Glial fibrillary acidic protein (GFAP)-immunoreactivity in the hippocampal hilus of 5xFAD mice. e, g, i Representative images, left: CD, right: HFD, scale bars: 70 μm. f, h, j Mice from two independent experiments, sample n: f, 5xFAD CD = 10, 5xFAD HFD = 10; h, 5xFAD CD = 9, 5xFAD HFD = 10; j, 5xFAD CD = 9, 5xFAD HFD = 9. h Data normalized by average WT CD value (Supplementary Fig. 3b). j Data normalized by average WT CD value (Supplementary Fig. 3c). Statistical analyses: two-tailed unpaired Student’s t test. c, f, h, j Box plots represent the minimum and maximum values (whiskers), the first and third quartiles (box boundaries), the median (box internal line), and the mean (cross). Statistical analyses: two-way ANOVA followed by Fisher’s LSD post hoc test. Source data are provided as a Source Data file.
Fig. 2
Fig. 2. AD and HFD-related changes in the cellular landscape of the mouse hippocampus.
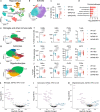
a UMAP embedding of 237,631 single nuclei profiles (sNuc-Seq), colored after post hoc cell type annotation. Mice from five independent experiments, sample n = 28. For quantifications and statistical analyses, 219,237 nuclei were included from n = 26 samples: WT CD = 6, WT HFD = 7, 5xFAD CD = 6, 5xFAD HFD = 7 (Methods, Cell fraction estimations and statistics section). CA1–3, cornu Ammonis region 1–3; DG, dentate gyrus; ExN, excitatory neurons; GABA, GABAergic neurons; OPCs, oligodendrocyte precursor cells. b, c Sub-clustering analysis of the DG granule neurons (ExN DG). Sample n: see a. b UMAP embedding of sNuc-Seq profiles colored by cluster. c Changes in frequency of DG1 cluster across experimental conditions; DG2–4 clusters are shown in Supplementary Fig. 5a. d Pathway analysis of the genes associated with DG1 showing enrichment of pathways related to neuronal differentiation, integration, and growth (FDR-adjusted hypergeometric test P-value <0.050). ej Sub-clustering analysis of the brain’s immune cells including microglia (e, f), astrocytes (g, h), and oligodendrocytes (i, j). Sample n: see a. e, g, i UMAP embedding of sNuc-Seq profiles colored by cluster. f, h, j Changes in frequency of cell types across experimental conditions. Abbreviations: AST1–3, astrocyte clusters 1–3; COPs, committed oligodendrocyte precursors; DAAs, disease-associated astrocytes; DAMs, disease-associated microglia; DOLs, disease-associated oligodendrocytes; HMG, homeostatic microglia; OLG1, 2, oligodendrocyte clusters 1, 2; PVMs, perivascular macrophages; RMG, replicating microglia. c, f, h, j Box plots represent the minimum and maximum values (whiskers), the first and third quartiles (box boundaries), the median (box internal line), and the mean (cross). Statistical analyses: two-way ANOVA followed by Fisher’s LSD post hoc test. Source data are provided as a Source Data file. km HFD-induced gene expression programs in microglia (k), astrocytes (l), and oligodendrocytes (m) in 5xFAD mice. Volcano plot representation of differentially expressed genes in HFD-fed 5xFAD mice (n = 7) compared to CD-fed 5xFAD controls (n = 6). Apoe, downregulated in both microglia and astrocytes, is highlighted in bold. X-axis: average log2 fold change (HFD relative to CD); Y-axis: FDR-adjusted MAST test P-value <0.010 (–log10).
Fig. 3
Fig. 3. Splenic CD4+ T-cell rearrangements in HFD-fed 5xFAD mice.
ac CD4+ T-cell immune deviations in HFD-fed 5xFAD mice. Flow cytometric quantification of splenic frequencies of CD4+ naive T cells (CD44lowCD62Lhigh; a), CD4+ TEMs (CD44highCD62Llow; b), and CD4+FOXP3+ Tregs (c). Mice from two independent experiments, sample n: WT CD = 16, WT HFD = 19, 5xFAD CD = 18, 5xFAD HFD = 18. Statistical analyses: two-way ANOVA followed by Fisher’s LSD post hoc test. df Characterization of the CD4+ TEM compartment by mass cytometry. Cryopreserved splenocytes from mice evaluated for both cognition (NOR test; Fig. 1c) and systemic immune phenotype (Fig. 3a–c) were used for CyTOF analysis of the CD4+ TEM compartment, sample n: WT CD = 5, WT HFD = 5, 5xFAD CD = 5, 5xFAD HFD = 5. d UMAP embedding of CD4+ TEM cell clusters (2000 cells, randomly selected from each animal). FlowSOM-based immune cell populations are overlaid as a color dimension. e Mean population expression levels of markers used for UMAP visualization and FlowSOM clustering of CD4+ TEMs. f Increased frequency of exhausted TEMs in HFD-fed 5xFAD mice. Sub-clustering analysis of the CD4+ TEM compartment identified six clusters; Cluster 6 only is shown here, Clusters 1 to 5 are shown in Supplementary Fig. 9a. Statistical analyses: two-way ANOVA followed by Fisher’s LSD post hoc test. ac, f Box plots represent the minimum and maximum values (whiskers), the first and third quartiles (box boundaries), the median (box internal line), and the mean (cross). Source data are provided as a Source Data file.
Fig. 4
Fig. 4. High plasma levels of free NANA in HFD-fed 5xFAD mice.
ad Metabolite profiling of plasma samples collected from some of the male mice that were evaluated for both cognition (NOR test; Fig. 1c) and systemic immune phenotype (Fig. 3a–c), sample n: WT CD = 4, WT HFD = 5, 5xFAD CD = 5, 5xFAD HFD = 6. a Heatmap representation of the plasma metabolites whose linear regression models had unadjusted one-way omnibus ANOVA test P-value <0.050 (46 out of 229 total identified metabolites). Each column represents one metabolite and each row one sample (mouse). Asterisks indicate the metabolites of interest (22 in total; Methods). The red box highlights the block of metabolites whose overall levels trended highest in HFD-fed 5xFAD mice, which include N-acetylneuraminic acid (NANA; cyan box and green arrowhead). Complete list of identified metabolites, regression coefficients, and exact P-values is provided in Supplementary Data 3, “cell means model” tab. b, ρ-ρ plot (Methods). The red diagonal discriminates between metabolites associated with high NOR discrimination index (DI) and low splenic Tregs abundance (% out of total CD4+ T cells; quadrant II) and metabolites associated with low NOR DI and high splenic Tregs % (quadrant IV). The position of NANA (inset) is indicated by the green arrow. c, d Simple linear regression (black line) and Spearman’s rank correlation (ρ coefficient, two-tailed P-value) between NANA levels, as quantified after plasma metabolite profiling, and NOR discrimination index (DI; c) and splenic Tregs abundance (d); arb. u., arbitrary unit (normalized peak area/100,000). e Quantification of plasma NANA using a fluorometric assay of both female and male mice that were evaluated for both cognition (NOR test; Fig. 1c) and systemic immune phenotype (Fig. 3a–c), also including the same animals described in (ad), sample n: WT CD = 14, WT HFD = 17, 5xFAD CD = 16, 5xFAD HFD = 14. Statistical analyses: two-way ANOVA followed by Fisher’s LSD post hoc test. Box plots represent the minimum and maximum values (whiskers), the first and third quartiles (box boundaries), the median (box internal line), and the mean (cross). be Source data are provided as a Source Data file.
Fig. 5
Fig. 5. Neu1-expressing macrophages in the mouse visceral adipose tissue are a potential source of NANA.
a Cellular landscape of the mouse visceral adipose tissue (VAT) immune cells across all genotype and diet conditions. UMAP embedding of single nuclei profiles (sNuc-Seq), colored after post hoc cell type annotation. Mice from three independent experiments, sample n: WT CD = 10, WT HFD = 6, 5xFAD CD = 9, 5xFAD HFD = 13. b HFD increased the frequency of VAT macrophages (MACs). Changes in frequency of the other VAT immune cell types are shown in Supplementary Fig. 11e. Annotations are as in Supplementary Fig. 11d, e. Sample n: see a. c Dot plots featuring the expression of sialidase Neu genes (color scale) and the percentage of cells expressing them (dot size) in the overall VAT (left) and VAT immune compartment (right). Of the four mammalian Neu genes, only Neu1 and Neu3 transcripts were detected. d HFD increased the frequency of Neu1-expressing macrophages in the VAT. Sample n: see (a). b, d Statistical analyses: two-way ANOVA followed by Fisher’s LSD post hoc test. Box plots represent the minimum and maximum values (whiskers), the first and third quartiles (box boundaries), the median (box internal line), and the mean (cross). Source data are provided as a Source Data file.
Fig. 6
Fig. 6. NANA induced human T-cell exhaustion in vitro.
ae Effect of NANA on human T cells from peripheral blood cultured in vitro. a Schematic presentation of treatment regimen. be Assessment of proliferative ability (b, c) and PD-1 geometric mean fluorescence intensity (gMFI; d, e) in human CD4+ T cells. The shown experiment is one of three independent experiments where different NANA concentrations were tested (Methods, Data reporting section). Sample n = 4 individuals. From each individual, one aliquot of T cells was treated with NANA, and one with medium as control. Statistical analyses: paired two-tailed Student’s t test. b, d Black lines connect paired points. c, e Histograms of representative samples. f, g Bulk RNA-Seq of the same human T-cell cultures in (ae). f Heatmap showing significantly (FDR-adjusted DESeq2 P-value <0.050) upregulated (red) and downregulated genes (blue). Each column represents one individual and each row one gene. For each individual, gene expression values are expressed as log-transformed fold-changes (NANA versus medium control). g Bar plot showing significantly (FDR-adjusted hypergeometric test P-value <0.050) upregulated (red) and downregulated (blue) pathways. be, g Source data are provided as a Source Data file.
Fig. 7
Fig. 7. NANA administration induced CD4+ T-cell deregulation in vivo and accelerated cognitive decline in 5xFAD mice.
ac Effect of NANA administration on the spleen immune profile of WT mice. a Schematic presentation of treatment regimen. NANA or PBS control was subcutaneously injected twice a day, once in the morning (white arrowheads) and once in the evening (black arrowheads), for 7 consecutive days. b, c Flow cytometric quantification of splenic frequencies of CD4+ naive T cells (CD44lowCD62Lhigh), CD4+ TEMs (CD44highCD62Llow), CD4+FOXP3+CD25+ Tregs, and CD4+PD1+ T cells in young-adult (b) and middle-aged mice (c). For both (b) and (c), data from two independent experiments, sample n: b, PBS = 7, NANA = 7; c, PBS = 7, NANA = 8. Statistical analyses: b, multiple two-tailed unpaired Student’s t tests; c, multiple two-tailed unpaired Student’s t tests with Welch’s correction (Methods, Statistical analyses section). df Effect of NANA on novelty discrimination and CD4+ T-cell profile in 5xFAD female mice. d Schematic presentation of treatment regimen. 5xFAD female mice were treated with NANA or PBS control as in (a); PBS-injected age-matched WT female controls were also included. Three weeks after the last injection, novelty discrimination was assessed using the NOR test. e Results of the NOR test. Data from three independent cohorts, age at cognitive assessment: 9, 10, and 11.5 mo, sample n: WT PBS = 7, 5xFAD PBS = 11, 5xFAD NANA = 13. Statistical analyses: one-way ANOVA followed by Fisher’s LSD post hoc test. f Spleen CD4+ T-cell profile. Data from two of the three cohorts described in (e), age at cognitive assessment: 9 and 11.5 mo, sample n: 5xFAD PBS = 6, 5xFAD NANA = 8. Statistical analyses: multiple two-tailed unpaired Student’s t tests. b, c, e, f Box plots represent the minimum and maximum values (whiskers), the first and third quartiles (box boundaries), the median (box internal line), and the mean (cross). Source data are provided as a Source Data file.

Comment in

References

    1. Barnes DE, Yaffe K. The projected effect of risk factor reduction on Alzheimer’s disease prevalence. Lancet. Neurol. 2011;10:819–828. doi: 10.1016/S1474-4422(11)70072-2. - DOI - PMC - PubMed
    1. Norton S, Matthews FE, Barnes DE, Yaffe K, Brayne C. Potential for primary prevention of Alzheimer’s disease: an analysis of population-based data. Lancet. Neurol. 2014;13:788–794. doi: 10.1016/S1474-4422(14)70136-X. - DOI - PubMed
    1. Filiano AJ, et al. Unexpected role of interferon-γ in regulating neuronal connectivity and social behaviour. Nature. 2016;535:425–429. doi: 10.1038/nature18626. - DOI - PMC - PubMed
    1. Ziv Y, et al. Immune cells contribute to the maintenance of neurogenesis and spatial learning abilities in adulthood. Nat. Neurosci. 2006;9:268–275. doi: 10.1038/nn1629. - DOI - PubMed
    1. Shi Y, Holtzman DM. Interplay between innate immunity and Alzheimer disease: APOE and TREM2 in the spotlight. Nat. Rev. Immunol. 2018;18:759–772. doi: 10.1038/s41577-018-0051-1. - DOI - PMC - PubMed

Publication types

Substances