. 2023 Mar 9;13(1):3963.
doi: 10.1038/s41598-023-29846-9.

Initiation and modulation of Tau protein phase separation by the drug suramin

Affiliations

Initiation and modulation of Tau protein phase separation by the drug suramin

Prabhu Rajaiah Prince et al. Sci Rep. .

Abstract

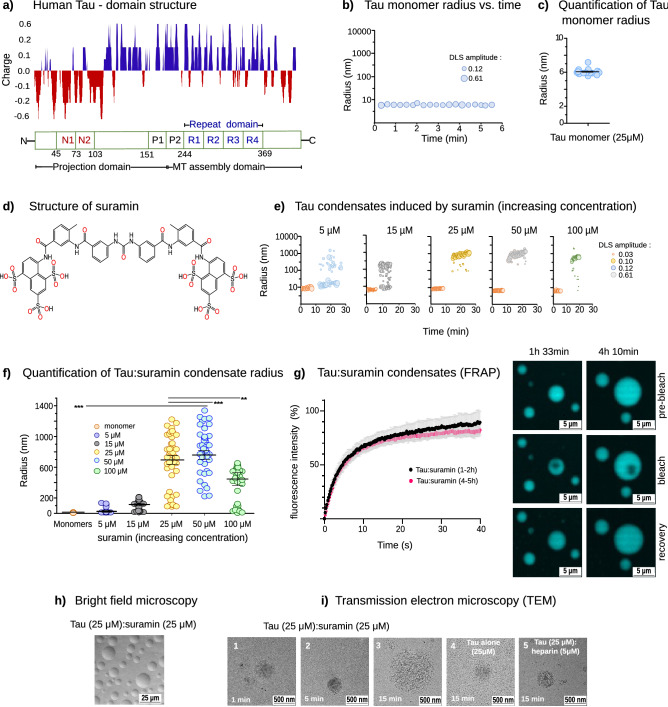
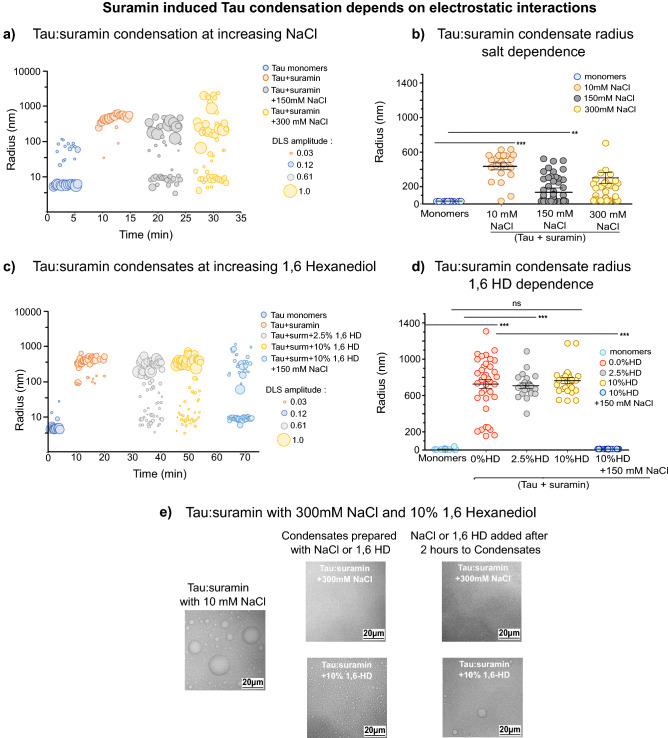
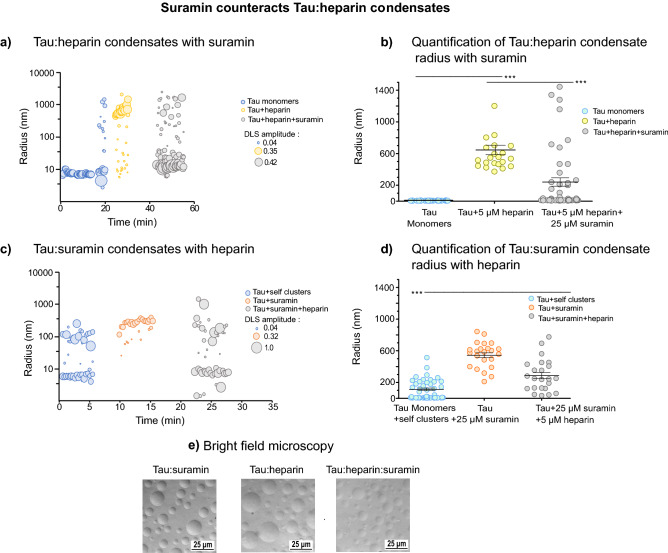
Tau is an intrinsically disordered neuronal protein in the central nervous system. Aggregated Tau is the main component of neurofibrillary tangles observed in Alzheimer's disease. In vitro, Tau aggregation can be triggered by polyanionic co-factors, like RNA or heparin. At different concentration ratios, the same polyanions can induce Tau condensates via liquid-liquid phase separation (LLPS), which over time develop pathological aggregation seeding potential. Data obtained by time resolved Dynamic Light Scattering experiments (trDLS), light and electron microscopy show that intermolecular electrostatic interactions between Tau and the negatively charged drug suramin induce Tau condensation and compete with the interactions driving and stabilizing the formation of Tau:heparin and Tau:RNA coacervates, thus, reducing their potential to induce cellular Tau aggregation. Tau:suramin condensates do not seed Tau aggregation in a HEK cell model for Tau aggregation, even after extended incubation. These observations indicate that electrostatically driven Tau condensation can occur without pathological aggregation when initiated by small anionic molecules. Our results provide a novel avenue for therapeutic intervention of aberrant Tau phase separation, utilizing small anionic compounds.


Conflict of interest statement

The authors declare no competing interests.

Figures

Figure 1
Figure 1
(a) Domain structure of human Tau (2N4R isoform), and charge distribution at pH 7.4. MT (Microtubule assembly domain), Projections domain and Repeat domain. (b) Representative time resolved DLS (trDLS) detection of 25 μM Tau monomers in solution. The DLS radius plot represents radii of Tau monomers in solution (~ 6 to 8 nm) (x-axis) over time (y-axis). The radii dimension corresponds to DLS amplitudes, which are proportional to the intensity of scattered light of the respective particles. (c) Quantification of Tau monomer radius. Radii of monomers were calculated from three independent experiments representing more than 15 data points compliant with the autocorrelation, and are shown as mean ± SEM. (d) Structure of suramin (prepared by ACD/ChemSketch 12.0). The molecule is elongated and 8.7 nm apart (PDB 3bf6) and carries 6 sulfonate groups (neg. charge − 6), 3 at each end. (e) Tau condensates with suramin at increasing concentration. Representative trDLS data of 25 μM Tau with the addition of 5, 15, 25, 50, 100 μM suramin after ~ 10 min. interval. Radius plot show an increase of condensate dimensions upon suramin addition in low salt buffer. The condensates radii dimensions correspond to DLS amplitudes, which are proportional to the intensity of scattered light of the respective particles. (f) Quantification of Tau:suramin condensates at increasing suramin concentration. Tau:suramin condensate radius were calculated from 2 independent experiments, representing more than 20 data points, compliant with the autocorrelation and are shown as mean ± SEM. The data have been compared by one-way ANOVA with Tukey test for multiple comparison. *P < 0.05, **P < 0.01, ***P < 0.001, ****P < 0.0001. (g) FRAP measurements of Tau (25 μM): suramin (25 μM) condensates 1–2 h and 4–5 h after LLPS induction in 25 mM HEPES pH 7.4, 10mM NaCl, 1 mM DTT. Representative images of FRAP recovery are shown on the right. Scale bars correspond to 5 μm. Data shown as mean ± SD, n = 20–22 condensates per condition and time point. (h) Brightfield microscopy of Tau condensates formed upon equimolar addition of suramin (25 μM). Scale bar corresponds to 25 μm. (i) Transmission electron microscopy (TEM) micrographs of Tau:suramin condensates at 1, 5 and 15 min after suramin (25 μM) addition to Tau (25 μM) in low salt buffer. The Tau:suramin condensates were uniformly globular in shape and ~ 500 to 1000 nm in dimensions ROI (region of interest) (i.1–3). The Tau:suramin condensates were positively stained (2% Uranyl acetate). The samples (i.4–5) show condensates after 15 min incubation of Tau alone (i.4) and with heparin (i.5) as control. Tau without suramin resembles mesoscopic Tau clusters with globular shape and have a dimension in the range of ~ 100 nm. Scale bar corresponds to 500 nm.
Figure 2
Figure 2
Suramin induced Tau condensation depends on electrostatic interactions. (a) Representative trDLS of Tau condensation in low salt buffer, with gradient increase of NaCl. trDLS of 25 μM Tau with addition of 25 μM suramin after ~ 7 to 10 min, followed by addition of 150 mM NaCl (at ~ 17 min), and to 300 mM NaCl (at ~ 25 min). The condensates start to dissolve into monomers and larger aggregates upon increasing the ion concentration to 150 mM or higher. Data point radius sizes correspond to DLS amplitudes, which are proportional to the intensity of scattered light of the respective particles. (b) Quantification of salt dependent Tau:suramin condensate radius. Radii of condensates were calculated from 2 independent experiments representing more than 20 data points and are shown as mean ± SEM. Data have been compared by one-way ANOVA with Tukey test for multiple comparison. *P < 0.05, **P < 0.01, ***P < 0.001, ****P < 0.0001. (c) Representative trDLS of Tau condensation at increasing 1, 6 Hexanediol (1,6 HD). trDLS of 25 μM Tau with addition of 25 μM suramin after ~ 7 to 10 min, followed by addition of 2.5% 1,6-HD (at ~ 30 min) and 10% (at ~ 45 min), and upon increasing the NaCl concentration to 150 mM (at ~ 80 min). The condensates are moderately stable in 1,6 HD but start to dissolve into monomers and larger aggregates upon increasing the ion concentration to 150 mM NaCl. Data points of the radius dimension correspond to DLS amplitudes, which are proportional to the intensity of scattered light of the respective particles. (d) Quantification of 1, 6 Hexanediol (1,6 HD) dependent Tau:suramin condensate radii. Radii of condensates were calculated from 2 independent experiments, representing more than 20 data points and are shown as mean ± SEM. Data have been compared by one-way ANOVA with Tukey test for multiple comparison. *P < 0.05, **P < 0.01, ***P < 0.001, ****P < 0.0001. (e) Brightfield microscopy of Tau (25 μM):suramin (25 μM) condensates in low salt (10 mM NaCl) and high salt (300 mM NaCl) conditions or with 10% 1,6 Hexanediol; buffer (25 mM HEPES pH 7.4, 10mM NaCl, 1 mM DTT). Scale bar corresponds to 20 μm.
Figure 3
Figure 3
Suramin counteracts Tau:heparin condensates. (a) Tau:heparin condensates with suramin. Representative size distribution of Tau:heparin condensates at 25 μM Tau in low salt (10 mM NaCl) buffer with the addition of 5 μM heparin after ~ 20 min, followed by addition of 25 μM suramin (at ~ 40 min). trDLS detects Tau:heparin condensates (radii ~ 500 nm) and with addition of 25 μM suramin after ~ 10 min. results in the generation of smaller Tau:heparin condensates with a radii of ~ 200 nm. Data point radii correspond to DLS amplitudes, which are proportional to the intensity of scattered light of the respective particles. (b) Quantification of Tau:heparin condensate radii with suramin. Radii of condensates were calculated from 2 to 3 independent experiments, representing more than 20 data points, are shown as mean ± SEM. Data have been compared by one-way ANOVA with Tukey test for multiple comparison. *P < 0.05, **P < 0.01, ***P < 0.001, ****P < 0.0001. (c) Tau:suramin condensates with heparin. Representative size distribution of Tau:suramin condensates at 25 μM Tau in low salt (10 mM NaCl) buffer. Time resolved DLS (trDLS) detects Tau monomers (radii ~ 7 to 10 nm) and mesoscopic Tau clusters (radii ~ 100 to 200 nm), the addition of 25 μM suramin after ~ 10 min induced the formation of Tau:suramin condensates with radii of 400–800 nm, at the cost of monomers and mesoscopic clusters in the solution. This was followed by the addition of 5 μM heparin after ~ 20 min, which results in the generation of smaller Tau:suramin condensates with radii of ~ 200 nm. Data point radius sizes correspond to DLS amplitudes, which are proportional to the intensity of scattered light of the respective particles. (d) Quantification of Tau:suramin condensate radii with heparin. Radii of condensates were calculated from 2 to 3 independent experiments, representing more than 20 data points are shown as mean ± SEM. Data have been compared by one-way ANOVA with Tukey test for multiple comparison. *P < 0.05, **P < 0.01, ***P < 0.001, ****P < 0.0001. (e) Brightfield microscopy of Tau:suramin, Tau:heparin, and Tau:heparin:suramin condensates (25 μM Tau, 0.014 mg/ml = ~0.8 μM heparin, 25 μM suramin in 25 mM HEPES, 10 mM NaCl, 1 mM DTT pH 7.4). Scale bar corresponds to 25 μm.
Figure 4
Figure 4
Tau:suramin condensates alone or in combination with heparin modulates seeding potential in cells. (a) Representative epifluorescence microscopy images of HEK sensor cells treated with 24 h-old Tau:heparin and Tau:suramin condensates. Tau incubated with heparin and suramin together (added to Tau at the same time) showed reduced seeding activity compared to Tau:heparin coacervates. Scale bar corresponds to 50 μm. (b) Quantification of aggregates per cell in cells treated with different Tau condensates. As a negative control (Ctrl) the non-treated cells were used. Data are shown as mean ± SD, three independent assays were analyzed. One-way ANOVA with Tukey post-test. Data have been compared by one-way ANOVA with Tukey test for multiple comparison. *P < 0.05, **P < 0.01, ***P < 0.001, ****P < 0.0001. (c) Suramin modulates Tau fibril formation in comparison to heparin. Representative transmission electron micrographs (TEM) of 36 h-old samples show full-length fibres (c1) for Tau:heparin condensates, versus broken Tau fibres (c3) for condensates incubated together with suramin and heparin, and no fibrils for (c2) Tau:suramin condensates or (c4) the suramin control. The concentrations used for Tau, heparin and suramin are 25 μM, 5 μM and 25 μM respectively. Scale bar corresponds to 1 μm. (d) ThioflavinT assay of TauΔK280 aggregation in the presence of heparin and suramin. TauΔK280 (10 μM) was mixed with heparin (2.5 μM) or suramin (10 μM), or heparin and suramin together (added at the same time) for 24 h in PBS with 1 mM DTT and ThioflavinT (50 μM). TauΔK280 without addition of heparin and PBS with heparin, suramin and ThioflavinT were used as negative controls. Data shown as mean ± SD, n = 3 technical replicates. (e) Schematic outine of Suramin modulating Tau seeding potential. Tau monomers form condensates with known inducers like heparin or RNA that results in the seeding potential of pathological Tau. Suramin forms Tau:suramin condensates but does not initiate the seeding potential of pathological Tau to develop fibrils. The scheme was drawn using Microsoft® PowerPoint® for Microsoft 365 MSO (Version 2211 Build 16.0.15831.20098) 64-bit.

References

    1. Sotiropoulos I, et al. Atypical, non-standard functions of the microtubule associated Tau protein. Acta Neuropathol. Commun. 2017;5:91. doi: 10.1186/s40478-017-0489-6. - DOI - PMC - PubMed
    1. Wang Y, Mandelkow E. Tau in physiology and pathology. Nat. Rev. Neurosci. 2016;17:5–21. doi: 10.1038/nrn.2015.1. - DOI - PubMed
    1. Rademakers R, Cruts M, van Broeckhoven C. The role of tau (MAPT) in frontotemporal dementia and related tauopathies. Hum. Mutat. 2004;24:277–295. doi: 10.1002/humu.20086. - DOI - PubMed
    1. Noble W, Hanger DP, Miller CC, Lovestone S. The importance of tau phosphorylation for neurodegenerative diseases. Front. Neurol. 2013;4:83. doi: 10.3389/fneur.2013.00083. - DOI - PMC - PubMed
    1. Goedert M, Jakes R, Spillantini MG, Hasegawa M, Smith MJ, Crowther RA. Assembly of microtubuleassociated protein tau into Alzheimer-like filaments induced by sulpahted glycosoaminoglycans. Nature. 1996;383:4. doi: 10.1038/383550a0. - DOI - PubMed

Publication types