. 2023 Mar 9;14(1):1305.
doi: 10.1038/s41467-023-36981-4.

Gut microbiota alters host bile acid metabolism to contribute to intrahepatic cholestasis of pregnancy

Affiliations

Gut microbiota alters host bile acid metabolism to contribute to intrahepatic cholestasis of pregnancy

Bo Tang et al. Nat Commun. .

Abstract

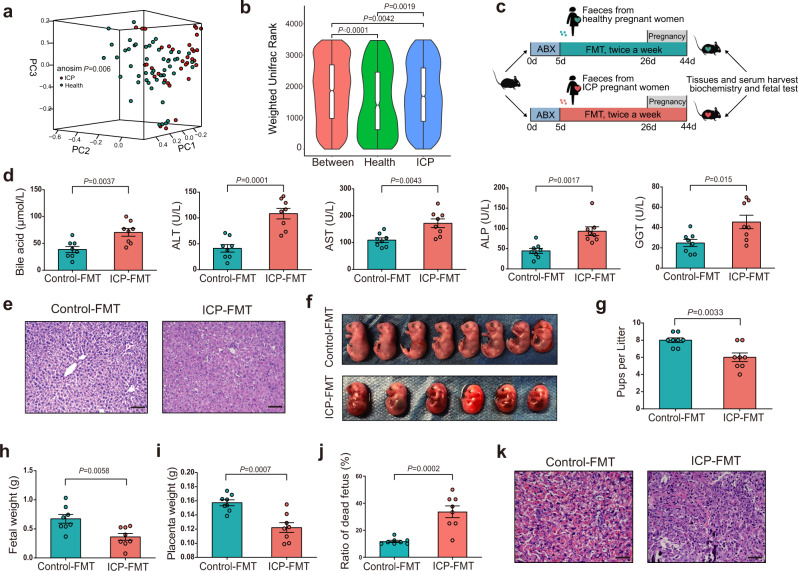
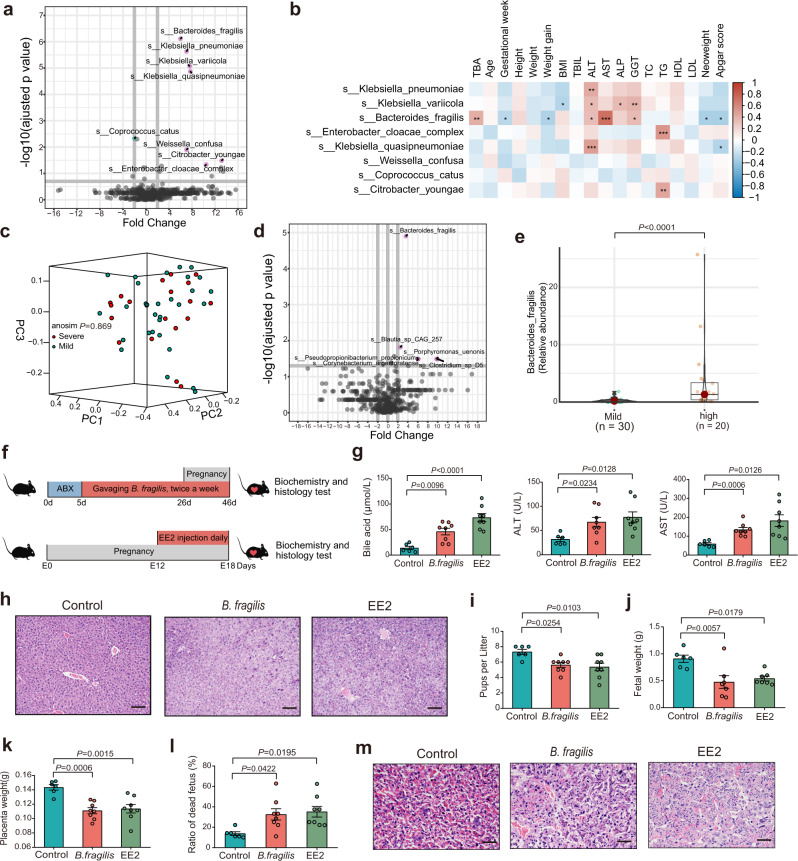
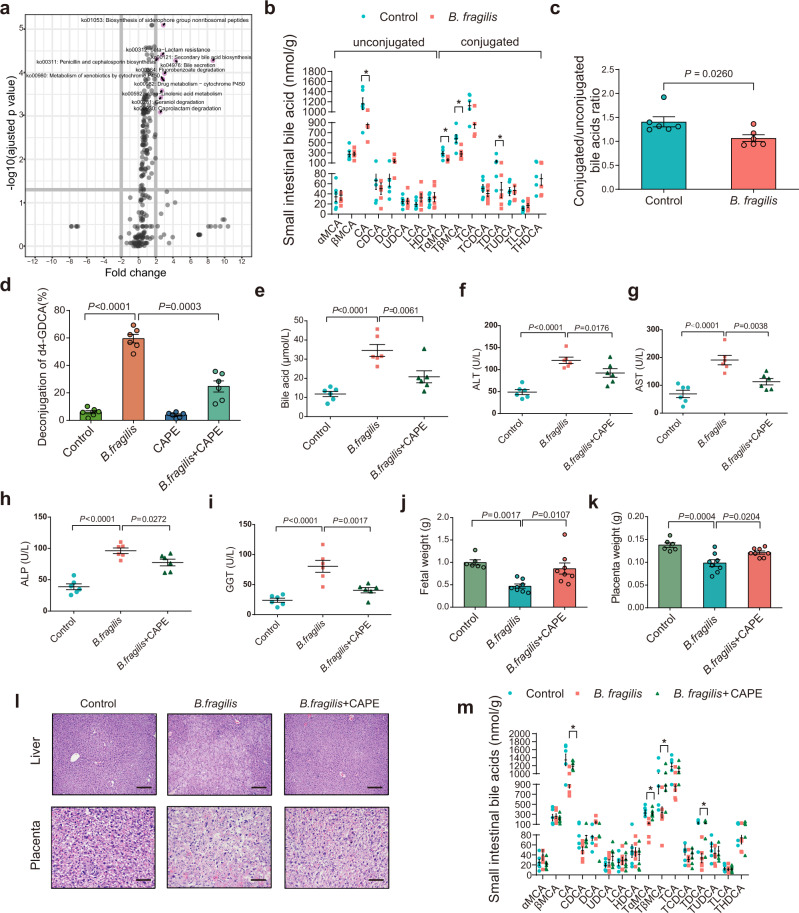
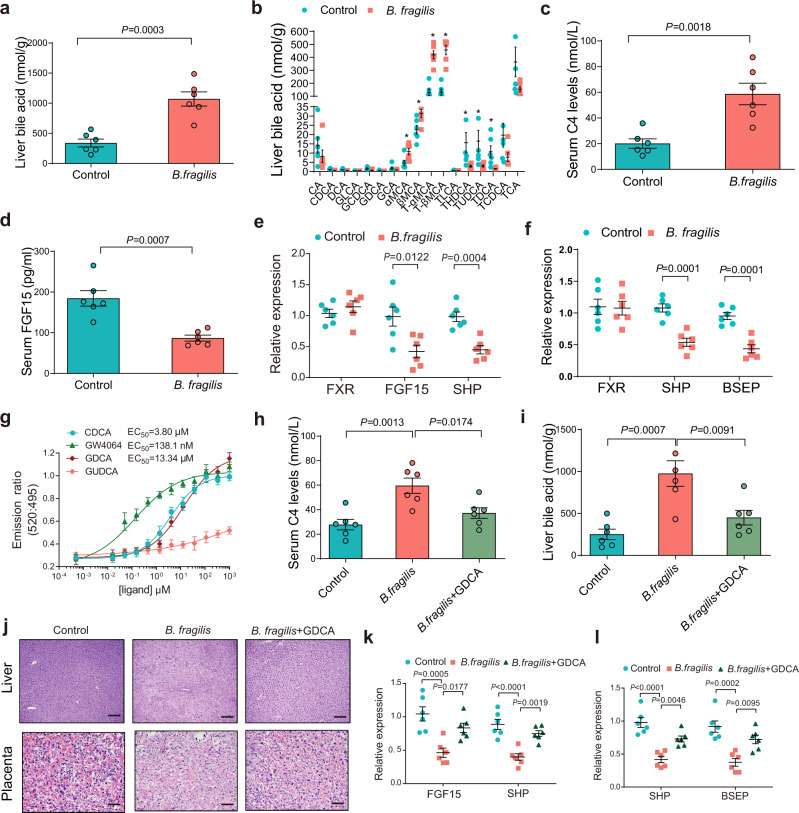
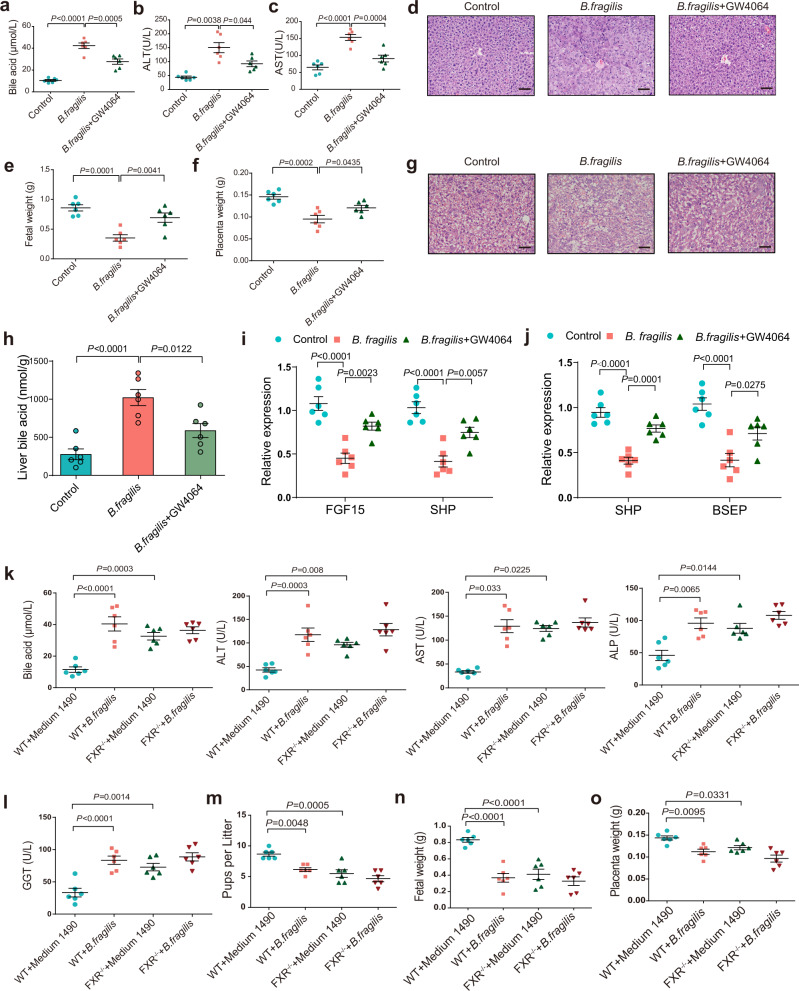
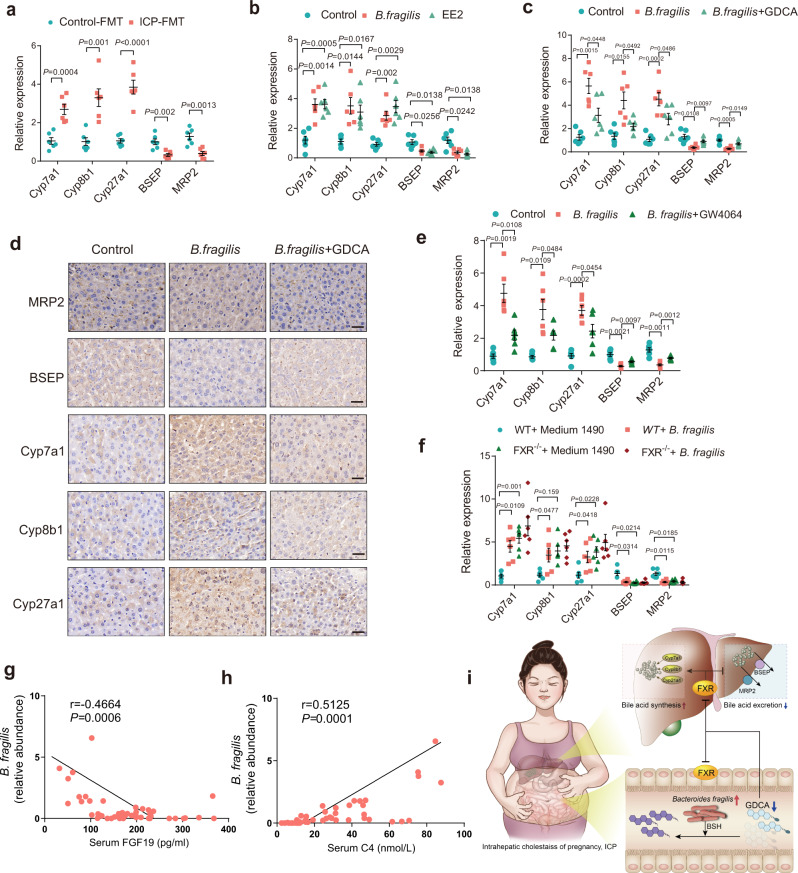
Intrahepatic cholestasis of pregnancy (ICP) is a female pregnancy-specific disorder that is characterized by increased serum bile acid and adverse fetal outcomes. The aetiology and mechanism of ICP are poorly understood; thus, existing therapies have been largely empiric. Here we show that the gut microbiome differed significantly between individuals with ICP and healthy pregnant women, and that colonization with gut microbiome from ICP patients was sufficient to induce cholestasis in mice. The gut microbiomes of ICP patients were primarily characterized by Bacteroides fragilis (B. fragilis), and B. fragilis was able to promote ICP by inhibiting FXR signaling via its BSH activity to modulate bile acid metabolism. B. fragilis-mediated FXR signaling inhibition was responsible for excessive bile acid synthesis and interrupted hepatic bile excretion to ultimately promote the initiation of ICP. We propose that modulation of the gut microbiota-bile acid-FXR axis may be of value for ICP treatment.


Conflict of interest statement

The authors declare no competing interests.

Figures

Fig. 1
Fig. 1. Gut microbiota from ICP patients is altered significantly and sufficient to promote ICP in mice.
a Weighted Unifrac PCoA (principal coordinate analysis) plot of individuals with ICP patients and healthy controls. The ANOSIM test was used to calculate the significance of dissimilarity (ANOSIM, P = 0.001). b A truncated violin plot shows the comparison of Weighted Unifrac range of samples between ICP patients and healthy controls. The notch in the middle of the box represents the median. The top and bottom of box represent the 75th and 25th quartiles, respectively. The upper and lower whiskers extended 1.5× the interquartile range from the upper edge and lower edge of the box represent maximum and minimum, respectively. With a truncated violin plot, the curve of the violin extends only to the minimum and maximum values in the data set. Outlier values were not shown in this plot. n = 50 individuals with ICP, n = 41 individuals in healthy controls. The ANOSIM test was used to calculate the significance of dissimilarity. The exact P values were shown. c Experimental schematic: following antibiotics treatment, the recipient mice were transplanted with fecal samples from ICP patients or healthy controls. Tissues and samples were collected at E18d. d Analysis of serum levels of total bile acids, ALT, AST, ALP, and GGT (n = 8 mice per group). Data are presented as mean ± SEM. P values were determined by two-tailed Student’s t-test. e Hematoxylin and eosin staining of representative livers. Scale bar: 100 μm. f, g Number of pups per litter (n = 8 mice per group). The representative fetuses are from the same litter with the same gestational age. hj Fetal weight (h), placenta weight (i) and ratio of dead fetus (j) in the two groups (n = 8 mice per group). P values were determined by two-tailed Student’s t-test for gj. k Placenta tissues were stained with H&E. Representative images were shown. Scale bar: 50 μm. Data are presented as mean ± SEM for gj. FMT fecal microbiota transplantation, ABX antibiotics cocktail, PC principal coordinate analysis, ANOSIM analysis of similarities. Source data are provided as a Source Data file.
Fig. 2
Fig. 2. B. fragilis induced intrahepatic cholestasis of pregnancy in mice.
a Differentially enriched bacteria between ICP patients and healthy controls. Pink dots represent bacteria with higher abundance in samples of ICP patients. Blue dots represent bacteria with higher abundance in samples of healthy controls. Grey dots represent bacteria with no significant difference between the two groups. P values were adjusted by Benjamini & Hochberg (BH) method to control FDR. FDR-adjusted P < 0.05 was shown. b Correlation heatmap of differentially enriched bacteria with the clinical characteristics. Pearson correlation analysis with FDR-adjusted P value. *P < 0.05; **P < 0.01; ***P < 0.001. c Weighted Unifrac PCoA plot of samples between the severe and mild groups in ICP patients. The ANOSIM test was used to calculate the significance of dissimilarity (ANOSIM, P = 0.869). d Differentially enriched bacteria between the severe and mild groups in ICP patients. Pink dots represent bacteria with relatively higher abundance in severe ICP patients. Grey dots represent bacteria with no significant difference between the two groups. P values were adjusted by Benjamini & Hochberg (BH) method to control FDR. FDR-adjusted P < 0.05 was shown. e The comparison of B. fragilis abundance between the two groups. The horizontal bar within box represents median. The top and bottom of box represent 75th and 25th quartiles, respectively. The upper and lower whiskers extended 1.5× the interquartile range from the upper edge and lower edge of the box represent maximum and minimum, respectively. P value was determined by two-tailed Mann–Whitney test. f Experimental schematic for gavaging B. fragilis. g Analysis of serum levels of total bile acids, ALT and AST in each group. Data are presented as mean ± SEM. P values were determined by ordinary one-way ANOVA with Tukey’s correction or Welch ANOVA with Games-Howell’s multiple comparisons test. n = 6 mice in control group, n = 8 mice in B. fragilis and EE2 group. h Representative images of H&E staining of livers in each group. Scale bar: 100 μm. il Number of pups per litter (i) in each group. n = 6 in control group, n = 8 in B. fragilis and EE2 group. Number of fetal weight (j) in each group. n = 6 in control group, n = 7 in B. fragilis and EE2 group. Number of placenta weight (k) and ratio of dead fetus (l) in each group. n = 6 in control group, n = 8 in B. fragilis and EE2 group. Data are presented as mean ± SEM for il. P values were determined by ordinary one-way ANOVA with Tukey’s correction for il. m Representative images of H&E staining of placenta in each group. Scale bar: 50 μm. ANOSIM analysis of similarities, EE2 17α-ethynylestradiol; Source data are provided as a Source Data file.
Fig. 3
Fig. 3. B. fragilis promotes the ICP through its BSH activity mediating bile acid metabolism.
a Kyoto Encyclopedia of Genes and Genomes (KEGG) annotation of key altered metabolic pathways in individuals with ICP. P values were adjusted by Benjamini & Hochberg (BH) method to control FDR. FDR-adjusted P < 0.05 was shown. b Levels of small intestinal bile acids in B. fragilis transplanted mice or control group (n = 6 mice per group). P values were determined by two-tailed Student’s t-test. *P < 0.05. c Conjugated and unconjugated bile acids in B. fragilis transplanted mice or control group. n = 6 per group. P values were determined by two-sided Mann–Whitney test. d Hydrolysis efficiency of GDCA by B. fragilis with or without CAPE in vitro. P values were determined by Welch ANOVA with Games-Howell’s multiple comparisons test. n = 6 per group. ei Mice were divided into three groups (control, B. fragilis and B. fragilis + CAPE). Analysis of serum levels of total bile acids (e), ALT (f), AST (g), ALP (h) and GGT (i) in each group. n = 6 per group. P values were determined by ordinary one-way ANOVA with Tukey’s correction. Fetal weight (j) and placenta weight (k) in each group (n = 6 in control group; n = 8 in B. fragilis group and B. fragilis + CAPE group). P values were determined by ordinary one-way ANOVA with Tukey’s correction. l Representative images of H&E staining of livers and placenta in each group. Scale bar = 100 μm for liver; scale bar = 50 μm for placenta. m Levels of small intestinal bile acids in indicated groups (n = 6 per group). P value was determined by one-way ANOVA with Tukey’s correction. *P < 0.05. Data are presented as mean ± SEM for bk, m. CAPE caffeic acid phenethyl ester. Source data are provided as a Source Data file.
Fig. 4
Fig. 4. B. fragilis suppressed FXR signaling through mediating bile acid metabolism to increase hepatic bile acids accumulation.
a Liver total bile acid levels in B. fragilis transplanted mice or control group (n = 6 per group). b Hepatic bile acids profiles in B. fragilis transplanted mice or control group (n = 6 per group). P values were determined by two-tailed Student’s t-test for a, b. *P < 0.05. c, d Serum C4 levels (c) and FGF15 levels (d) in B. fragilis transplanted mice or control group (n = 6 per group). P values were determined by two-tailed Student’s t-test. e, f Relative expression of intestinal (e) and hepatic (f) FXR mRNA and its target genes in mice colonized with B. fragilis or control (n = 6 per group). P values were determined by two-tailed Student’s t-test. g TR-FRET FXR coactivator recruitment assay to assess the action of GDCA on FXR; CDCA and GW4064 was used as positive control. GUDCA was used as negative control (n = 3 per group). h Serum C4 levels in each group (n = 6 per group). i Liver total bile acid levels in each group (n = 6 per group). P values were determined by one-way ANOVA with Tukey’s correction for hj Representative images of H&E staining of livers and placenta in each group. Scale bar = 100 μm for liver; scale bar = 50 μm for placenta. k, l Relative expression of intestinal FXR target genes (k) and hepatic FXR target genes (l) in indicated groups. n = 6 per group. P values were determined by one-way ANOVA with Tukey’s correction. Data are presented as mean ± SEM for ai, k, l. Source data are provided as a Source Data file.
Fig. 5
Fig. 5. FXR signaling is required for B. fragilis-induced ICP in mice.
ac Analysis of serum levels of total bile acids (a), ALT (b) and AST (c) in each group (n = 6 per group). P values were determined by one-way ANOVA with Tukey’s correction or Welch ANOVA with Games-Howell’s multiple comparisons test. d Representative images of H&E staining of liver in each group. Scale bar: 50 μm. e, f Fetal weight (e) and placenta weight (f) in each group (n = 6 per group). P values were determined by one-way ANOVA with Tukey’s correction. g Representative images of H&E staining of placenta in each group. Scale bar: 50 μm. h Liver total bile acid levels in each group (n = 6 per group). i, j Relative expression of intestinal FXR target genes (i) and hepatic FXR target genes (j) in indicated groups. n = 6 per group. P values were determined by one-way ANOVA with Tukey’s correction. k, l Serum levels of total bile acids, ALT, AST, ALP, GGT in each group (n = 6 per group). mo Number of pups per litter (m), fetal weight (n), and placenta weight (o) in each group (n = 6 per group). P values were determined by one-way ANOVA with Tukey’s correction or Welch ANOVA with Games-Howell’s multiple comparisons test or Kruskal-Wallis with Dunn’s multiple comparisons test depending on the sample distribution type for h-o. Data are presented as mean ± SEM for ac, e, f, ho. Source data are provided as a Source Data file.
Fig. 6
Fig. 6. B. fragilis induces excessive bile acid synthesis and inhibits hepatic bile acid excretion through suppression of FXR signaling to promote ICP.
a Hepatic mRNA expression levels of bile acids synthetic and bile excretory genes in mice transplanted with fecal microbiota of ICP and healthy controls (n = 6 per group). P values were determined by two-tailed Student’s t-test. b Hepatic mRNA expression levels of bile acids synthetic and bile excretory genes in control group, B. fragilis group and EE2 group (n = 6 per group). c Hepatic mRNA expression levels of bile acids synthetic and bile excretory genes in each group (n = 6 per group). P values were determined by Welch ANOVA with Games-Howell’s multiple comparisons test for b, c. d IHC staining of hepatic bile acids synthetic and bile excretory proteins of mice colonized with B. fragilis together with GDCA or not. Scale bar: 20 μm. e Hepatic mRNA expression levels of bile acids synthetic and bile excretory genes in mice colonized with B. fragilis together with GW4064 (10 mg/kg/d) or not (n = 6 per group). f Hepatic mRNA expression levels of bile acids synthetic and bile excretory genes in WT mice or FXR−/− mice colonized with B. fragilis or not (n = 6 per group). P values were determined by Welch ANOVA with Games-Howell’s multiple comparisons test for e, f. g, h Correlations between B. fragilis abundance and FGF19 (g) or C4 (h) were determined by Spearman’s rank test. i Schematic mechanisms underlying the role of the B. fragilis-bile acid-FXR axis in regulating ICP. Data are presented as mean ± SEM for a-c, e, f. Source data are provided as a Source Data file.

References

    1. Ibrahim SH, et al. Liver diseases in the perinatal period: interactions between mother and infant. Hepatology. 2020;71:1474–1485. doi: 10.1002/hep.31109. - DOI - PMC - PubMed
    1. Puljic A, et al. The risk of infant and fetal death by each additional week of expectant management in intrahepatic cholestasis of pregnancy by gestational age. Am. J. Obstet. Gynecol. 2015;212:667.e661–665. - PubMed
    1. Monrose E, et al. Burden of future liver abnormalities in patients with intrahepatic cholestasis of pregnancy. Am. J. Gastroenterol. 2021;116:568–575. doi: 10.14309/ajg.0000000000001132. - DOI - PMC - PubMed
    1. Chappell LC, et al. Ursodeoxycholic acid versus placebo, and early term delivery versus expectant management, in women with intrahepatic cholestasis of pregnancy: semifactorial randomised clinical trial. BMJ. 2012;344:e3799. doi: 10.1136/bmj.e3799. - DOI - PMC - PubMed
    1. Vasavan T, et al. Fetal cardiac dysfunction in intrahepatic cholestasis of pregnancy is associated with elevated serum bile acid concentrations. J. Hepatol. 2021;74:1087–1096. doi: 10.1016/j.jhep.2020.11.038. - DOI - PMC - PubMed

Publication types

Substances

Supplementary concepts