. 2023 Mar 9;13(1):3974.
doi: 10.1038/s41598-023-30764-z.

Determining the most accurate 16S rRNA hypervariable region for taxonomic identification from respiratory samples

Affiliations

Determining the most accurate 16S rRNA hypervariable region for taxonomic identification from respiratory samples

Ruben López-Aladid et al. Sci Rep. .

Abstract

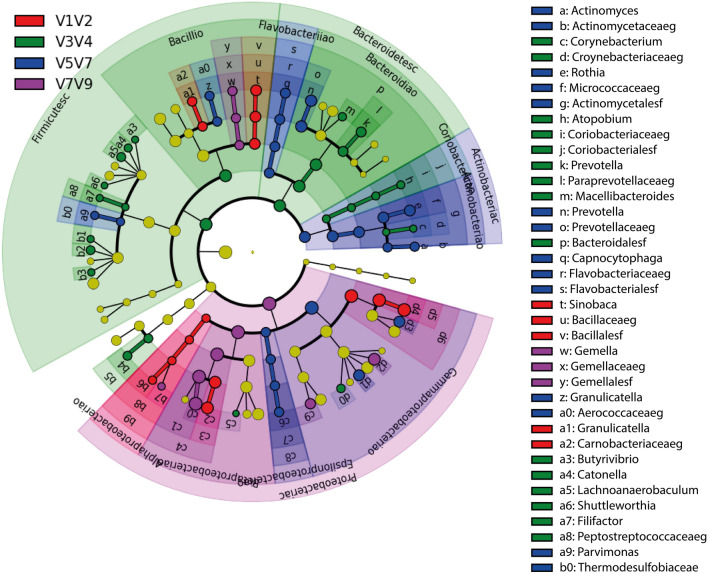
16S rRNA gene profiling, which contains nine hypervariable regions (V1-V9), is the gold standard for identifying taxonomic units by high-throughput sequencing. Microbiome studies combine two or more region sequences (usually V3-V4) to increase the resolving power for identifying bacterial taxa. We compare the resolving powers of V1-V2, V3-V4, V5-V7, and V7-V9 to improve microbiome analyses in sputum samples from patients with chronic respiratory diseases. DNA were isolated from 33 human sputum samples, and libraries were created using a QIASeq screening panel intended for Illumina platforms (16S/ITS; Qiagen Hilden, Germany). The analysis included a mock community as a microbial standard control (ZymoBIOMICS). We used the Deblur algorithm to identify bacterial amplicon sequence variants (ASVs) at the genus level. Alpha diversity was significantly higher for V1-V2, V3-V4, and V5-V7 compared with V7-V9, and significant compositional dissimilarities in the V1-V2 and V7-V9 analyses versus the V3-V4 and V5-V7 analyses. A cladogram confirmed these compositional differences, with the latter two being very similar in composition. The combined hypervariable regions showed significant differences when discriminating between the relative abundances of bacterial genera. The area under the curve revealed that V1-V2 had the highest resolving power for accurately identifying respiratory bacterial taxa from sputum samples. Our study confirms that 16S rRNA hypervariable regions provide significant differences for taxonomic identification in sputum. Comparing the taxa of microbial community standard control with the taxa samples, V1-V2 combination exhibits the most sensitivity and specificity. Thus, while third generation full-length 16S rRNA sequencing platforms become more available, the V1-V2 hypervariable regions can be used for taxonomic identification in sputum.


Conflict of interest statement

A.Torres has received grants from MedImmune, Cubist, Bayer, Theravance, and Polyphor, together with personal fees as an advisory board member for Bayer, Roche, The Medicines Company, and Curetis. He has received bureau fees for keynote speaker presentations from GSK, Pfizer, AstraZeneca, and the Biotest Advisory Board. These bodies had no connection to the current study. The rest of the authors (RLA, LFB, VAS, LB, NV, RPI, AP and PO) declare no competing interest.

Figures

Figure 1
Figure 1
Hypervariable region strategy on 16S rRNA. A summary of the four hypervariable region strategies for amplification of variable regions V1–V2, V3–V4, V5–V7, and V7–V9 in the 16S rRNA gene (positioning is based on the E.coli 16S rRNA gene).
Figure 2
Figure 2
Amplicon sequence variants according to the different hypervariable regions of the 16S rRNA gene. Samples are grouped and averaged by hypervariable region, with taxonomic composition shown at the genus level. Each column represents a hypervariable region and each color represents the percentage of the total sample contributed by each taxonomy.
Figure 3
Figure 3
ROC curves for the hypervariable region validated with a mock community microbial standard control. The cross-validation accuracy of the microbiota classifier is depicted by the ROC curve for the bacterial genera obtained: (A) AUC for V1–V2 = 0.736 (0.566–0.906); (B) AUC for V3–V4 = 0.474 (0.150–0.798); (C) AUC for V5–V7 = 0.462 (0.229–0.695); and (D) AUC for V7–V9 = 0.581 (0.297–0.865). As shown, a strong association existed between a specific microbiome genus composition and the V1–V2 hypervariable region. AUC area under the curve, ROC, receiver operating characteristic.
Figure 4
Figure 4
Alpha diversity in sputum samples compared with different combined hypervariable regions in 16S rRNA. Alpha diversity, measured by the Chao1 (Fig. 3A), inverse Simpson (Fig. 3B), and Shannon(Fig. 3C) diversity indices, is plotted for the hypervariable regions V1–V2 (red), V3–V4 (blue), V5–V7 (green), and V7–V9 (purple). The line inside the boxplot represents the median, with the lowest and highest values within the 1.5 interquartile range represented by the whiskers. All diversity indices were significantly decreased in V7–V9: pShannon = 4.6 E-07, pinvSimpson = 1 E-07, and pChao1 = 7.1 E-06.
Figure 5
Figure 5
NMDS ordination of the Bray–Curtis dissimilarity index for different combined hypervariable regions in 16S rRNA. The groups identified by different combined regions present compositional differences. Each sample is represented by a dot: green for V5–V7; blue for V3–V4; red for V1–V2; and purple for V7–V9. Sample proximity indicates similarity (closer = more similar). NMDS Non-metric multidimensional scaling.
Figure 6
Figure 6
LEfSe for differentially abundant combined regions among sputum samples. LDA finds taxa that are significantly more abundant per group. Bars represent the most abundant bacterial taxa at the genus level in sputum samples from patients with bronchiectasis: V1–V2 (red), V3–V4 (green), V5–V7 (blue), and V7–V9 (purple). The bar size (X axis) from LEfSe represents the effect size of the differential abundance of taxa for the each region (statistical significance if > 2 log). LDA linear discriminant analysis, LEfSe linear discriminant analysis effect size.
Figure 7
Figure 7
Cladogram of the LEfSe results for the different combined regions in 16S rRNA. The cladogram shows the microbial species with significant differences in the LDA score between the analyzed groups. Colors indicate the taxa identified by the different combined regions: V1–V2 (red), V3–V4 (green), V5–V7 (blue), and V7–V9 (purple). Species classification at the class, order, family, and genus levels is shown from the inside to the outside. Yellow nodes represent species with no significant difference, indicating the cladograms that overlapped between hypervariable regions.. At the end of each taxa names, the taxonomic level appears in the LEFSE output, where “o” represents the order taxonomic level, “c” the class level, “f” the family level, “p” the phylum level and “s” the of kind. LDA linear discriminant analysis, LEfSe linear discriminant analysis effect size.

References

    1. Dickson RP, Schultz MJ, Van Der PT, Schouten LR, Falkowski NR, Luth JE, et al. Lung microbiota predict clinical outcomes in critically Ill patients. Am. J. Respir. Crit. Care Med. 2020;201(5):555–563. doi: 10.1164/rccm.201907-1487OC. - DOI - PMC - PubMed
    1. Fernández-Barat L, López-Aladid R, Torres A. Reconsidering ventilator-associated pneumonia from a new dimension of the lung microbiome. EBioMedicine. 2020;60:102995. doi: 10.1016/j.ebiom.2020.102995. - DOI - PMC - PubMed
    1. Cai L, Ye L, Tong AH, Lok S, Zhang T. Biased diversity metrics revealed by bacterial 16S pyrotags derived from different primer sets. PLoS ONE. 2013;8(1):e53649. doi: 10.1371/journal.pone.0053649. - DOI - PMC - PubMed
    1. Amati F, Simonetta E, Gramegna A, Tarsia P, Contarini M, Blasi F, Aliberti S. The biology of pulmonary exacerbations in bronchiectasis. Eur. Respir. Rev. 2019;28(154):190055. doi: 10.1183/16000617.0055-2019. - DOI - PMC - PubMed
    1. Alcaraz-serrano V, Fernández-barat L, Scioscia G, Llorens-llacuna J, Gimeno-santos E, Herrero-cortina B, et al. Mucoid pseudomonas aeruginosa alters sputum viscoelasticity in patients with non-cystic fibrosis bronchiectasis. Respir. Med. 2019;154:40–46. doi: 10.1016/j.rmed.2019.06.012. - DOI - PubMed

Publication types

Substances