. 2023 Apr;8(4):651-665.
doi: 10.1038/s41564-023-01342-w. Epub 2023 Mar 9.

A hydrogenotrophic Sulfurimonas is globally abundant in deep-sea oxygen-saturated hydrothermal plumes

Affiliations

A hydrogenotrophic Sulfurimonas is globally abundant in deep-sea oxygen-saturated hydrothermal plumes

Massimiliano Molari et al. Nat Microbiol. 2023 Apr.

Abstract

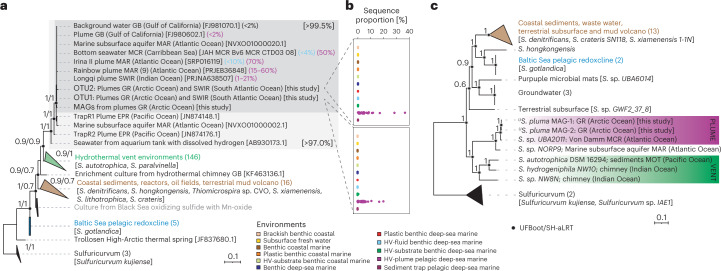
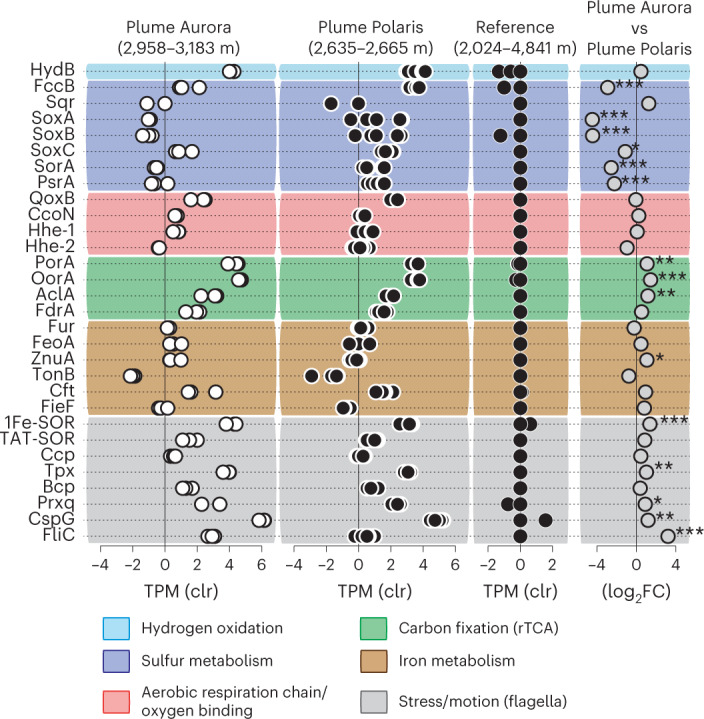
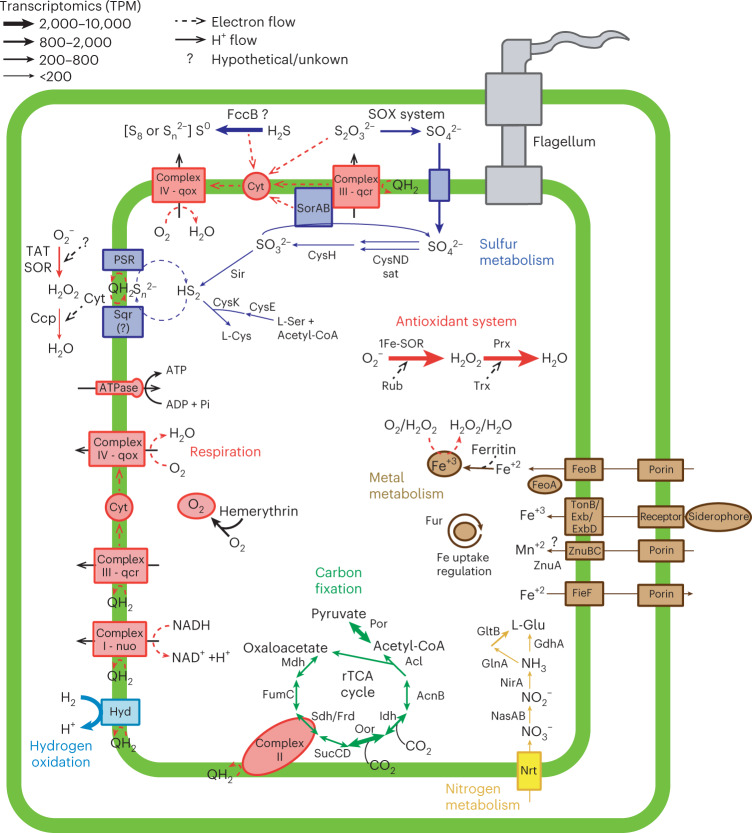
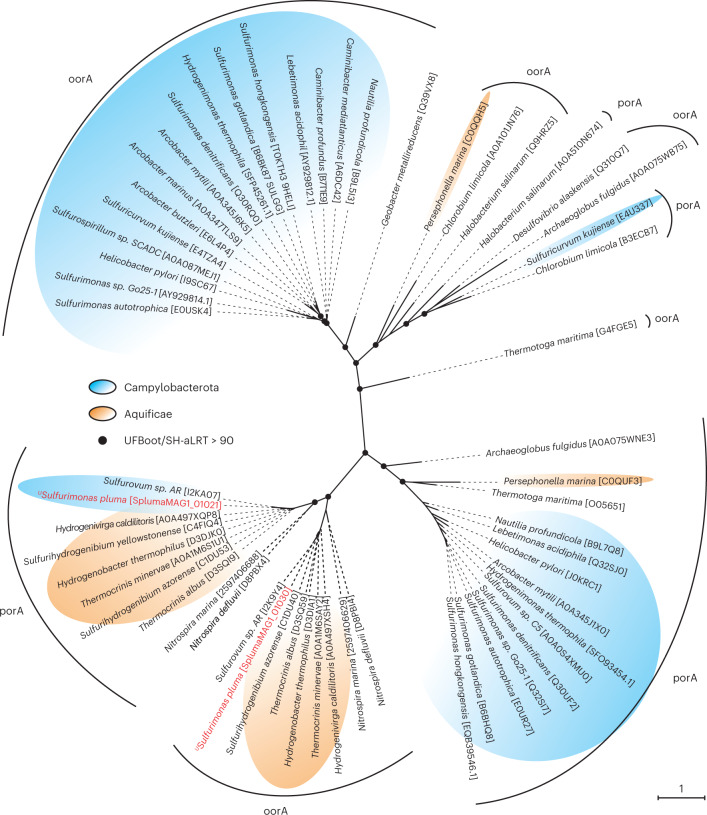
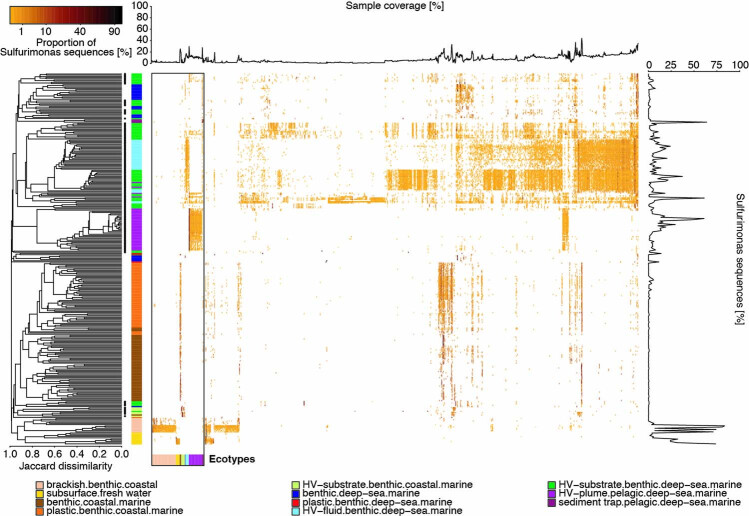
Members of the bacterial genus Sulfurimonas (phylum Campylobacterota) dominate microbial communities in marine redoxclines and are important for sulfur and nitrogen cycling. Here we used metagenomics and metabolic analyses to characterize a Sulfurimonas from the Gakkel Ridge in the Central Arctic Ocean and Southwest Indian Ridge, showing that this species is ubiquitous in non-buoyant hydrothermal plumes at Mid Ocean Ridges across the global ocean. One Sulfurimonas species, USulfurimonas pluma, was found to be globally abundant and active in cold (<0-4 °C), oxygen-saturated and hydrogen-rich hydrothermal plumes. Compared with other Sulfurimonas species, US. pluma has a reduced genome (>17%) and genomic signatures of an aerobic chemolithotrophic metabolism using hydrogen as an energy source, including acquisition of A2-type oxidase and loss of nitrate and nitrite reductases. The dominance and unique niche of US. pluma in hydrothermal plumes suggest an unappreciated biogeochemical role for Sulfurimonas in the deep ocean.


Conflict of interest statement

The authors declare no competing interests.

Figures

Fig. 1
Fig. 1. Phylogeny and environmental distribution of hydrothermal plume Sulfurimonas sp.
a, Rooted phylogenetic tree of 16S rRNA gene sequences of Sulfurimonas species (S.) and closest relatives, including isolates and environmental sequences, with Sulfuricurvum as outgroup. The integer numbers and the percentage in parentheses indicate the number of sequences in a given branch and the contribution of Sulfurimonas sequences to the total number of sequences in Illumina amplicon sequencing datasets, respectively. In square brackets, the percentage of 16S rRNA gene identity is reported for the plume Sulfurimonas cluster. b, The two plots show the contribution of the hydrothermal plume Sulfurimonas ecotypes (see Extended Data Fig. 3 for details) to the total number of sequences. c, Rooted outgroup phylogenetic tree based on concatenated SCG = 258 of Sulfurimonas and Sulfuricurvum using partition substitution models. Hydrothermal vent (HV) environments include: chimney, sediments, fluids and animal body/nest. The scale bar represents the expected number of changes per nucleotide position. UFBoot and SH-aLRT values are based on 1,000 replicates. Best substitution model for 16S rRNA gene tree: TVMe+I + G4. GB: Guaymas Basin; MAR: Mid Atlantic Ridge; MCR: Mid Cayman Rise; GR: Gakkel Ridge; SWIR: Southwest Indian Ridge; EPR: East Pacific Rise.
Fig. 2
Fig. 2. Transcriptome of US. pluma.
The expression of marker genes for the main metabolic pathways of Sulfurimonas sp. from Gakkel Ridge plumes (Aurora and Polaris) and reference seawater. The gene expression is centred log-ratio transformed (clr). Differential expression of genes between the plumes of Aurora (n = 3) and Polaris (n = 6) is reported as log2-fold-change (log2FC). The pairwise statistical test is based on quantile-adjusted conditional maximum-likelihood (qCML) method and the likely value was adjusted by applying FDR. *Padjust < 0.05; **Padjust < 0.01; ***Padjust < 0.001. hydB: (NiFe)-hydrogenase Group 1b, large subunit; fccB: flavocytochrome c sulfide dehydrogenase; sqr: sulfide:quinone reductase; soxA, soxB, soxC: sulfur oxidation proteins; sorA: sulfite dehydrogenase; psrA: polysulfide reductase, subunit I; qoxB: cytochrome c oxidase, caa3-type, subunit I; ccoN: cytochrome c oxidase, cbb3-type, subunit I; hhe-1 and hhe-2: bacteriohemerythrins; porA: pyruvate:ferredoxin oxireductase, subunit I; oorA: oxoglutarate:ferredoxin oxireductase, subunit I; aclA: ATP-dependent citrate lyase, subunit I; fdrA: fumarate reductase, subunit I; fur: iron uptake regulation; feoA: Fe2+ uptake; znuA: Mn2+/Zn2+ uptake; tonB: siderophore transport; cft: ferritin; 1Fe-SOR and TAT-SOR: superoxide reductases; ccp: cytochrome c peroxidase; tpx, bcp and prxq: peroxiredoxins; cspG: cold shock-like protein; fliC: flagellin; rTCA: reductive tricarboxylic acid cycle. Source data
Fig. 3
Fig. 3. Metabolic map of US. pluma.
Metabolic scheme and gene transcription levels of genes involved in aerobic chemolithoautotrophy of US. pluma MAG-1. The average gene expression of Aurora and Polaris plumes is reported as TPM. For enzymes with multiple subunits, the transcription of the catalytic subunit is reported. Steps with more than one arrow indicate that several operons encoding different enzymes catalysing that reaction are present in the genome. Source data
Fig. 4
Fig. 4. Phylogenetic tree of rTCA cycle ferredoxin oxidoreductases.
Phylogenetic relationships between the alpha subunit of 2-oxoglutarate:ferredoxin oxidoreductase (oorA) and the alpha subunit of pyruvate:ferredoxin oxidoreductase (porA). The text in red shows oorA and porA genes of US. pluma. The scale bar represents the expected number of changes per amino acid position. UFBoot and SH-aLRT values are based on 1,000 replicates. Best substitution model: LG + R4.
Extended Data Fig. 1
Extended Data Fig. 1. Abundance of Campylobacterota and hydrothermal plume Sulfurimonas sp. cells at Arctic sites.
a, Proportion of Campylobacterota and hydrothermal plume Sulfurimonas sp. to DAPI-stained cell counts in different water types at Aurora vent and reference sites (water depth and number of samples are reported in parenthesis); b − g, fluorescence micrographs of microbes in the Aurora plume (station PS86-55) stained with DAPI (blue; b and e) and simultaneously (double CARD-FISH) with specific probes for Campylobacterota (green; c and f) and for Arctic Sulfurimonas OTU1 (red; d) and OTU2 (red; g). Panels b–g represents observations made from independent samples (n = 3). Scale bars 10 μm (b–g). Source data
Extended Data Fig. 2
Extended Data Fig. 2. Active bacterial community structure at Aurora and Polaris water types.
Dominant active bacterial taxa (cut-off ≥1.5 %) as detected by 16 S rRNA sequencing (cDNA). Average of sequences proportion is reported. The most dominant and active chemolithotrophs are in bold. Number of observations (n) is reported in parentheses. Source data
Extended Data Fig. 3
Extended Data Fig. 3. Heatmap of the distribution of Sulfurimonas oligotypes across samples.
Samples are ordered based on average linkage clustering of Jaccard dissimilarities (left panel). Asterisks indicate samples of hydrothermal origin. Top panel: percentage of samples an oligotype occurs in (sample coverage). Right panel: percentage of Sulfurimonas sequences of total sequences per sample. Bottom panel: Ecotypes per environmental category (brackish pelagic and benthic, as well as pelagic deep-sea and hydrothermal plume were pooled). Source data
Extended Data Fig. 4
Extended Data Fig. 4. Pangenomic analyses of hydrothermal plume USulfurimonas pluma.
Pangenome analysis of Sulfurimonas isolate genomes and MAGs from different environments. Starting from the centre, the first 13 circles show the occurrence of gene clusters in a given Sulfurimonas genome. The external circle reports the gene clusters in which at least one gene was functionally annotated to COGs. The 7569 gene clusters (GCs) are organized based on their distribution across the genomes. The genomes are organized based on gene clusters they share (using Euclidian distance and Ward clustering). The barplots show some general features of each genome, the heatmap shows the ANI between genomes. b, Metapangenome analysis of Sulfurimonas isolate genomes (S. denitrificans, S. hongkongebsis, S. gotlantica, S. autotrophica) and hydrothermal plume US. pluma. Starting from the centre: the first 5 circles show the occurrence of gene clusters in a given Sulfurimonas genomes; then the following 8 circles report the expression of gene clusters of US. pluma in hydrothermal plume, seawater and fluid as inferred from metatransciptomic (MT) read recruitment (only representatives for available ridge systems are reported); finally, the external circles report the gene clusters in which at least one gene was functionally annotated (green and grey for known and unknown functions, respectively). The 4854 gene clusters (GCs) and the genomes are organized based on their distribution across the genomes and on gene clusters they share (using Euclidian distance and Ward clustering), respectively. The barplot shows the percentage of genes expressed, the heatmap shows the percentage of Sulfurimonas reads recruited by five genomes (inner circle) from metagenomes (MG; average value is reported for habitats having more than one metagenome available per ridge system; the number of metagenomes is reported in parenthesis). In both panels the dendrograms represents the hierarchical clustering of genomes based on the occurrence of gene clusters.
Extended Data Fig. 5
Extended Data Fig. 5. Samples’ location for oligotyping.
World map showing the geographic origin, and environment of the samples used for the analysis of Sulfurimonas oligotypes. The point size is proportional to the number of samples collected at each location. HV: hydrothermal vent.
Extended Data Fig. 6
Extended Data Fig. 6. Synteny analysis of operon encoding the OOR and POR enzymes.
Gene cluster organization of the five subunits of 2-oxaglutarate-ferrodoxin oxidoreductase and pyruvate-ferrodoxin oxidoreductase in the genomes of USulfurimonas pluma, Sulfurovum AR, and Aquificales’ representatives.
Extended Data Fig. 7
Extended Data Fig. 7. Phylogenetic tree of sulfide oxidizing enzymes.
Phylogenetic relationships between the beta subunit of Flavocytochrome c sulfide dehydrogenase (FCC) and Sulfide:quinone oxidoreductase (SQR). The scale bar represents the expected number of changes per amino acids position. UFBoot and SH-aLRT values are based on 1000 replicates. Best substitution model: LG + R4. Sulfurimonas species are in bold.

References

    1. Inagaki F, Takai K, Kobayashi H, Nealson KH, Horikoshi K. Sulfurimonas autotrophica gen. nov., sp. nov., a novel sulfur-oxidizing e-proteobacterium isolated from hydrothermal sediments in the Mid-Okinawa Trough. Int. J. Syst. Evol. Microbiol. 2003;53:1801–1805. doi: 10.1099/ijs.0.02682-0. - DOI - PubMed
    1. Timmer-Ten Hoor A. A new type of thiosulphate oxidizing, nitrate reducing microorganism: Thiomicrospira denitrificans sp. nov. Neth. J. Sea Res. 1975;9:344–350. doi: 10.1016/0077-7579(75)90008-3. - DOI
    1. Cai L, Shao M, Zhang T. Non-contiguous finished genome sequence and description of Sulfurimonas hongkongensis sp. nov., a strictly anaerobic denitrifying, hydrogen- and sulfur-oxidizing chemolithoautotroph isolated from marine sediment. Stand. Genom. Sci. 2014;9:1302–1310. doi: 10.4056/sigs.4948668. - DOI - PMC - PubMed
    1. Wang S, Jiang L, Liu X, Yang S, Shao Z. Sulfurimonas xiamenensis sp. nov. and Sulfurimonas lithotrophica sp. nov., hydrogen- and sulfur-oxidizing chemolithoautotrophs within the Epsilonproteobacteria isolated from coastal sediments, and an emended description of the genus Sulfurimonas. Int. J. Syst. Evol. Microbiol. 2020;70:2657–2663. doi: 10.1099/ijsem.0.004087. - DOI - PubMed
    1. Takai K, et al. Sulfurimonas paralvinellae sp. nov., a novel mesophilic, hydrogen- and sulfur-oxidizing chemolithoautotroph within the Epsilonproteobacteria isolated from a deep-sea hydrothermal vent polychaete nest, reclassification of Thiomicrospira denitrificans as Sulfurimonas denitrificans comb. nov. and emended description of the genus Sulfurimonas. Int. J. Syst. Evol. Microbiol. 2006;56:1725–1733. doi: 10.1099/ijs.0.64255-0. - DOI - PubMed

Publication types