. 2023 Apr;8(4):596-610.
doi: 10.1038/s41564-023-01336-8. Epub 2023 Mar 9.

Lignin deconstruction by anaerobic fungi

Affiliations

Lignin deconstruction by anaerobic fungi

Thomas S Lankiewicz et al. Nat Microbiol. 2023 Apr.

Abstract

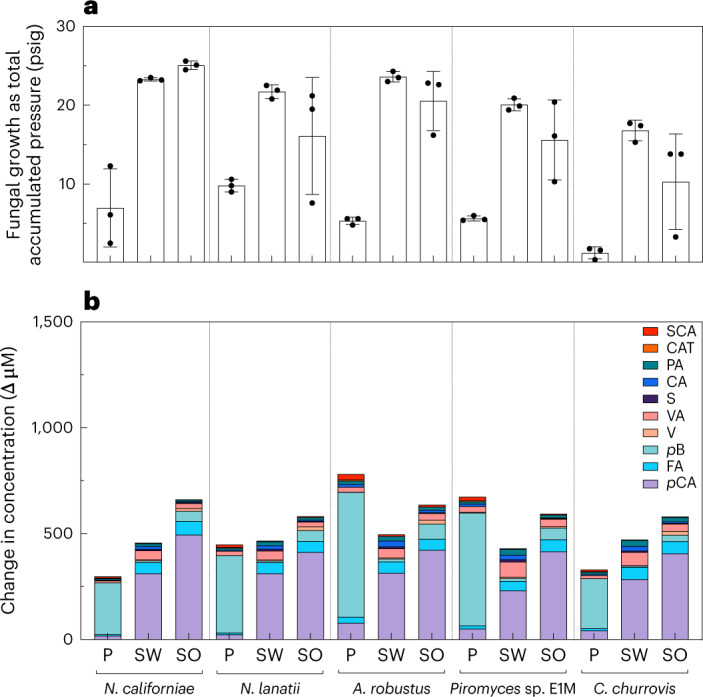
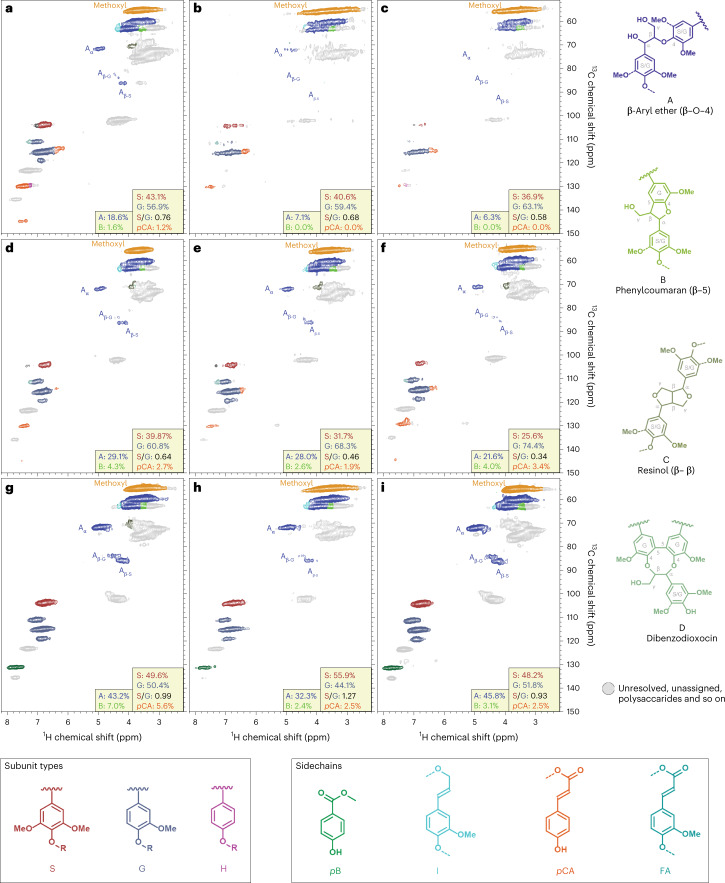
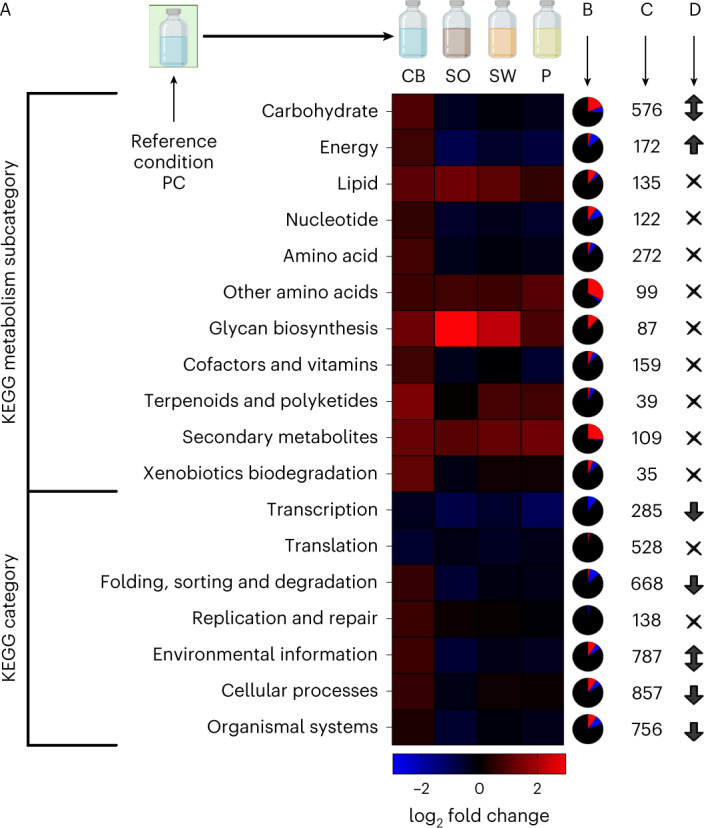
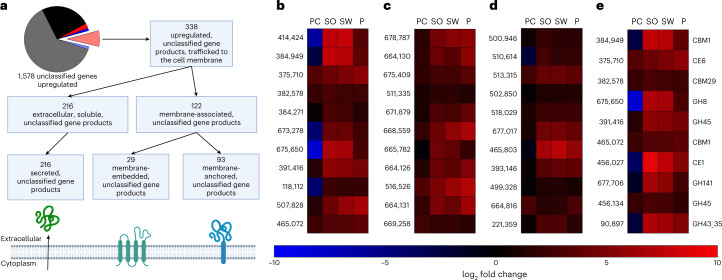
Lignocellulose forms plant cell walls, and its three constituent polymers, cellulose, hemicellulose and lignin, represent the largest renewable organic carbon pool in the terrestrial biosphere. Insights into biological lignocellulose deconstruction inform understandings of global carbon sequestration dynamics and provide inspiration for biotechnologies seeking to address the current climate crisis by producing renewable chemicals from plant biomass. Organisms in diverse environments disassemble lignocellulose, and carbohydrate degradation processes are well defined, but biological lignin deconstruction is described only in aerobic systems. It is currently unclear whether anaerobic lignin deconstruction is impossible because of biochemical constraints or, alternatively, has not yet been measured. We applied whole cell-wall nuclear magnetic resonance, gel-permeation chromatography and transcriptome sequencing to interrogate the apparent paradox that anaerobic fungi (Neocallimastigomycetes), well-documented lignocellulose degradation specialists, are unable to modify lignin. We find that Neocallimastigomycetes anaerobically break chemical bonds in grass and hardwood lignins, and we further associate upregulated gene products with the observed lignocellulose deconstruction. These findings alter perceptions of lignin deconstruction by anaerobes and provide opportunities to advance decarbonization biotechnologies that depend on depolymerizing lignocellulose.


Conflict of interest statement

The authors declare no competing interests.

Figures

Fig. 1
Fig. 1. Anaerobic fungus N. californiae grows on, deconstructs and metabolizes a variety of lignocelluloses as well as other carbohydrate substrates.
a, Fungal activity plotted as the pressure of fermentation gases accumulated by the fungus over time when grown on cellobiose (CB), purified cellulose (PC), switchgrass (SW), sorghum (SO) and poplar (P). b, The total change in metabolite concentrations, as measured by HPLC. c, The percentage of feedstock deconstructed after growth as measured by mass loss in the case of solid substrates and HPLC in the case of cellobiose. d, The change in percentage composition of each lignocellulose type. e, Monoaromatics present in fungal growth media at the end of fungal cultivation, as measured using LC-MS. FA, ferulic acid; S, syringic acid; CA, caffeic acid; SCA, salicylic acid. Panels be represent differences between inoculation and the final time point of a at 336 h. In all panels, error bars represent the standard deviation of biological replicates centred on the mean (n = 3).
Fig. 2
Fig. 2. Anaerobic gut fungi from four genera solubilize diverse aromatic monomers from lignocellulose.
Five strains of anaerobic gut fungi were grown on three different lignified substrates, and all released monoaromatic chemicals into the solution after growth. Lignocellulose types tested are poplar, switchgrass and sorghum. a, The total pressure accumulated over 10 days as a proxy for fungal growth. b, The mean difference between the concentration of various monoaromatics before and after fungal growth. Abbreviations for monoaromatic compounds are the same as in Fig. 1. CAT, catechol; V, vanillin. The vertical order of the legend matches the order of the stacked bars. As the growth medium is undefined, the values for uninoculated controls are subtracted from experimental values to calculate the values in b. The names of anaerobic fungi are as follows: N. californiae, N. lanatii, A. robustus, Piromyces sp. E1M and C. churrovis. The values shown in both panels are the means of biological replicates, and the error bars in a represent the standard deviations of these replicates (n = 3).
Fig. 3
Fig. 3. 2D-HSQC-NMR data show that anaerobic fungi deconstruct aromatic and aliphatic regions in various lignins and remove lignin pendent groups.
a, Sorghum uninoculated control. b, Sorghum after N. californiae growth. c, Sorghum after A. robustus growth. d, Switchgrass uninoculated control. e, Switchgrass after N. californiae growth. f, Switchgrass after A. robustus growth. g, Poplar uninoculated control. h, Poplar after N. californiae growth. i, Poplar after A. robustus growth. Inset values provide relative comparisons of the lignin components determined from contour volume integrals where S + G = 100% (right insets) or A + B = 100% (left insets). Lignin H units are below the detectable limit, as are resinol and dibenzodioxocin structures. The pCA and pB pendent ester fractions are calculated on a ‘core-lignin’ basis meaning the integral for the ester divided by S + G (pendent ester/S + G = %). Legends for monomeric lignin subunits, pendent esters and units with their characteristic inter-unit linkages are colour-coded to match their signals in the spectra.
Fig. 4
Fig. 4. Differential regulation of KEGG-categorized N. californiae genes in response to lignocellulose availability reveals fungal transcriptome dynamics associated with carbohydrate metabolism.
Lignocellulose or purified carbohydrate types: SO, SW and P. Genes were filtered for differential upregulation on SO, SW and P or differential downregulation on SO, SW and P as determined using DESeq2 with PC as the reference condition. Heat mapping in A represents the log2 fold change for transcripts in each KEGG category, calculated from all the gene length normalized (transcripts per million base pairs) values meeting statistical regulation criteria (q < 0.05). Pie charts in column B depict the fractions of genes for each KEGG category that were differently upregulated (red), downregulated (blue) or not differentially regulated on SO, SW and P (black). Counts in column C indicate how many genes are classified into each KEGG category in the N. californiae genome. Symbols in column D represent the results of a series of Fisher’s exact tests, where bidirectional arrows indicate a KEGG category was both significantly downregulated and upregulated, and unidirectional arrows indicate that the category was significantly upregulated or downregulated by SO, SW and P availability, whereas cross symbols represent no significant changes in category regulation. P values from Fisher’s exact tests were adjusted using the Benjamini–Hochberg correction, and errors are calculated from biological replicates (n = 3).
Fig. 5
Fig. 5. Predictive models implicate some unclassified N. californiae genes as novel lignocellulose-active enzymes.
a, Unclassified genes presented here are upregulated (q < 0.05) on all three lignocellulose types relative to a purified cellulose control. Several subsets of the uncharacterized, upregulated genes are trafficked to the outer membrane of fungal cells as predicted by the workflow. In the pie chart, red, blue and black slices represent annotated genes that were upregulated, downregulated or not regulated; salmon, light blue, and grey slices represent unannotated genes that were upregulated, downregulated or not regulated. Signal peptides were predicted by SignalP5.0, and transmembrane helices were predicted by TOPCONS. bd, Heatmaps for the ten most transcribed gene products of interest are shown for secreted soluble proteins (b), membrane-associated proteins having a single transmembrane helix (c) and membrane-embedded proteins having more than one transmembrane helix (d). e, A heatmap of the ten most expressed genes that were also predicted to have CAZyme domains by various models. In e, the CAZyme domain predicted by dbCAN and RoseTTAfold is noted to the right of the heatmap row. Identifiers to the left of each row of heatmaps in be are protein IDs from JGI’s Mycocosm (https://mycocosm.jgi.doe.gov/mycocosm/home). The q values are calculated using DESeq2 with PC as the reference condition.
Extended Data Fig. 1
Extended Data Fig. 1. Biomass composition before and after growth shows selective removal of cellulose and hemicellulose, but also some acid-soluble lignin removal.
In the figure legend, ASL abbreviates acid-soluble lignin, whereas AIL abbreviates acid-insoluble lignin. Panel A shows the starting composition of sorghum (SO), switchgrass (SW), and poplar P. Panel B represents the composition of SO, SW, and P after the growth of Neocallimastix californiae, and panel C represents the composition of SO, SW, and P after the growth of Anaeromyces robustus. Panel D shows the differences between panel B and panel A, and panel E shows the differences between panel C and panel A. Error bars in all panels represent the standard deviation of biological replicates (n = 3).
Extended Data Fig. 2
Extended Data Fig. 2. The novel anaerobic fungal isolate, Piromyces sp. E1M, possesses standard Neocallimastigomycetes morphology.
These phenotypes are consistent with the genera Piromyces and Neocallimastix, and was classified as belonging to the genus Piromyces based on its internal transcribed spacer region (ITS1) and large ribosomal subunit (LSU) gene sequences. Mats of interlocking microrhizoids form when the fungus is cultivated on soluble sugar dimers, such as cellobiose, shown in panel A. Rhizoidal networks intercalate lignocellulose in panel B during fungal colonization. The fungus produces motile zoospores, as displayed in panel C. These are single observations and not necessarily representative of the average strain morphology.
Extended Data Fig. 3
Extended Data Fig. 3. Two-dimensional-HSQC-NMR data for unautoclaved controls compared with uninoculated, autoclaved controls.
The features in lignin shift during the process of sterilizing the growth medium, but these changes are markedly different from changes induced by fungi. Unautoclaved controls are shown in panel A for sorghum, panel B for switchgrass, and panel C for poplar. Uninoculated, autoclaved controls are shown in panel D for sorghum, panel E for switchgrass, and panel F for poplar. In sorghum and switchgrass, S:G ratios increased in the autoclave versus decreasing during fungal treatment. In poplar, the S:G ratio decreased after autoclaving versus increasing in cultures treated with anaerobic fungi. All integration percentages depicted here are calculated on a ΣSG basis.
Extended Data Fig. 4
Extended Data Fig. 4. Gel-permeation chromatography (GPC) traces of lignin fragments, derived from lignocellulose or alkaline lignin.
Lignocellulose derived samples are in panels A-F and alkaline lignin samples are in in Panel G. Traces show the molecular weight distribution of lignin oligomers before and after modification by cultures of anaerobic fungi and demonstrate changes to the molecular weight distribution of lignin oligomers. In all panels, the uninoculated and autoclaved control for the appropriate substrate is included (black, solid line). In panels A-F, the unautoclaved control is also included (black, dotted line). Vertical dotted lines in panels A-F indicate 3,500 Da on the x-axis. Panels A and B show lignin oligomers derived from sorghum after growth for Neocallimastix californiae A and Anaeromyces robustus B. Panels C and D show lignin oligomers derived from switchgrass after modification by N. californiae C and A. robustus D. Panels E and F show lignin oligomers derived from poplar after modification by N. californiae E and A. robustus F. Error bands shown in Panel G represent the standard deviation and the center line represents the mean calculated from n = 3 biological replicates.
Extended Data Fig. 5
Extended Data Fig. 5. Pearson’s correlations of quality-controlled reads from each sequencing library suggest that biological triplicates are highly similar, and all should be included in subsequent differential expression analysis.
As anticipated, lignocellulosic substrates induced more similar transcriptional profiles to one another than to purified cellulose or cellobiose, and grass (sorghum and switchgrass) lignocellulose treatments were more like one another than to poplar. Libraries are ordered as groups of replicates. Values in cells are Pearson’s correlation coefficients. Purple borders around replicate comparisons indicate acceptable correlation for continued analysis. Each identifier represents a single replicate. Samples correspond to the following identifiers: GTHNB = cellobiose replicate 1, GTHNC = cellobiose replicate 2, GTHNG = cellobiose replicate 3, GTHNH = purified cellulose replicate 1, GTHNN = purified cellulose replicate 2, GTHNO = purified cellulose replicate 3, GTHNP = switchgrass replicate 1, GTHNS = switchgrass replicate 2, GTHNT = switchgrass replicate 3, GTHNU = sorghum replicate 1, GTHNW = sorghum replicate 2, GTHNX = sorghum replicate 3, GTHNY = poplar replicate 1, GTHNZ = poplar replicate 2, and GTHOA = poplar replicate 3.
Extended Data Fig. 6
Extended Data Fig. 6. Multiple sequence alignments of gene products of interest reveal some clusters of predicted gene products with homologous regions.
Only genes that had >10 TPM and q < 0.05 were included in these multiple sequence alignments. Each analysis was completed 100 times and the % of replicates in which the associated amino acid sequences clustered together are shown next to the branches. In panel A, a tree, built from predicted amino acid sequences for proteins with a signal peptide but no transmembrane, helices is shown. This tree contains 113 amino acid sequences and their alignment used 3613 amino acid positions. In panel B, a tree, built from predicted amino acid sequences for proteins with a signal peptide and a single terminal transmembrane, is shown. This tree contains 35 amino acid sequences and their alignment used 1845 amino acid positions. In panel C, a tree, built from predicted amino acid sequences for proteins with more than one transmembrane, is shown. This tree contains 12 amino acid sequences and their alignment used 1260 s amino acid positions. CAZyme domain predictions are included in cases only where predicted CAZymes clustered with other genes at a greater than 90% rate. Clusters of homologs have not been checked to see if regions of homology coincide with CAZyme active sites, however many genes cluster by predicted CAZyme active site.
Extended Data Fig. 7
Extended Data Fig. 7. Model compound assays suggest lignin bonds are broken by small molecule-mediated redox reactions in Neocallimastigomycetes cultures.
Data from Neocallimastix californiae cultures are depicted in panel A, whereas data from Anaeromyces robustus cultures are depicted in panel B. Values derived from blank incubations (with only model compounds and phosphate buffer) were subtracted from all depicted values. Tyrosinase incubations are positive controls. Cell lysate incubations without model compound added are included to account for any autofluorescence of fungal lysate. Error bars represent standard deviations for n = 5 unpaired technical replicates, where the uncertainty associated with blank TimeZero, blank TimeFinal, sample TimeZero, and sample TimeFinal have been propagated to calculate representative standard deviations. The change in fluorescence over 24 h is further normalized to the amount of protein in each incubation, and the protein concentration is shown below the x-axis for each incubation.

References

    1. Bomble, Y. J. et al. Lignocellulose deconstruction in the biosphere. Curr. Opin. Chem. Biol.41, 61–70 (2017). - PubMed
    1. Ralph, J. et al. Lignins: natural polymers from oxidative coupling of 4-hydroxyphenyl-propanoids. Phytochem. Rev.3, 29–60 (2004).
    1. Liu, Q., Luo, L. & Zheng, L. Lignins: biosynthesis and biological functions in plants. Int. J. Mol. Sci.19, 335 (2018). - PMC - PubMed
    1. Robinson, J. M. Lignin, land plants, and fungi: biological evolution affecting Phanerozoic oxygen balance. Geology18, 607–610 (1990).
    1. Ragauskas, A. J. et al. Lignin valorization: improving lignin processing in the biorefinery. Science344, 1246843 (2014). - PubMed

Publication types