. 2023 Apr;29(4):1017-1027.
doi: 10.1038/s41591-023-02243-5. Epub 2023 Mar 9.

Dysbiosis of a microbiota-immune metasystem in critical illness is associated with nosocomial infections

Affiliations

Dysbiosis of a microbiota-immune metasystem in critical illness is associated with nosocomial infections

Jared Schlechte et al. Nat Med. 2023 Apr.

Abstract

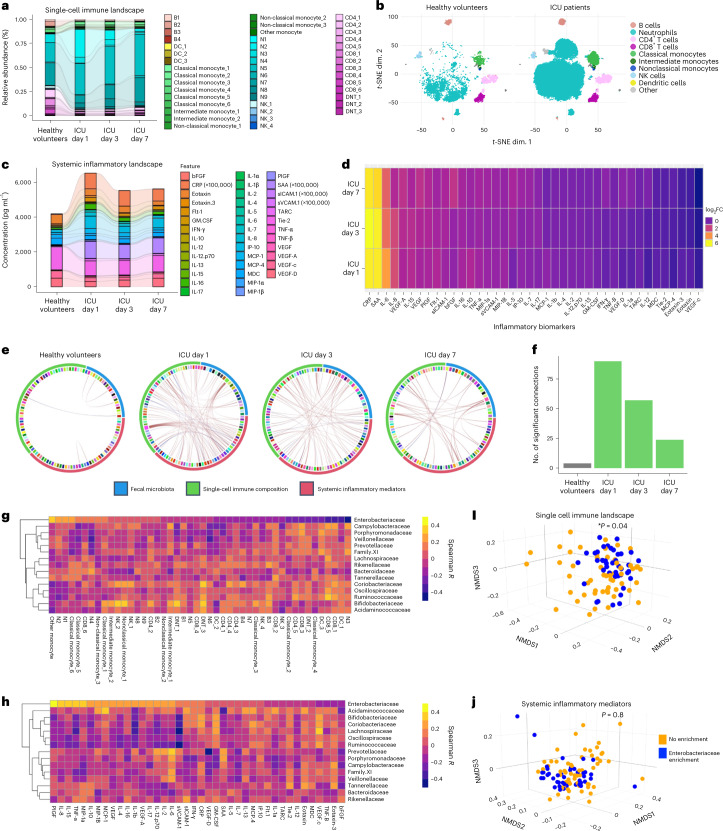
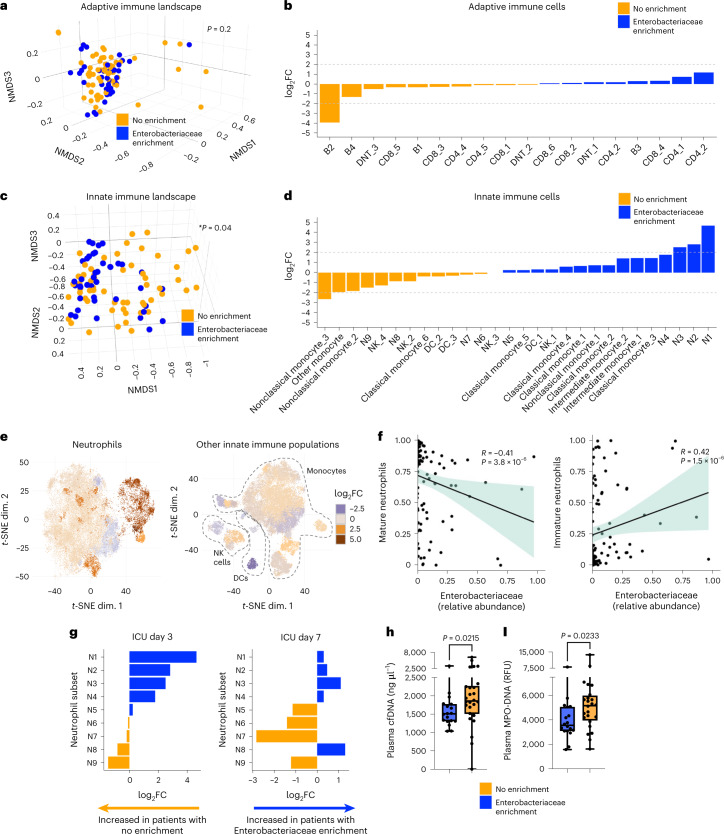
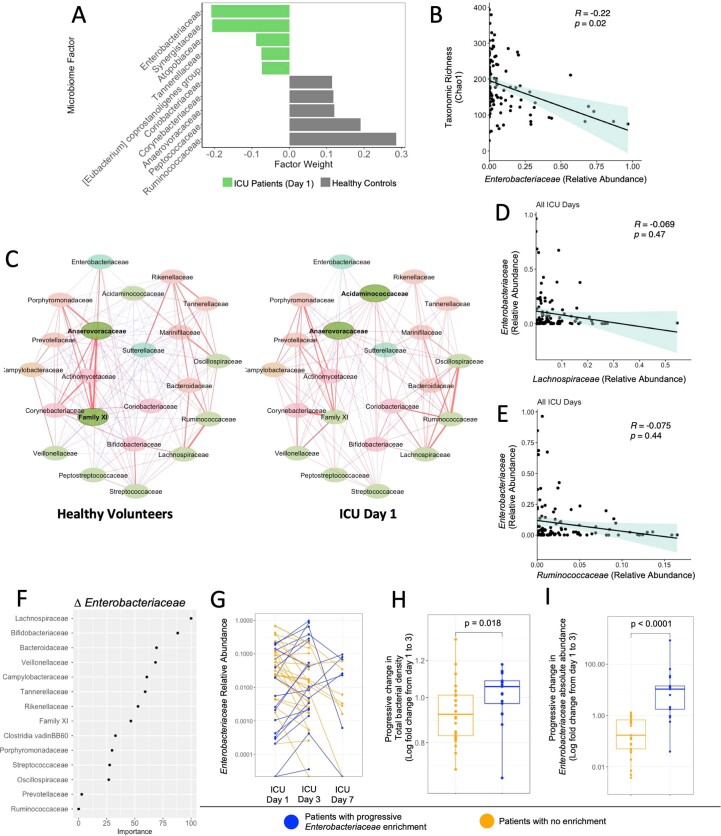
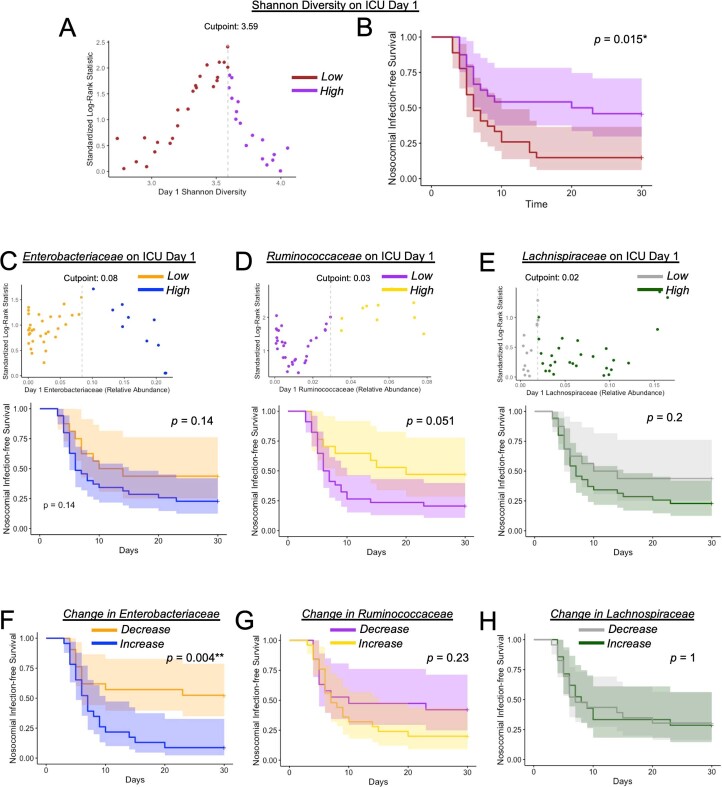
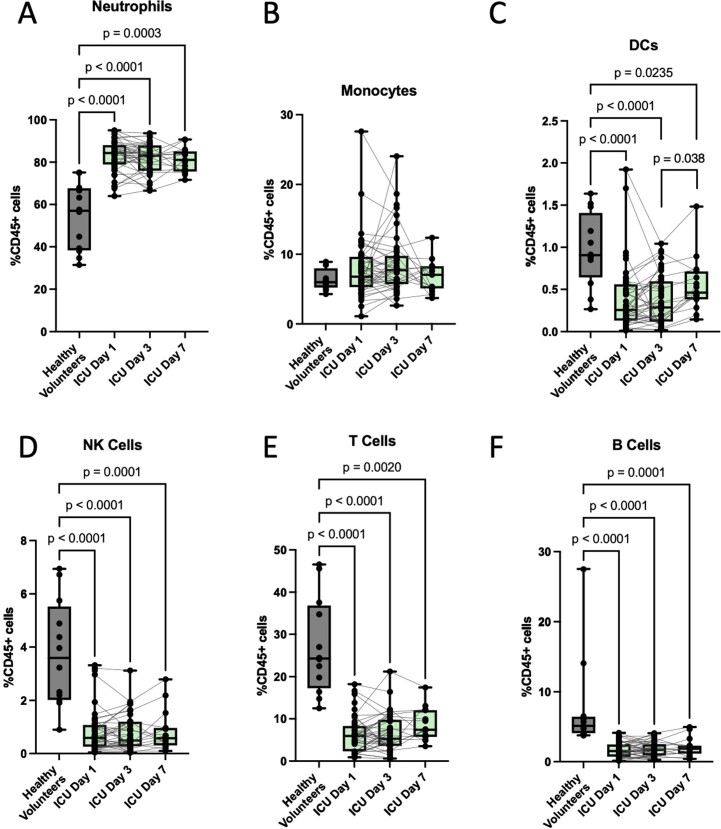
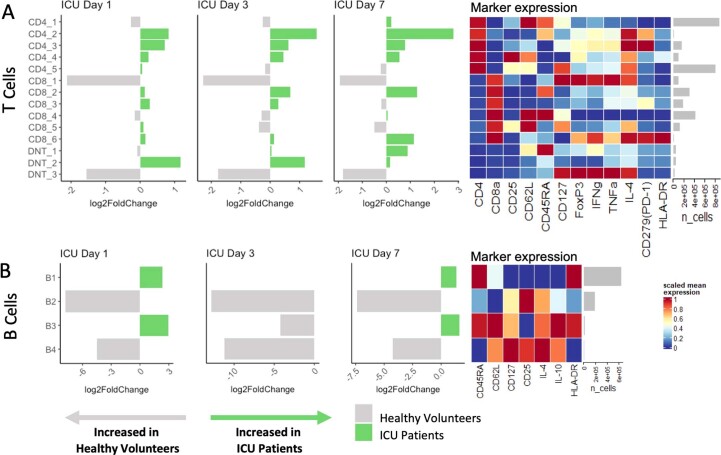
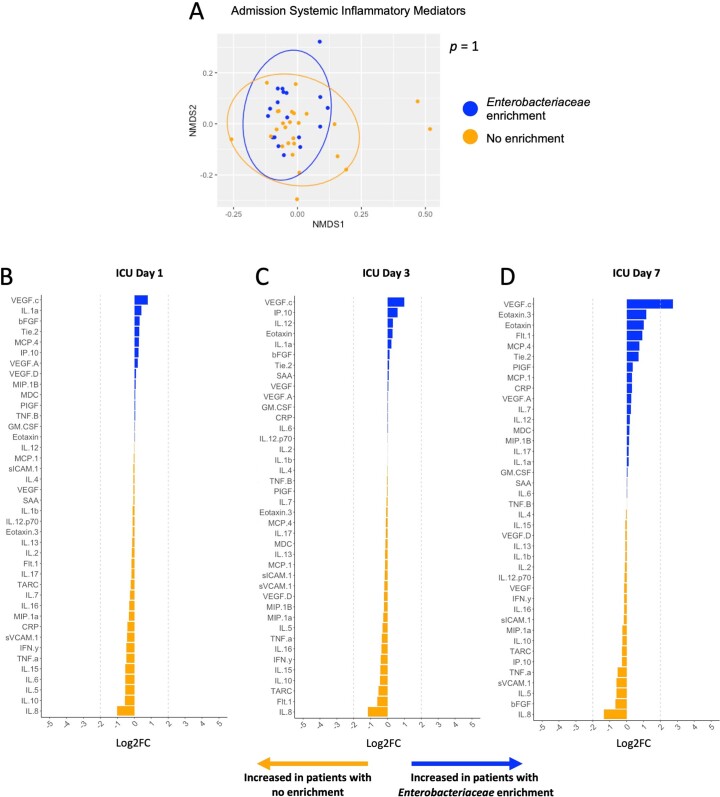
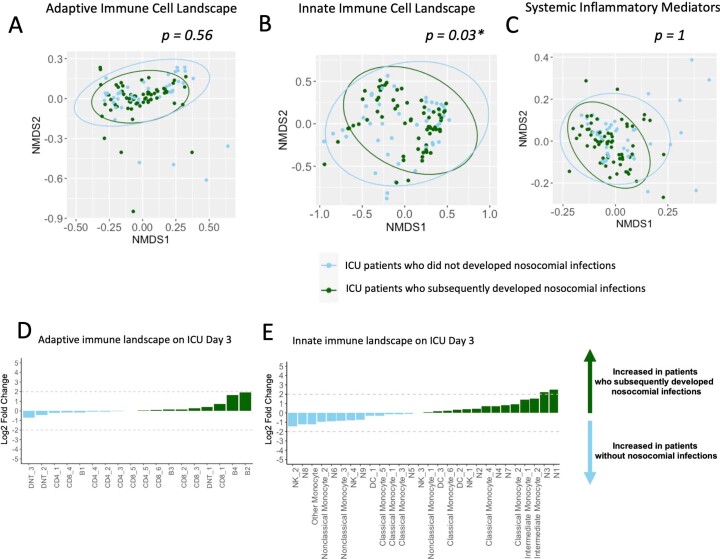
Critically ill patients in intensive care units experience profound alterations of their gut microbiota that have been linked to a high risk of hospital-acquired (nosocomial) infections and adverse outcomes through unclear mechanisms. Abundant mouse and limited human data suggest that the gut microbiota can contribute to maintenance of systemic immune homeostasis, and that intestinal dysbiosis may lead to defects in immune defense against infections. Here we use integrated systems-level analyses of fecal microbiota dynamics in rectal swabs and single-cell profiling of systemic immune and inflammatory responses in a prospective longitudinal cohort study of critically ill patients to show that the gut microbiota and systemic immunity function as an integrated metasystem, where intestinal dysbiosis is coupled to impaired host defense and increased frequency of nosocomial infections. Longitudinal microbiota analysis by 16s rRNA gene sequencing of rectal swabs and single-cell profiling of blood using mass cytometry revealed that microbiota and immune dynamics during acute critical illness were highly interconnected and dominated by Enterobacteriaceae enrichment, dysregulated myeloid cell responses and amplified systemic inflammation, with a lesser impact on adaptive mechanisms of host defense. Intestinal Enterobacteriaceae enrichment was coupled with impaired innate antimicrobial effector responses, including hypofunctional and immature neutrophils and was associated with an increased risk of infections by various bacterial and fungal pathogens. Collectively, our findings suggest that dysbiosis of an interconnected metasystem between the gut microbiota and systemic immune response may drive impaired host defense and susceptibility to nosocomial infections in critical illness.


Conflict of interest statement

The authors declare no competing interests.

Figures

Fig. 1
Fig. 1. Intestinal dysbiosis with progressive Enterobacteriaceae enrichment in critical illness is associated with nosocomial infections.
a, Taxonomic composition by relative abundance of bacterial families. b, Three-dimensional principal-coordinates analysis (Bray–Curtis dissimilarity distances, genus level) analyzed by PERMANOVA. c, Shannon index. d, Chao1 index in rectal swabs from critically ill patients on day 1 (n = 51) and again from survivors who remained in ICU on day 3 (n = 44) and day 7 (n = 15), compared to healthy volunteers (n = 15). Dots represent individual patients, central line indicates median, box shows interquartile range (IQR) and whiskers show range; analyzed by two-sided Kruskal–Wallis test (healthy versus ICU days) with pairwise comparisons of repeated measures across days using a mixed linear regression model with a post hoc Tukey’s test. e, MOFA of microbiota composition between healthy volunteers and ICU patients showing top ten taxonomic factors (families) and their relative contributions to explained microbiota variance (factor weight). f, Enterobacteriaceae relative abundance on days 1, 3 and 7 of ICU admission compared to healthy controls. Dots represent individual patients, central line shows median, box shows IQR and whiskers show range, analysis as per c and d. g, Correlation between Enterobacteriaceae relative abundance and Shannon index, analyzed using Spearman correlation test. Dots show individual patient samples, regression (line) and 95% confidence intervals (shaded area) are shown. h, Penalized ridge regression of the 15 most abundant bacterial families and their importance toward change in Shannon diversity from days 1–3 of ICU admission. i,j, Mean relative abundance († indicates Padj  < 0.1 by ANCOM-II differential abundance) (i) and correlation matrices (j) of the 15 most abundant bacterial families on ICU day 3. k, Longitudinal microbiota community stability index between patients with progressive Enterobacteriaceae enrichment (n = 18) or no enrichment (n = 26). Dots represent individual patients, central line shows the median, box shows IQR and whiskers show range; analyzed by two-sided Mann–Whitney U-test. ln, The 30-d nosocomial infection-free survival analyzed by log-rank test (l), odds ratio of nosocomial infection caused by any pathogen or Enterobacteriaceae pathogen determined by two-sided Fisher’s exact test (m) and pathogens identified in nosocomial infections (n) (n = 30 infections in 28 patients). P values as shown in b; *P < 0.05, **P < 0.01.
Fig. 2
Fig. 2. Dynamic microbiota–immune metasystem dysbiosis in critical illness.
ad, The cellular immune landscape of blood (a,b) and plasma inflammatory mediators (c,d) were quantified by mass cytometry and multiplexed electrochemiluminescence assays, respectively, in blood samples from critically ill patients (n = 51) sampled on day 1 of admission (n = 49) and again from survivors who remined in ICU on day 3 (n = 43) and day 7 (n = 15), compared to healthy volunteer controls (n = 12). The abundance of all immune cell populations (shown as %CD45+) identified by FlowSOM clustering of single-cell mass cytometry data (Methods) (a) and t-SNE dimensionality reduction of the single-cell immune landscape between healthy volunteers and ICU patients (b). Concentrations (pg ml−1) of inflammatory mediators in the plasma (c) and log2 fold change (FC) (d) in concentrations of each mediator in ICU patients on days 1, 3 and 7 compared to healthy volunteers. CRP, C-reactive protein; TNF, tumor necrosis factor; IFN, interferon; SAA, serum amyloid A. e,f, Chord diagrams depicting the significant Spearman correlations (false discovery rate (FDR)-adjusted P < 0.1) between microbiota composition, immune cell landscape and systemic inflammatory mediators in healthy volunteers and ICU patients at each time point (e) and quantification of the number of significant Spearman’s correlations (FDR-adjusted P < 0.1) between metasystem compartments (f). g,h, Heat map of individual Spearman’s correlation coefficients between the 15 most abundant microbiota families (relative abundance) and immune cell clusters in blood (g) and plasma inflammatory mediators (h) across the first week of ICU admission. i,j, NMDS ordination of the single-cell immune landscape (i) and systemic inflammatory mediators (j) across the first 7 d of ICU admission in patients with (n = 18 patients) and without (n = 26 patients) progressive fecal Enterobacteriaceae enrichment. Statistical comparisons were performed using PERMANOVA (Supplementary Tables 15 and 16 show full model results) accounting for repeated measures, each point represents an individual patient-time point; P values as shown. t-SNE, t-distributed stochastic neighbor embedding.
Fig. 3
Fig. 3. Enterobacteriaceae dysbiosis and impaired neutrophil host defense in critical illness.
ad, NMDS ordinations (a,c) and comparisons of abundance (b,d) of adaptive immune cell (T and B cells) populations and innate immune cell populations (all neutrophils, monocytes, dendritic cells and innate lymphoid cell populations) (a,b) identified by clustering of mass cytometry data in the blood of ICU patients with (n = 18) or without (n = 26) progressive enrichment of Enterobacteriaceae in their fecal microbiota. Dots show individual patient-time points across the first 7 d of ICU admission, with statistical analysis by PERMANOVA accounting for repeated measures (a,c). e, t-SNE plots of neutrophils (left) and all other innate immune cells (right; monocytes, dendritic cells and NK cell clusters as indicated), with heat map overlay showing the log2FC in abundance of each cell cluster between ICU patients with (n = 18) or without (n = 26) progressive enrichment of Enterobacteriaceae in their fecal microbiota. f, Correlation between fecal Enterobacteriaceae relative abundance and the quantity of mature (left) and immature (right) neutrophils (shown as proportion of total neutrophils) in ICU patients across the first week of admission analyzed using Spearman’s ranked correlation test. Dots show individual patient samples, regression (line) and 95% confidence intervals (shaded area) are shown. g, Comparison of neutrophil clusters in blood of ICU patients with (n = 18) or without (n = 26) Enterobacteriaceae enrichment (shown as log2 fold difference of cluster abundance between groups). To determine the independent contribution of Enterobacteriaceae enrichment status (ae,g), analyses controlled for clinical covariables that were independently associated with immune cell composition (Supplementary Table 15). i,j, Quantification of plasma NET markers (i) cell-free DNA and (j) MPO–DNA complexes on ICU day 3 in patients with (n = 18) or without (n = 26) Enterobacteriaceae enrichment. Dots represent individual patients, central line shows the median, box shows the IQR and whiskers show the range; statistical comparison was performed using a two-sided Mann–Whitney U-test. P values are shown.
Extended Data Fig. 1
Extended Data Fig. 1. Fecal microbiota dynamics in critically ill patients.
(a) Taxonomic composition (phylum level) and (b) analysis of the relative abundance of bacterial families in critically ill patients (N = 51) sampled on day 1 of admission (N = 51), and again from survivors who remined in ICU on day 3 (N = 44), and day 7 (N = 15), compared to healthy volunteer controls (N = 15). Dots are individual patients, central line is median, box shows IQR, whiskers show range. Statistical comparisons between healthy volunteers and ICU patients at each time point were performed using a Kruskal–Wallis test, while pairwise comparisons of repeated measures across ICU patient-days were performed using mixed linear regression model with post hoc Tukey’s tests to account for repeated measures and variable drop-out. P values as shown. (c) Differential abundance of bacterial families between ICU patients and healthy volunteers was determined using ANCOM-II with a mixed model to account for repeated measures (across sampling days) (*p-adj<0.1).
Extended Data Fig. 2
Extended Data Fig. 2. Inter-bacterial dynamics in the fecal microbiota of ICU patients.
(a) Multi-Omics Factor Analysis (MOFA) was used to calculate the explained variance of microbiota composition between healthy volunteers and ICU patients on day 1 of admission, showing top 10 taxonomic factors (families) and their relative contributions to explained variance (factor weight). (b) Spearman correlation between the relative abundance of Enterobacteriaceae and taxonomic richness (Chao1) in ICU patients across all sampling timepoints. Dots show individual patient samples, regression line and 95% confidence interval (shaded area) shown. (c) Spearman correlation network of the most abundant bacterial families in healthy volunteers and ICU patients on day 1 of admission (upper quartile, 25%). (d, e) Spearman correlation between Enterobacteriaceae relative abundance and the relative abundance of Lachnospiraceae (D) and Ruminococcaceae (E) in ICU patients across all sampling timepoints. Dots show patient samples, regression line and 95% confidence interval (shaded area) shown. (f) Penalized ridge regression of the 15 most abundant bacterial families in ICU patients and their importance towards the progressive change in Enterobacteriaceae relative abundance from day 1 to 3 of admission (∆Enterobacteriaceae). (g) Relative abundance of Enterobacteriaceae on days 1, 3, and 7 of ICU admission in patients with (N = 18) or without (N = 26) progressive enrichment of Enterobacteriaceae in their fecal microbiota. (h) Progressive change in total bacterial density, and (i) Enterobacteriaceae absolute abundance in rectal swab samples from day 1 to 3 of admission (shown as log fold change) in patients with (N = 17, one patient had insufficient remaining sample for qPCR) or without (N = 26) progressive enrichment of Enterobacteriaceae in their fecal microbiota. Dots are individual patients, central line is median, box shows IQR, whiskers show range, statistical analysis by 2-sided Mann–Whitney test. P values as shown.
Extended Data Fig. 3
Extended Data Fig. 3. Microbiota dynamics and nosocomial infection-free survival in critical illness.
(a) Maximally selected rank statistics identified that a Shannon diversity index value of 3.59 on day 1 of admission yielded the greatest separation of patients based on nosocomial infection-free survival. Patients with Shannon index above this cutoff (>3.59) were grouped as ‘high’ Shannon index, and those below cutoff (<3.59) were grouped as ‘low’ Shannon index. (b) Kaplan–Meier curve of nosocomial infection-free survival between patients with high Shannon diversity or low Shannon diversity as determined in (A). (c–e) Maximally selected rank statistics identified relative abundance values on day 1 of ICU admission of (C, top) Enterobacteriaceae, (D, top) Ruminococcaceae, and (E, top) Lachnospiraceae that yielded the greatest separation of patients based on nosocomial infection-free survival. Patients with relative abundance values above the cutoff were grouped as ‘high’, and those below cutoff were grouped as ‘low’ for each respective bacterial family. (Bottom panels) Kaplan–Meier curves of nosocomial infection-free survival between patients with high versus low relative abundance of (C, bottom) Enterobacteriaceae, (D, bottom) Ruminococcaceae, and (E, bottom) Lachnospiraceae. (f–h) Kaplan–Meier curves of nosocomial infection-free survival in patients stratified by the change in relative abundance between day 1 and 3 of ICU admission (increase vs decrease) of (F) Enterobacteriaceae, (G) Ruminococcaceae, and (H) Lachnospiraceae. Statistical analysis was performed using log-rank test, p values as shown.
Extended Data Fig. 4
Extended Data Fig. 4. Immune cell dynamics in critically ill patients.
Mass cytometry of whole blood was used to quantify the abundance of major immune cell populations in critically ill patients (N = 51) sampled on day 1 of admission (N = 49), and again from survivors who remined in ICU on day 3 (N = 43), and day 7 (N = 15), compared to healthy volunteer controls (N = 12). Data are shown as %CD45+ cells in blood for (a) neutrophil, (b) monocytes, (c) dendritic cells, (d) NK cells, (e) T lymphocytes, and (f) B lymphocytes. Dots are individual patients, central line is median, box shows IQR, whiskers show range. Statistical comparisons between healthy volunteers and ICU patients at each time point were performed using a Kruskal–Wallis test, while pairwise comparisons of repeated measures across ICU patient-days were performed using mixed linear regression model to account for repeated measures and variable drop-out, with post hoc Tukey’s tests. P values as shown.
Extended Data Fig. 5
Extended Data Fig. 5. Innate immune landscape during critical illness.
FlowSOM clustering of single-cell mass cytometry data was used to identify unique clusters of (a) neutrophil, (b) monocytes, (c) dendritic cell, and (d) NK cells in blood from critically ill patients (N = 51) sampled on day 1 of admission (N = 49), and again from survivors who remined in ICU on day 3 (N = 43), and day 7 (N = 15), compared to healthy volunteer controls (N = 12). Graphs shown log2 fold difference of cluster abundance between healthy controls and ICU patients on ICU day 1, day 3, and day 7. Heatmaps show mean expression level of key markers for each cell type measured by mass cytometry (scaled by column/marker), as well as total quantity (mean) of each cell cluster (cells/mL of blood).
Extended Data Fig. 6
Extended Data Fig. 6. Adaptive immune cell landscape during critical illness.
FlowSOM clustering of single-cell mass cytometry data was used to identify unique clusters of (a) T cells, and (b) B cells in blood from critically ill patients (N = 51) sampled on day 1 of admission (N = 49), and again from survivors who remined in ICU on day 3 (N = 43), and day 7 (N = 15), compared to healthy volunteer controls (N = 12). Graphs shown log2 fold difference of cluster abundance between healthy controls and ICU patients on ICU day 1, day 3, and day 7. Heatmaps show mean expression level of key markers for each cell type measured by mass cytometry (scaled by column/marker), as well as total quantity (mean) of each cell cluster (cells/mL of blood).
Extended Data Fig. 7
Extended Data Fig. 7. Enterobacteriaceae enrichment in the fecal microbiota and systemic inflammatory response during critical illness.
(a) Non-metric multidimensional scaling (NMDS) ordination of the systemic inflammatory mediators at time of ICU admission in patients who subsequently developed (N = 18 patients) or did not develop (N = 26 patients) progressive fecal Enterobacteriaceae enrichment. Statistical comparisons were performed using permutational analysis of variance (PERMANOVA), each point represents an individual patient-time point, p value as shown. (b–d) Plasma levels of inflammatory mediators were compared (shown as log2 fold difference) between ICU patients with (N = 18) or without (N = 26) progressive enrichment of Enterobacteriaceae in their fecal microbiota on day 1 of admission, and again from survivors who remined in ICU on day 3, and day 7.
Extended Data Fig. 8
Extended Data Fig. 8. Cellular immune and inflammatory landscapes preceding nosocomial infections in critical illness patients.
Non-metric multidimensional scaling (NMDS) ordination of the quantities across the first week of ICU admission of (a) adaptive immune cell (T and B cells) populations, (b) innate immune cell populations (all neutrophils, monocytes, dendritic cells, innate lymphoid cell populations) identified by unsupervised clustering of single cell mass cytometry analysis of blood, and (c) the systemic inflammatory mediators in patients who subsequently developed nosocomial infections (N = 28 patients) versus those who did not develop infections (N = 23 patients). Statistical comparisons were performed using permutational multivariate analysis of variance (PERMANOVA), each point represents an individual patient-time point, p values as shown. To determine the independent associations of nosocomial infection status, analyses controlled for clinical covariables that were independently associated with immune cell composition (Supplementary Table 15). (d, e) Differential abundance analysis of the (d) adaptive immune cell clusters and (e) innate immune cell clusters identified by unsupervised clustering of single cell mass cytometry analysis of blood from ICU on Day 3 of admission (prior to any nosocomial infections) in patients who subsequently developed nosocomial infections (N = 28 patients) and those who did not (N = 23 patients).

References

    1. Vincent J-L, et al. Prevalence and outcomes of infection among patients in intensive care units in 2017. JAMA. 2020;323:1478–1487. doi: 10.1001/jama.2020.2717. - DOI - PMC - PubMed
    1. Laupland KB, et al. Population-based assessment of intensive care unit-acquired bloodstream infections in adults: incidence, risk factors, and associated mortality rate. Crit. Care Med. 2002;30:2462–2467. doi: 10.1097/00003246-200211000-00010. - DOI - PubMed
    1. Boomer JS, et al. Immunosuppression in patients who die of sepsis and multiple organ failure. JAMA. 2011;306:2594. doi: 10.1001/jama.2011.1829. - DOI - PMC - PubMed
    1. Duggal NA, Snelson C, Shaheen U, Pearce V, Lord JM. Innate and adaptive immune dysregulation in critically ill ICU patients. Sci. Rep. 2018;8:10186. doi: 10.1038/s41598-018-28409-7. - DOI - PMC - PubMed
    1. Morris AC, et al. Combined dysfunctions of immune cells predict nosocomial infection in critically ill patients. Br. J. Anaesth. 2013;111:778–787. doi: 10.1093/bja/aet205. - DOI - PubMed

Publication types

Substances

Grants and funding