. 2023 Apr;26(4):650-663.
doi: 10.1038/s41593-023-01259-x. Epub 2023 Mar 9.

Molecular and network-level mechanisms explaining individual differences in autism spectrum disorder

Affiliations

Molecular and network-level mechanisms explaining individual differences in autism spectrum disorder

Amanda M Buch et al. Nat Neurosci. 2023 Apr.

Abstract

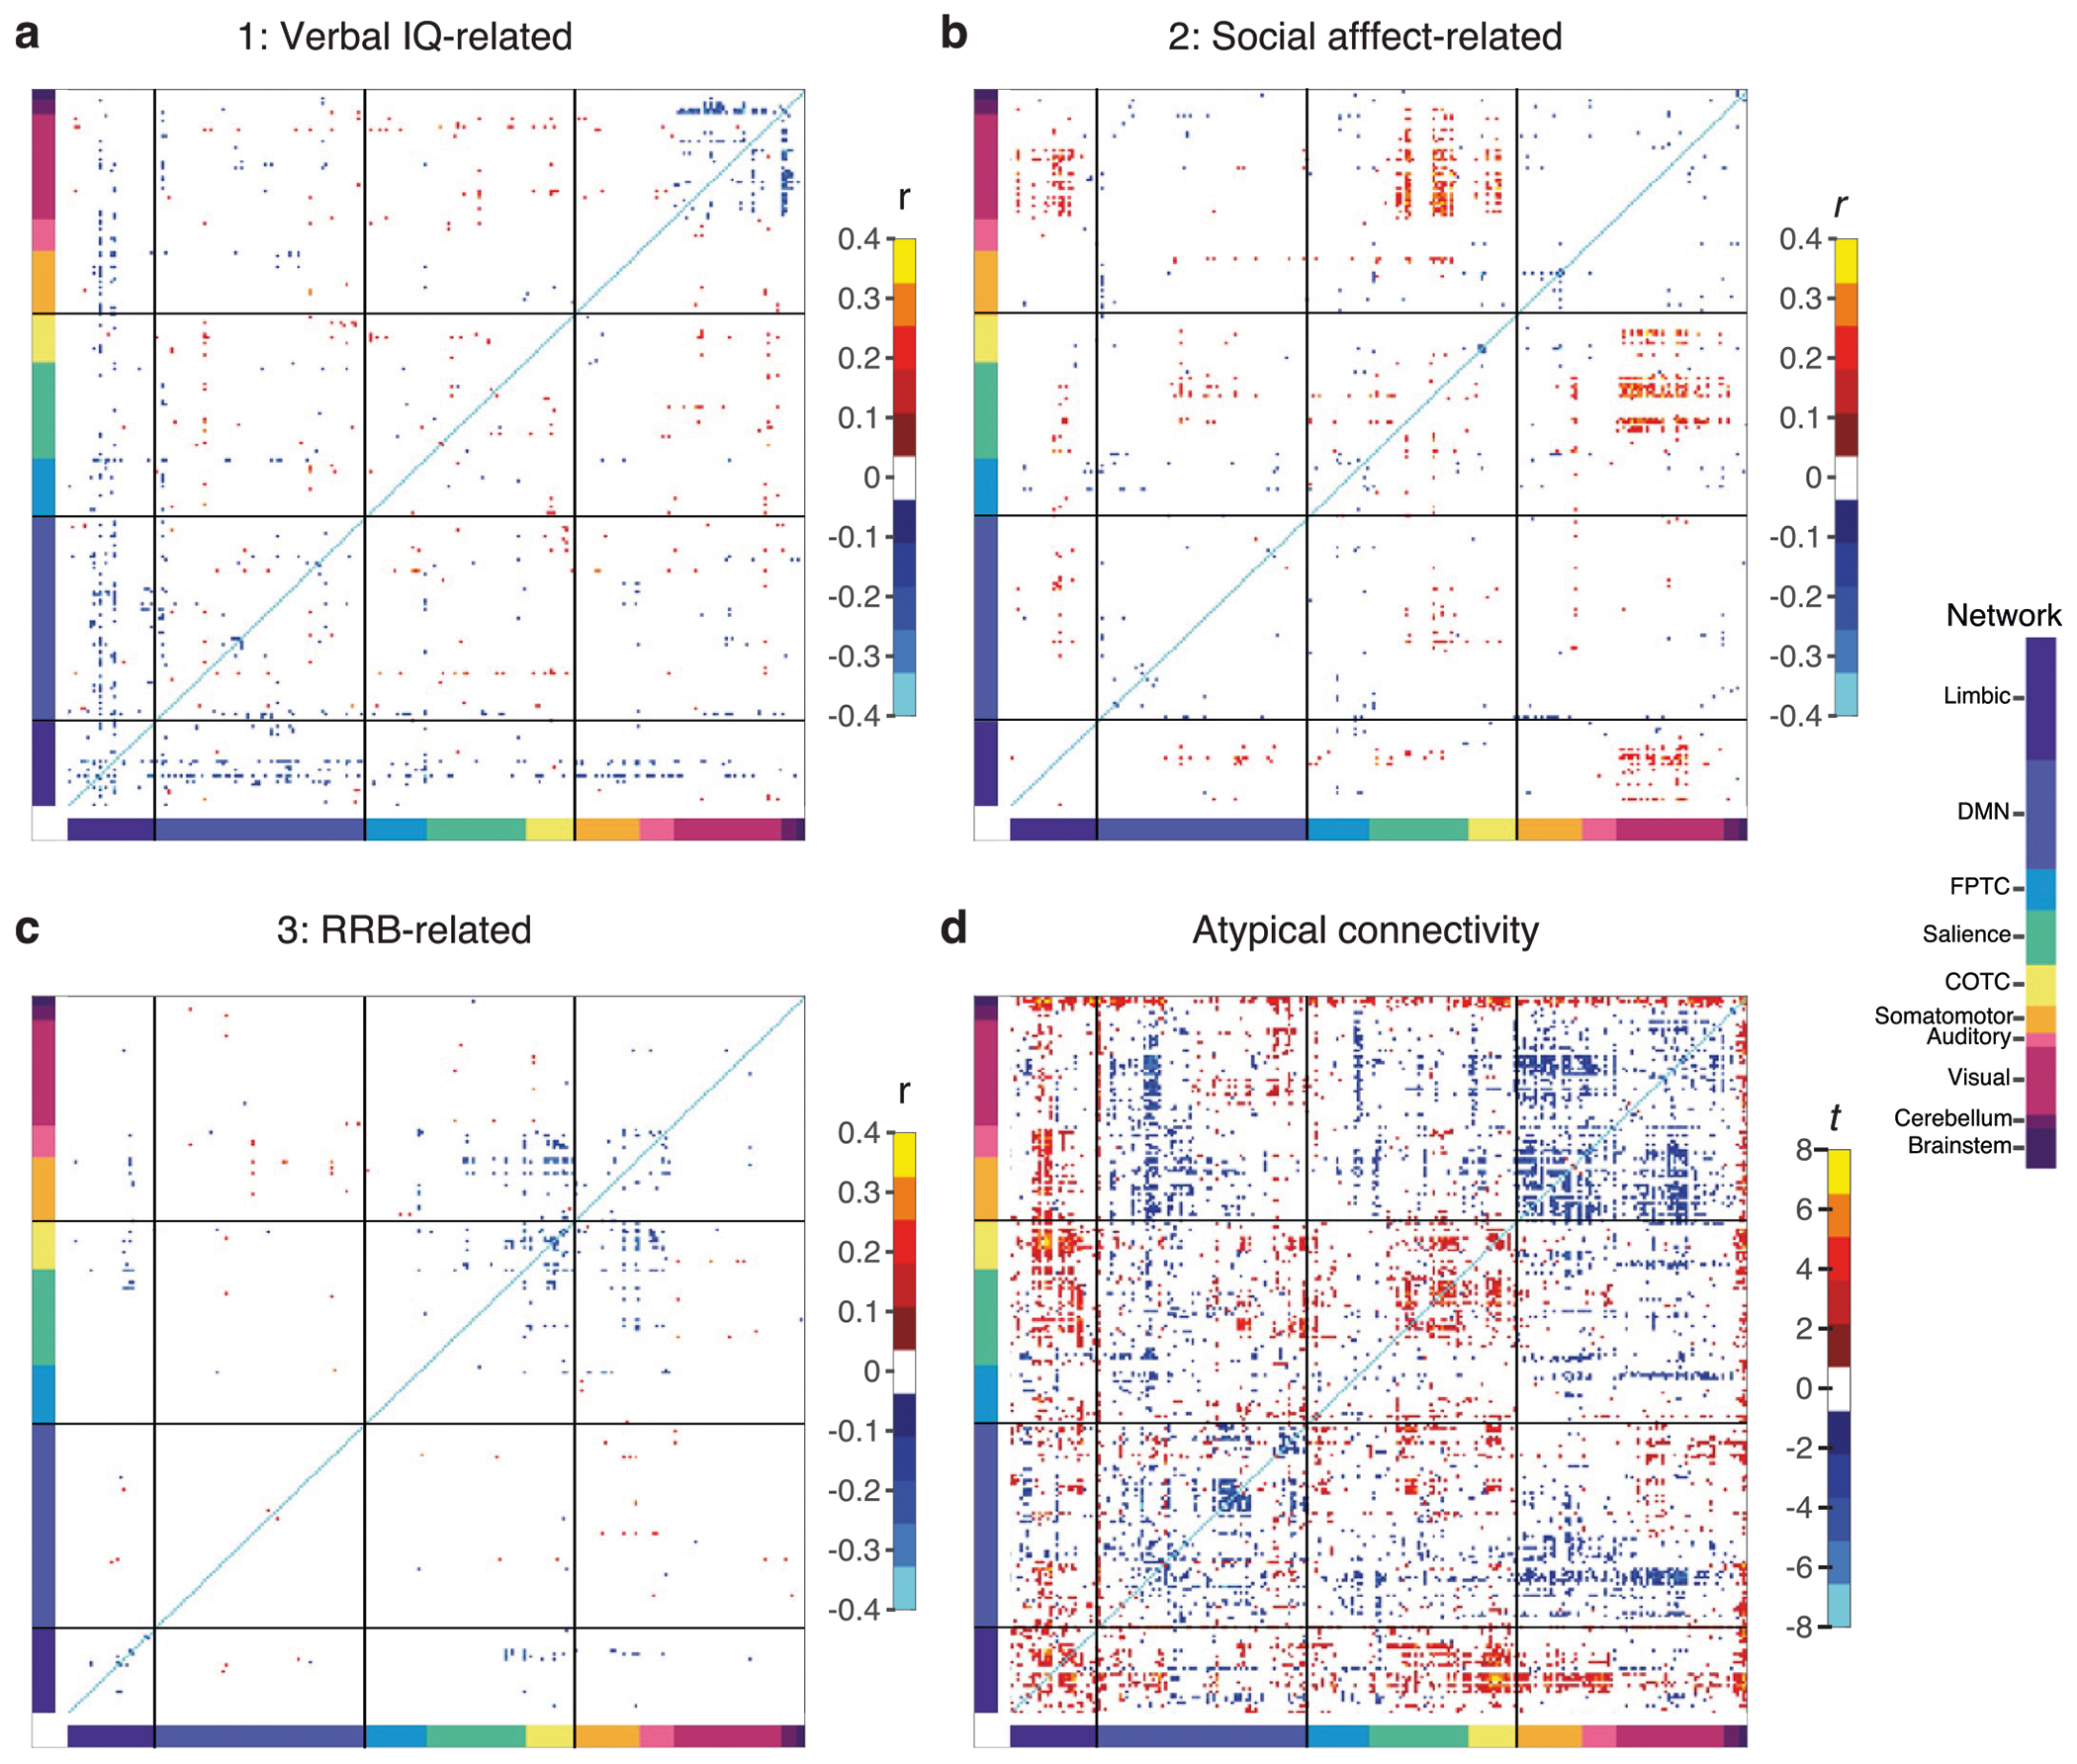
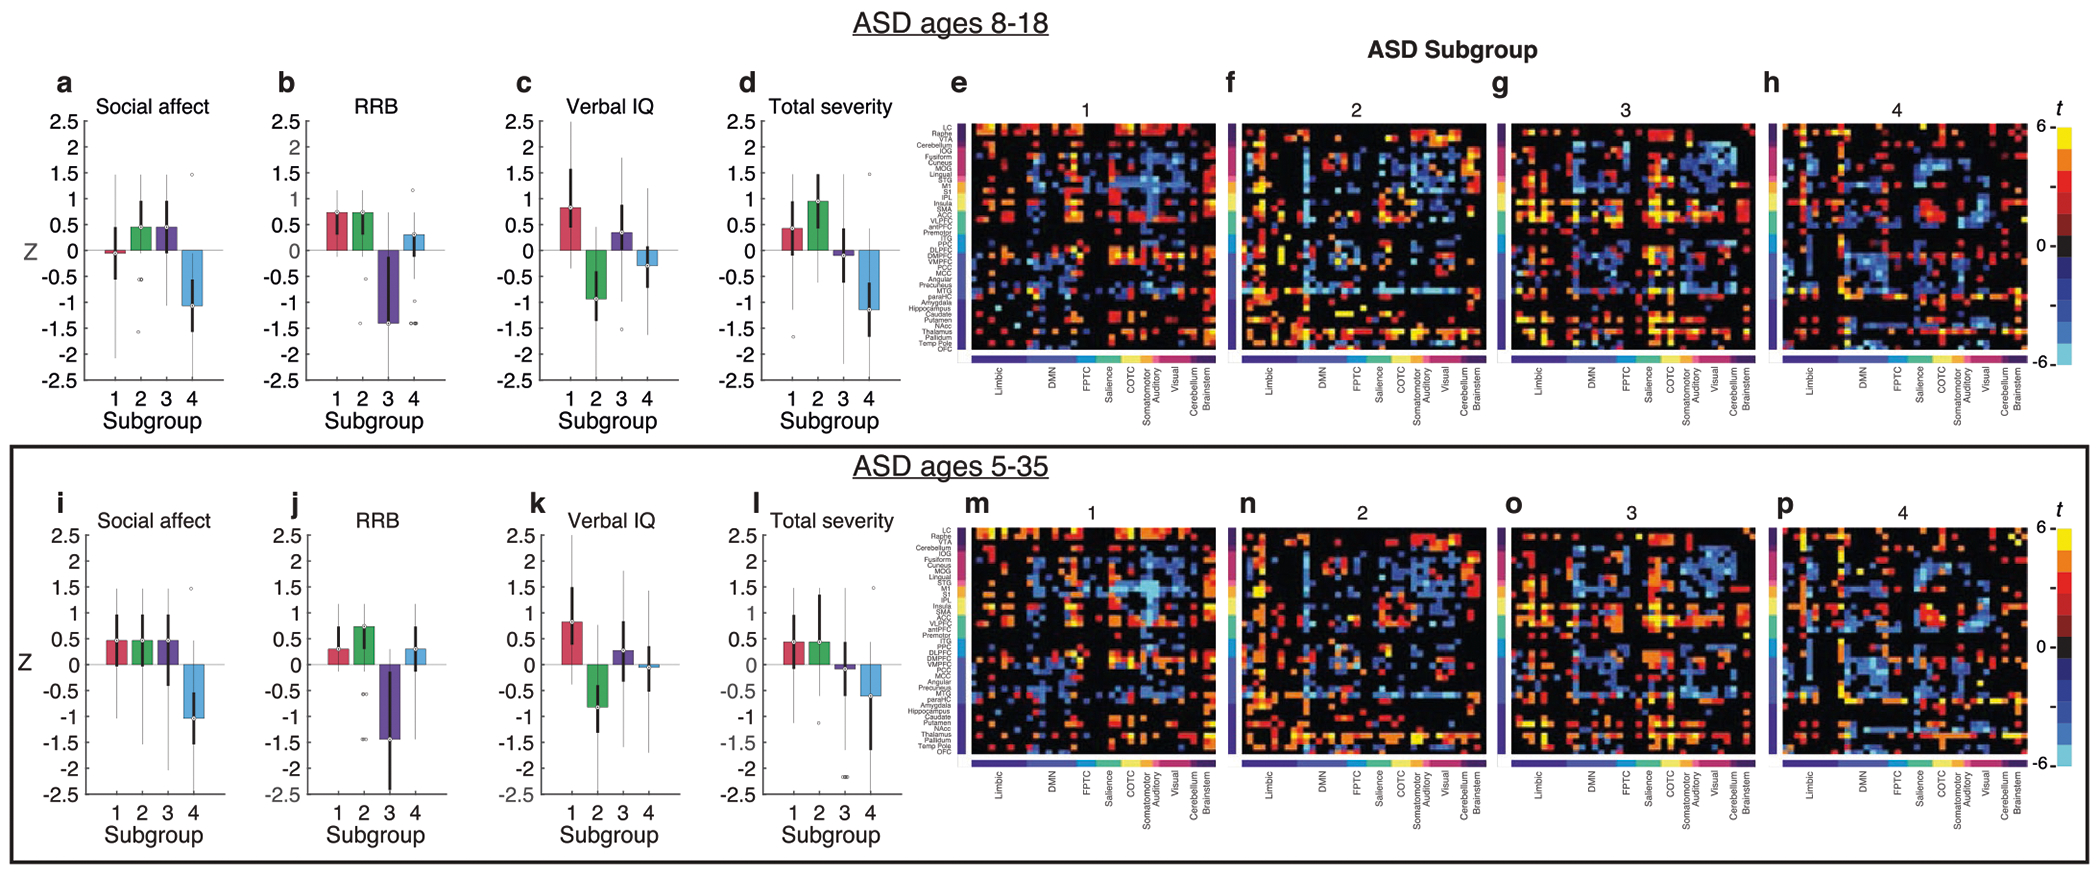
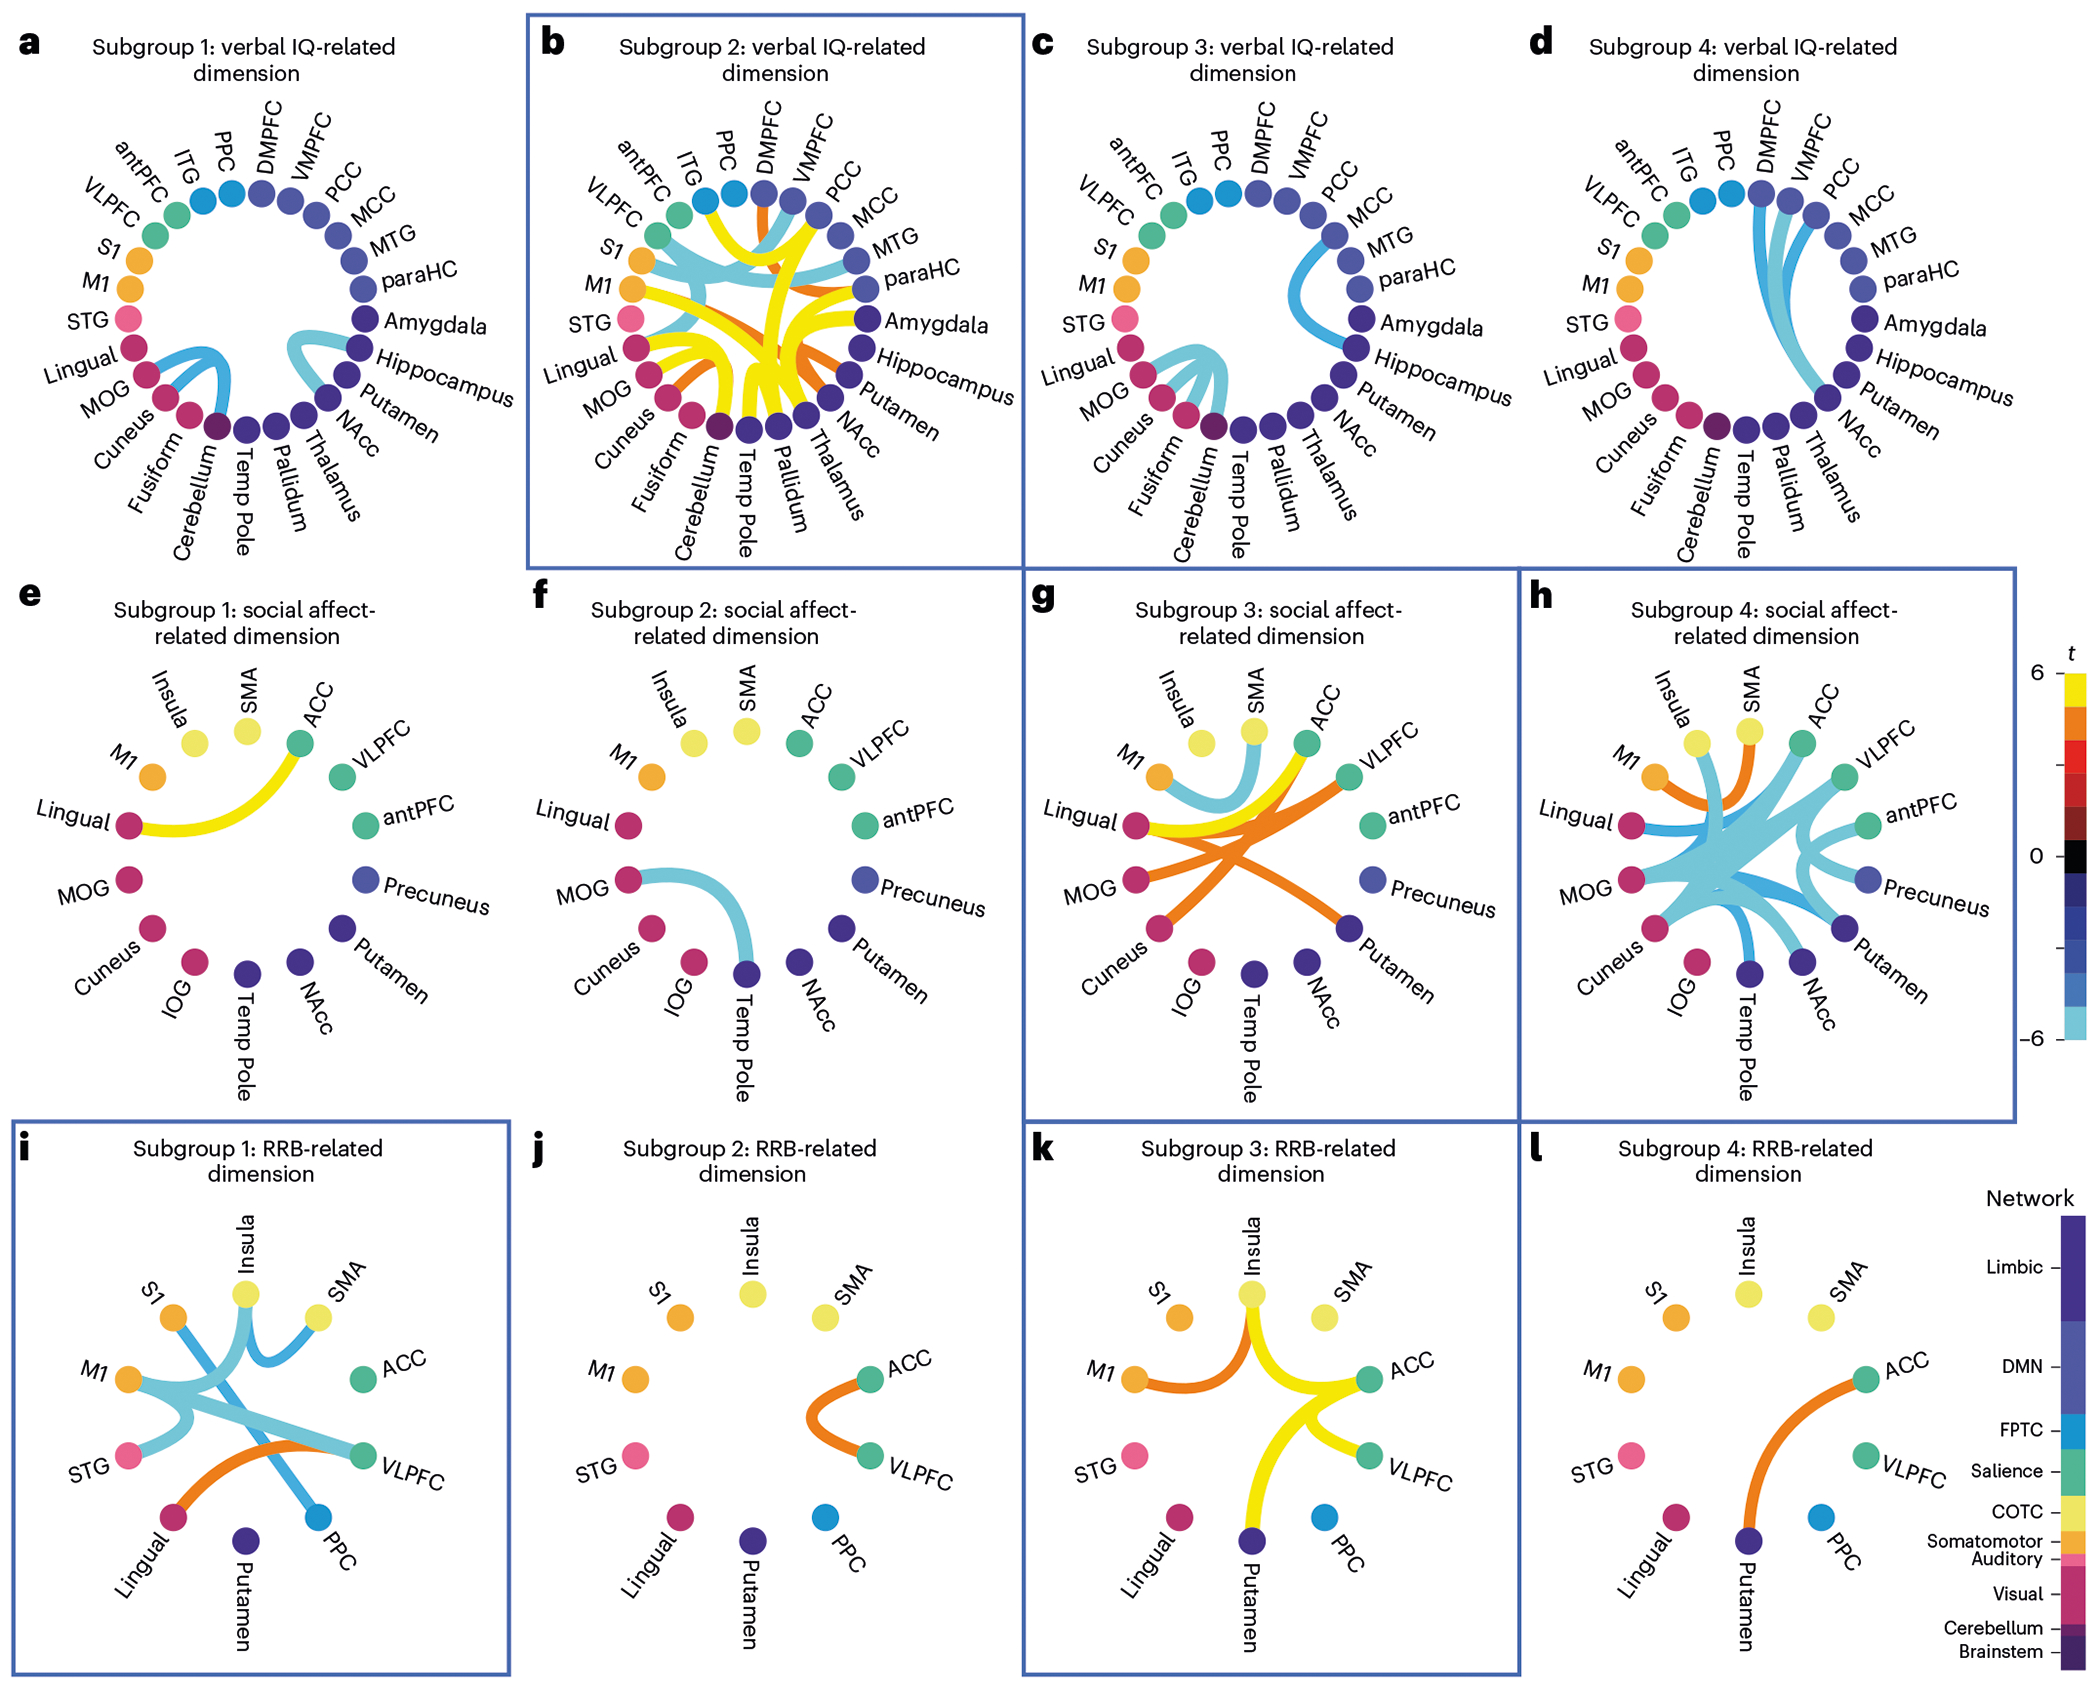
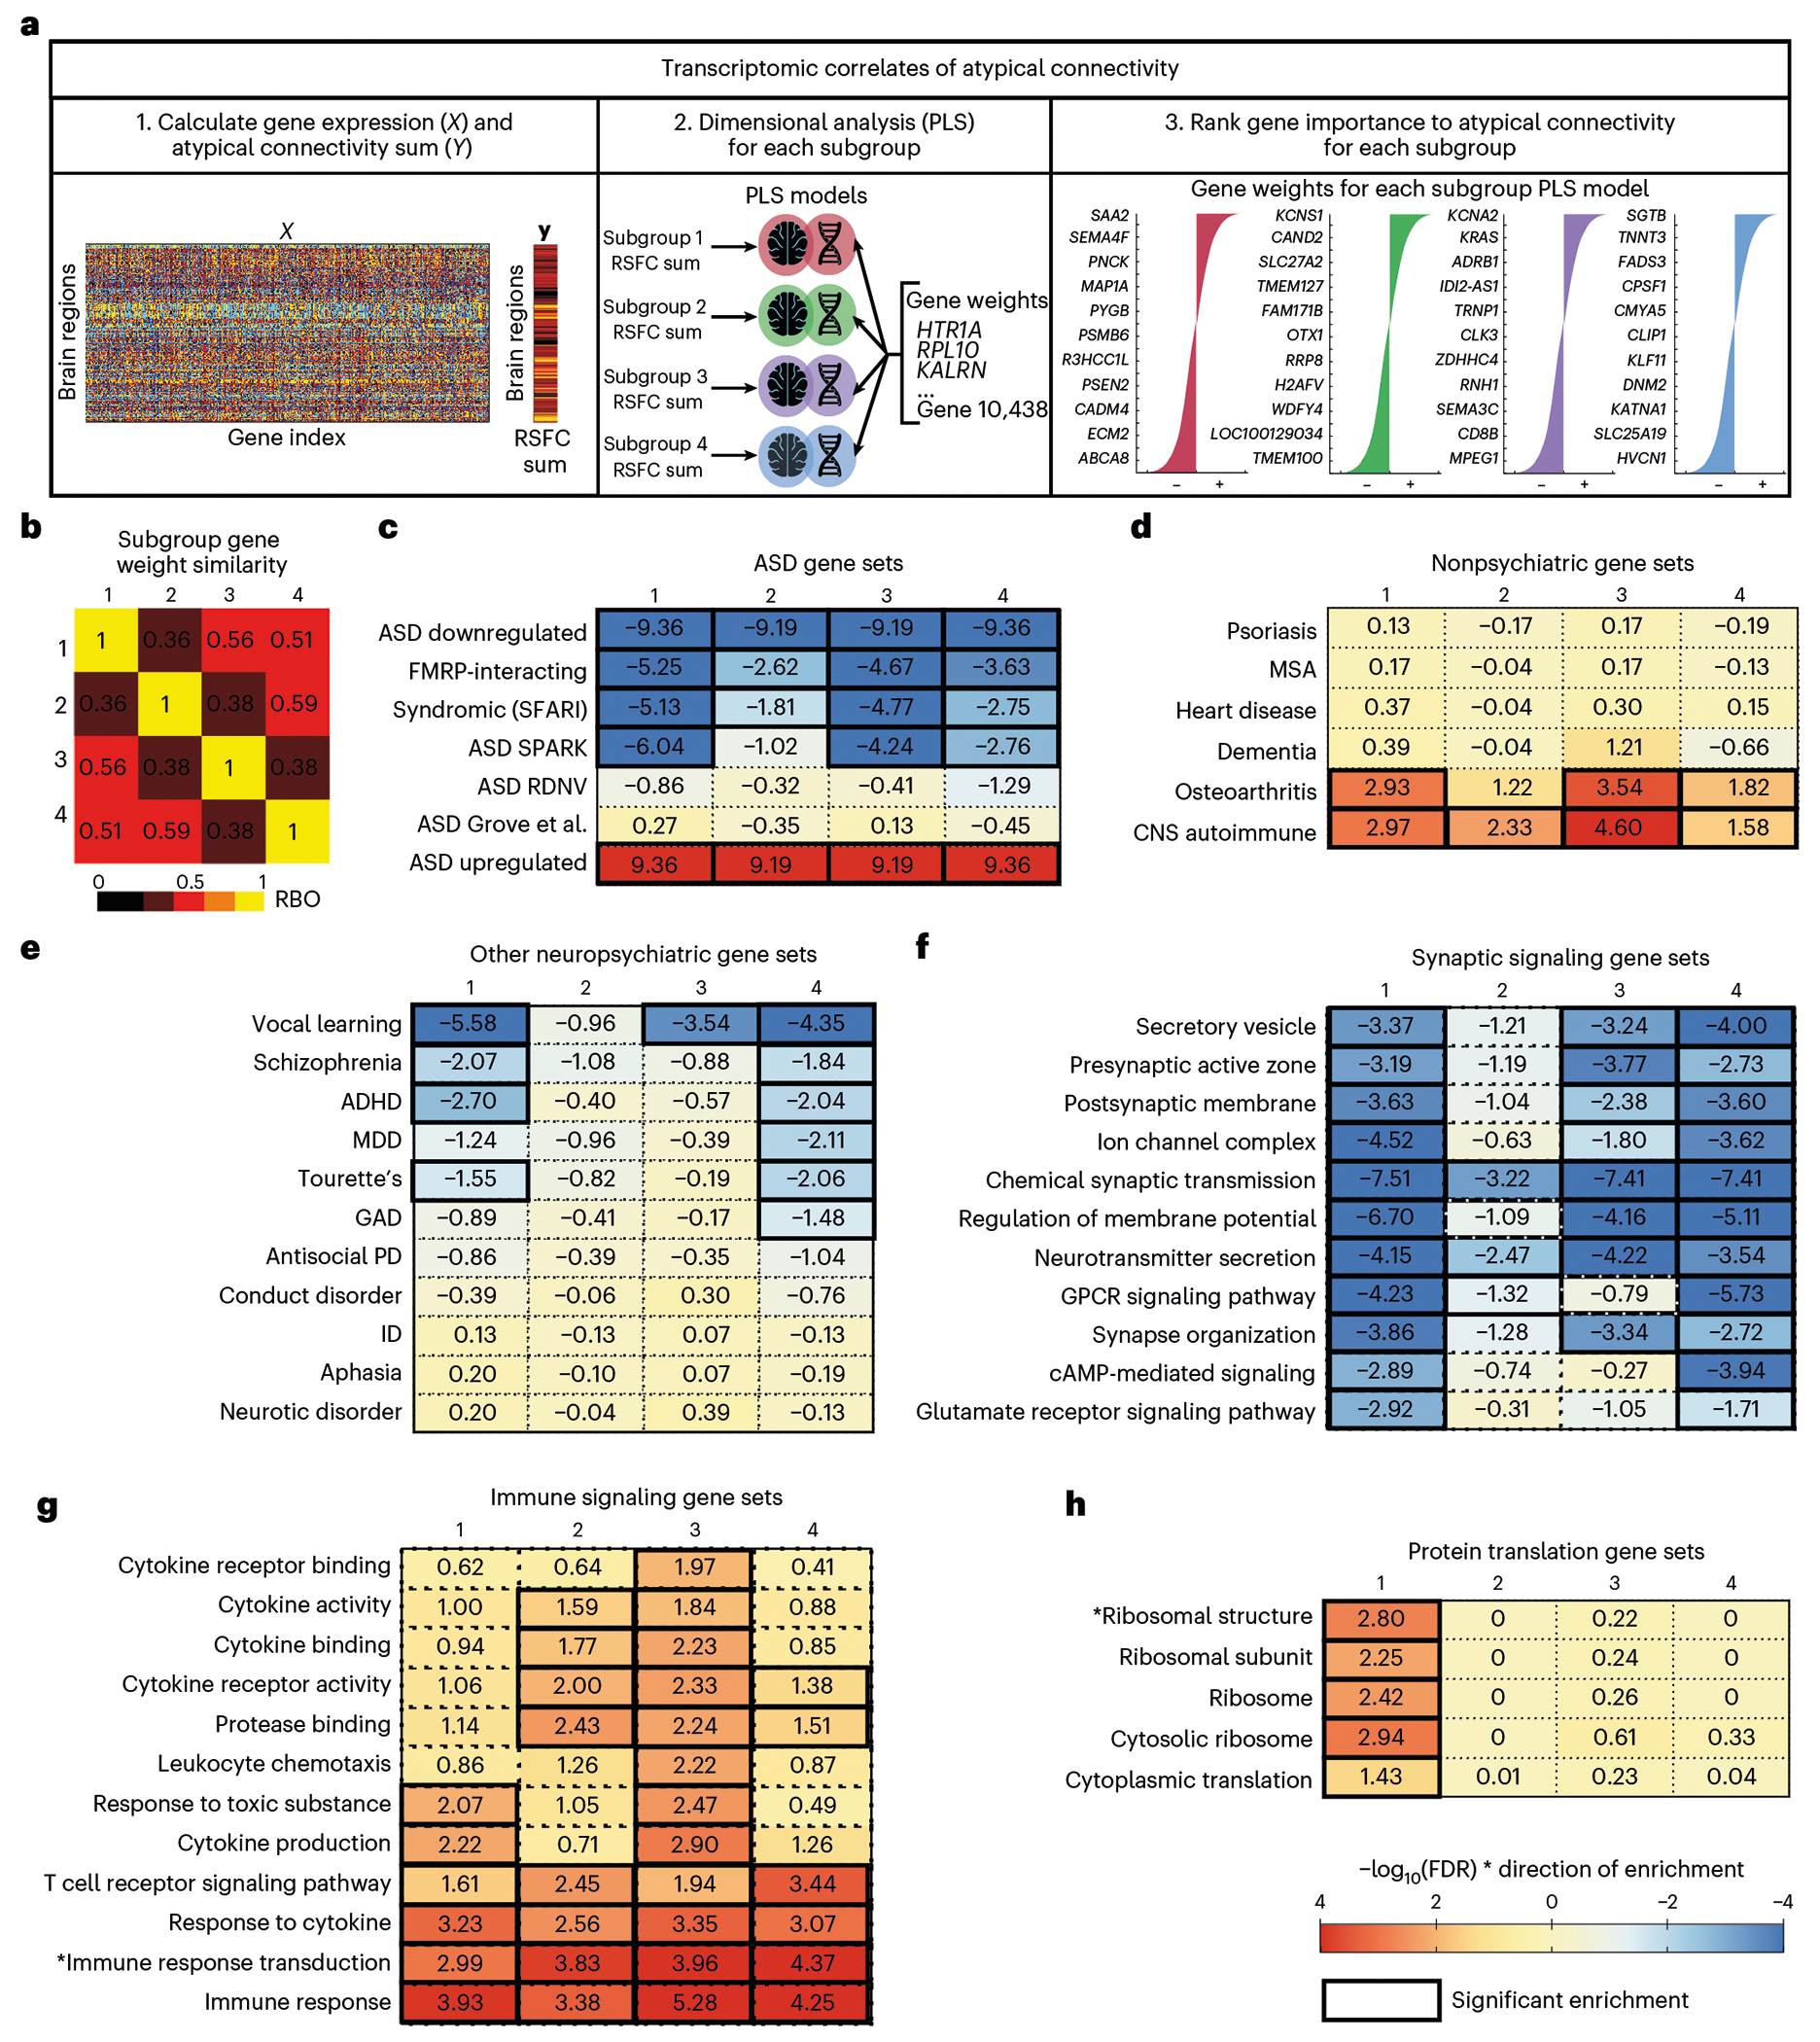
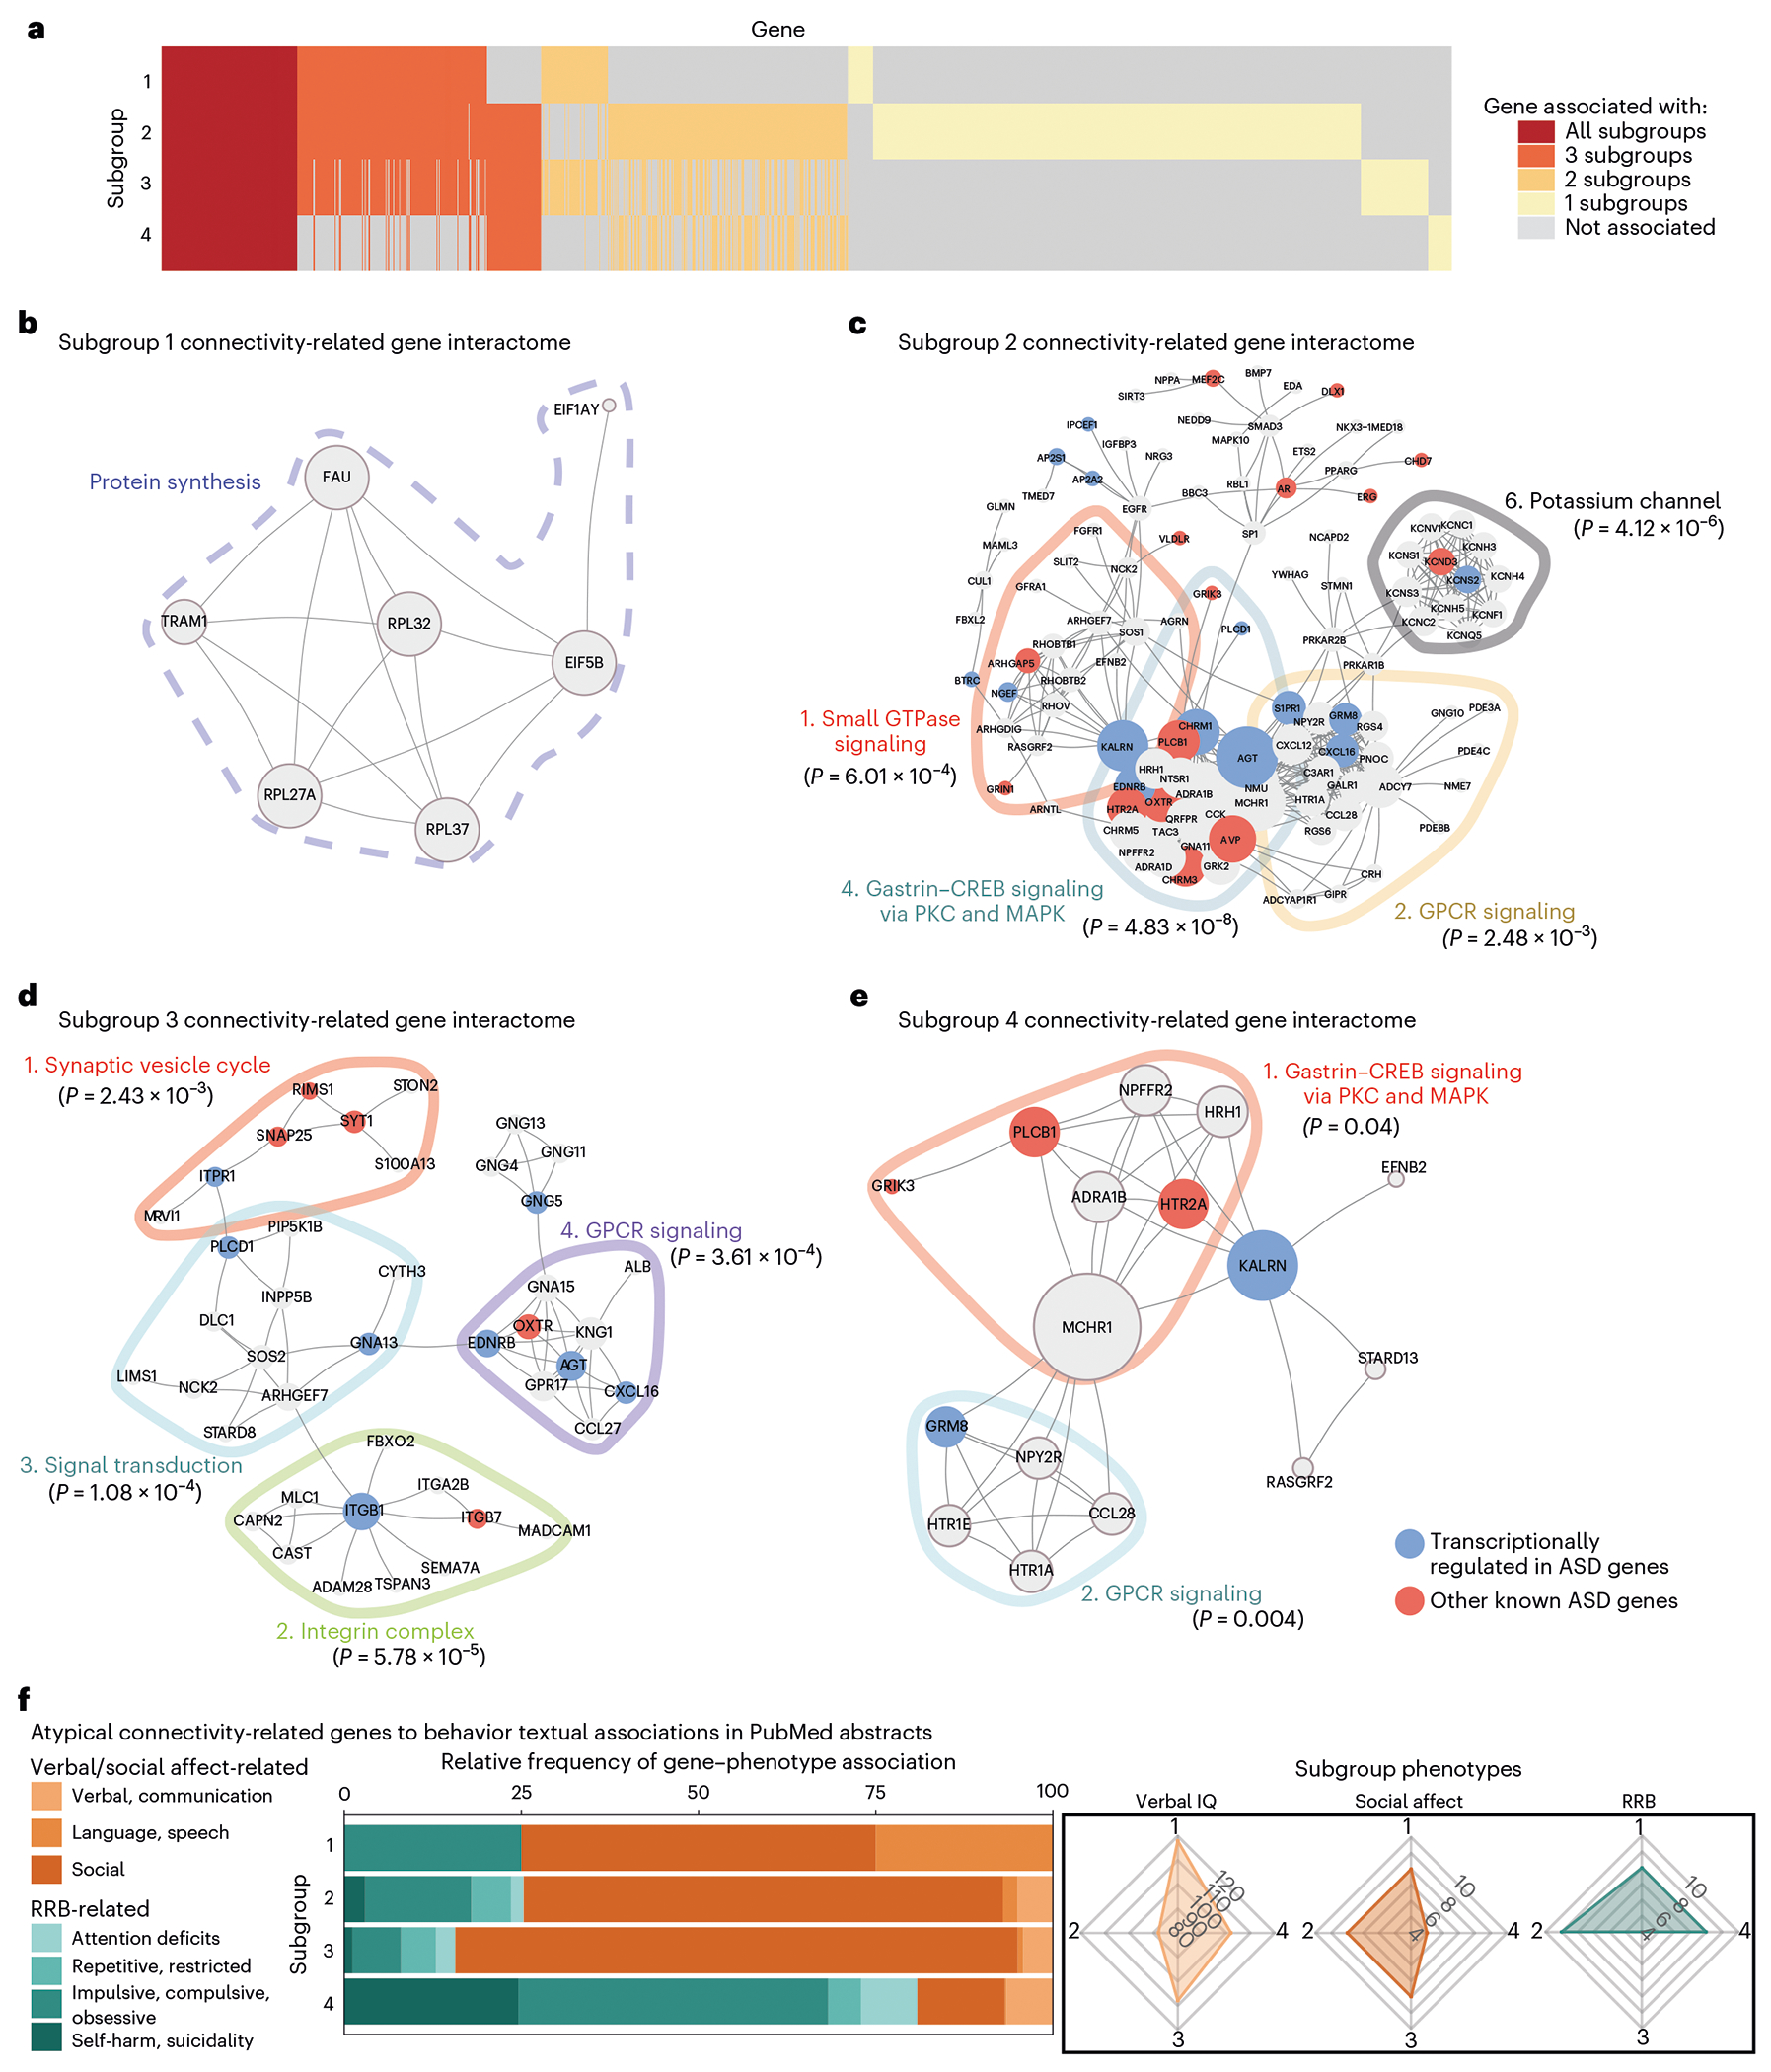
The mechanisms underlying phenotypic heterogeneity in autism spectrum disorder (ASD) are not well understood. Using a large neuroimaging dataset, we identified three latent dimensions of functional brain network connectivity that predicted individual differences in ASD behaviors and were stable in cross-validation. Clustering along these three dimensions revealed four reproducible ASD subgroups with distinct functional connectivity alterations in ASD-related networks and clinical symptom profiles that were reproducible in an independent sample. By integrating neuroimaging data with normative gene expression data from two independent transcriptomic atlases, we found that within each subgroup, ASD-related functional connectivity was explained by regional differences in the expression of distinct ASD-related gene sets. These gene sets were differentially associated with distinct molecular signaling pathways involving immune and synapse function, G-protein-coupled receptor signaling, protein synthesis and other processes. Collectively, our findings delineate atypical connectivity patterns underlying different forms of ASD that implicate distinct molecular signaling mechanisms.


Conflict of interest statement

Competing interests

C.L. is listed as an inventor for Cornell University patent applications on neuroimaging biomarkers for depression that are pending or in preparation. C.L. has served as a scientific advisor or consultant to Compass Pathways, Delix Therapeutics, Magnus Medical and Brainify. AI. The authors declare no other competing interests.

Figures

Extended Data Fig. 1 |
Extended Data Fig. 1 |. Connectivity score loadings on RSFC and atypical RSFC in 247 × 247 heatmaps.
Heatmaps of 247 × 247 regions of interest (ROIs) corresponding to panels in Fig. 2 sorted and labeled by functional network. (a) Correlation between verbal IQ-related dimension (dimension 1) and RSFC (FDR < 0.05; see Fig. 2a). (b) Correlation between social affect-related dimension (dimension 2) and RSFC (FDR < 0.05; see Fig. 2b). (c) Correlation between RRB-related dimension (dimension 3) and RSFC (FDR < 0.05; see Fig. 2c). (d) Atypical connectivity in ASD subjects versus controls (Welch’s t-test; FDR < 0.05; see Fig. 2d). Abbreviations described previously in Figs. 1–2.
Extended Data Fig. 2 |
Extended Data Fig. 2 |. Autism spectrum disorder subgroups replicate when using different clustering methods.
(a, b) K-means clustering with cosine distance, (c, d) spectral clustering with cosine distance, and (e, f) hierarchical clustering with Euclidean distance and Ward linkage across 1,000 training set replicates (N = 284). In (g, h) we show the original analysis using hierarchical clustering with cosine distance and average linkage (see Methods for more details). Boxplots show distribution of clinical symptom z-scores (superimposed bar graphs depict the median) for social affect, repetitive, restrictive behaviors and interests (RRB), verbal IQ, and total severity (color indicates subgroup). Plots include 284 subjects x 1,000 training sets to indicate distribution of clinical behaviors across all 1,000 training set cluster assignments. Box bounds: [25th,75th percentile]; center: median; whiskers: 99.3% data in + /−2.7 σ; outliers: circles). Heatmaps show patterns of mean atypical connectivity across replicates in each subgroup across brain regions (rows) and functional networks (columns), and were thresholded for significant atypical connectivity (two-sided Welch’s t-test, mean FDR < 0.05), evaluated relative to N = 907 neurotypical controls. See additional comparisons in Supplementary Fig. 9.
Extended Data Fig. 3 |
Extended Data Fig. 3 |. Functional connectivity differences reveal subgroup-specific atypical connectivity.
Subgroups were defined as the modal subgroup assignment over the 1,000 training set replicates, which is used in the main text for Figs. 3–6. (a-d) Heatmaps show patterns of atypical connectivity in each subgroup across brain regions (rows) and functional networks (columns). Thresholded for significant atypical connectivity (two-sided Welch’s t-test, FDR < 0.05), evaluated in N = 69 ASD subjects in subgroup 1, N = 87 ASD subjects in subgroup 2, N = 67 ASD subjects in subgroup 3, N = 76 ASD subjects in subgroup 4, relative to N = 907 neurotypical controls.
Extended Data Fig. 4 |
Extended Data Fig. 4 |. Cross-validation of the clinical symptom and atypical connectivity differences between subgroups.
To cross-validate the clinical symptom and atypical connectivity differences between subgroups in Figs. 3–4 and Extended Data Fig. 3, we first subsampled 95% of the data in 1,000 replicates. Second, we calculated canonical variates (connectivity score and clinical score for each brain–behavior dimension) in each replicate. Third, in each replicate, we hierarchically clustered on connectivity scores using cosine similarity distance and average linkage and identified four subgroups. Fourth, we used the Hungarian method to match clusters between replicates (numerical assignment of subgroups can change without changing subject composition in cluster). Fifth, we calculated the distribution of clinical symptom z-scores for each subgroup across replicates. Sixth, in each replicate, we calculated atypical connectivity per subgroup versus N = 907 neurotypical controls (two-sided Welch’s t-test). Seventh, we calculated the mean and standard deviation (σ) of atypical connectivity (t) on RSFC over 1,000 subsampled replicates. (a-d) Note similarity to Fig. 3b–e: Subgroups differ with respect to clinical symptoms, similar to subgroup differences identified when subgroups were calculated as modal cluster assignment across 1,000 training sets (mode analysis) shown in Fig. 3b–e. Plots include 284 subjects x 1,000 training sets to indicate distribution of clinical behaviors across all 1,000 training set cluster assignments. Box bounds: [25th,75th percentile]; center: median; whiskers: 99.3% data in + /−2.7 σ; outliers: circles). (e-h) Heatmaps show patterns of mean atypical connectivity across replicates in each subgroup across brain regions (rows) and functional networks (columns), and were thresholded for significant atypical connectivity (two-sided Welch’s t-test, mean FDR <0.05). (i-l) Heatmaps show patterns of the standard deviation of atypical connectivity across replicates in each subgroup across brain regions (rows) and functional networks (columns).
Extended Data Fig. 5 |
Extended Data Fig. 5 |. RCCA and clustering analysis using narrower age range (ages 8–18) yields ASD subgroups with clinical symptoms and atypical connectivity consistent with main analysis.
We repeated all the main analyses (shown in box, (i-p) using a smaller age range, including only ASD and neurotypical individuals of ages 8–18 (shown in a-d and i-l). This reduced our ASD sample from N = 299 ages 5–35 to N = 243 ages 8–18 and reduced our neurotypical sample from N = 907 to N = 573. In this secondary analysis, we found similar clinical symptom profiles associated with each subgroup (a-d vs. i-l). Boxplots of the distribution of clinical symptom z-scores (superimposed bar graphs depict the median) for (a,e) social affect, (b,f) repetitive, restrictive behaviors and interests (RRB), (c,g) verbal IQ, and (d,h) total severity (color indicates subgroup). Note that higher social affect, RRB, and total severity scores and lower verbal IQ indicate greater impairment. Box bounds: [25th,75th percentile]; center: median; whiskers: 99.3% data in + /−2.7 σ; outliers: circles). Next, we found similar atypical connectivity associated with each subtype (e-h vs. m-p). (e-h) Atypical connections that were significant (P < 0.05) in the narrower age range, thresholded for significant atypical connectivity (two-sided Welch’s t-test, FDR < 0.05). (m-p) Atypical connections that were significant (P < 0.05) in the full age range, thresholded for connections that were significant in the main analysis (two-sided Welch’s t-test, FDR < 0.05). Heatmaps show patterns of atypical connectivity in each subgroup across brain regions (rows) and functional networks (columns). Thresholded for significant atypical connectivity (two-sided Welch’s t-test, FDR < 0.05), evaluated relative to N = 907 neurotypical controls. For additional results, see Supplementary Figs. 13, 14 and 17–20.
Extended Data Fig. 6 |
Extended Data Fig. 6 |. RCCA and clustering analysis using the Craddock 200 atlas yields ASD subgroups with clinical symptoms and atypical connectivity consistent when analyzed using the Power atlas.
We reparcellated the brains using the Craddock 200 atlas, recalculated functional connectivity for each subject, and repeated the full analysis following the original pipeline (feature selection, RCCA, clustering, and PLS). Key findings from the primary analysis using the Power parcellation replicate in this secondary analysis using the Craddock atlas. Here we plot the clinical symptom scores (boxplots as in Extended Data Fig. 5) for each subgroup when (a-d) we used the Craddock 200 parcellation for functional connectivity versus (i-l) the Power parcellation for functional connectivity (main text analysis). Next, we measured atypical connectivity using the Craddock parcellation and mapped it onto the Power atlas for visual comparison between the two parcellations. We plot the atypical connectivity for each subgroup for (e-h) the analysis in the Craddock 200 parcellation thresholded the significant connections from the Power parcellation, and (m-p) the analysis in the Power atlas. Heatmaps show patterns of atypical connectivity in each subgroup across brain regions (rows) and functional networks (columns). Thresholded for significant atypical connectivity (two-sided Welch’s t-test, FDR < 0.05), each evaluated separately relative to N = 907 neurotypical controls. For additional results, see Supplementary Figs. 15, 16.
Extended Data Fig. 7 |
Extended Data Fig. 7 |. Out-of-sample replication of ASD subgroup clinical symptoms and atypical connectivity in NDA dataset (NNDA = 85 ASD subjects).
We repeated the main analyses to define ASD subgroups using the NDA dataset (RCCA and clustering). This analysis replicated key results from ABIDE, such that the four NDA subgroups (NNDA_1 = 20, NNDA_2 = 21; NNDA_3 = 27; NNDA_4 = 17) exhibited clinical symptom / behavior profiles and atypical connectivity patterns that were highly similar to those observed in the ABIDE subgroups (NABIDE_4 = 69, NABIDE_2 = 87; NABIDE_3 = 67; NABIDE_4 = 76). In this summary figure, we plot the clinical symptom scores (NDA: a-d, ABIDE: i-l; boxplots as in Extended Data Fig. 5) and atypical connectivity patterns for each subgroup (NDA: e-h, ABIDE: m-p). As expected, statistical power to detect significant atypical connectivity was reduced due to the smaller sample size of NDA. Here, the heatmaps show atypical functional connectivity in NDA and ABIDE subgroups, with the NDA subgroups thresholded by significance from ABIDE for comparison (that is, we set elements in the NDA heatmaps with FDR < 0.05 from a connectivity (two-sided Welch’s t-test in ABIDE heatmaps to 0). However, we confirmed that compared to an empirical null (100 shuffles, see Methods for details), atypical connectivity patterns in the NDA ASD subgroups were more correlated with ABIDE ASD subgroups than expected by chance (P1 = 0.0099, P2 = 0.0297, P3 = 0.0099, P4 = 0.0198). Note that the P values correspond to the probability of obtaining the observed sum of ranks statistic (sum of observed ranks across a range of FDR thresholds, FDR in {1, 0.05, 0.01, 0.005, 0.001, 0.0005, 0.0001, 0.00005}) under the empirical null. For additional results, see Supplementary Fig. 21.
Extended Data Fig. 8 |
Extended Data Fig. 8 |. Replication of transcriptomic correlates of subgroup atypical connectivity using BrainSpan gene expression.
We mapped data from the BrainSpan gene expression atlas to the Power atlas, and repeated the PLS and gene set enrichment analyses described in the main text. We found similar results to the original analysis in which we had used the AHBA gene expression dataset, including highly similar transcriptomic correlates of subgroup atypical connectivity. For the PLS analysis, we first calculated gene expression at each brain region (ROI) and atypical connectivity (RSFC) summed over ROIs for each subgroup. Second, we performed PLS regression for each subgroup. Third, we ranked genes by PLS gene weights in each model. The results were highly similar to those observed in the original analysis using the AHBA gene expression atlas. Heatmaps of gene set enrichment for each subgroup’s ranked gene weights for (a vs. b) ASD-related gene sets, (c vs. d) nonpsychiatric disease-related gene sets, (e vs. f) psychiatric disorder-related gene sets, (g vs. h) synaptic signaling gene sets, (i vs. j) immune signaling gene sets, and (k vs. l) protein translation gene sets. All subgroups were enriched for ASD-related gene sets, but not for unrelated diseases. Color indicates strength of negative log transformed FDR for normalized enrichment score multiplied by sign of gene weight (+1 or −1). The P values were calculated and FDR-corrected as in Fig. 5.
Extended Data Fig. 9 |
Extended Data Fig. 9 |. Transcriptomic correlates of atypical connectivity patterns associated with ASD-related behaviors.
To further assess relationships between gene expression with atypical connectivity and behavior in larger useable samples (that is, now including subjects with usable fMRI data who were excluded from primary analyses due to incomplete behavioral assessments) we started with the N = 782 subjects with usable scan data, and split the NVIQ = 590 subjects with VIQ into VIQ bins (ASD subjects with [NVIQ>120 = 127] VIQ > = 120, [N85≤VIQ≤120 = 383] VIQ 85–120, or [NVIQ<85 = 80] VIQ < = 85). We also split the NADOS-2 = 353 subjects with ADOS-2 assessment into bins by calculating social affect divided by RRB. The social affect > RRB bin (social affect / RRB > 1) had NSA>RRB = 113 ASD subjects and the RRB > social affect bin (social affect / RRB >1) had NSA<RRB = 171 ASD subjects; the NSA=RRB = 69 ASD subjects with SA/RRB = 1 were not included in either ADOS-2 bin. The overlap of subjects between the NVIQ = 590 subjects with VIQ and NADOS-2 = 353 subjects with ADOS-2 was the NVIQ;ADOS-2 = 299 ASD subjects in the main analysis. We used the same PLS and gene set enrichment procedure as in Fig. 5 (see b,d,f,h,j,l in box) to assess the relationship of these binned subjects’ atypical connectivity with gene expression. Heatmaps of gene set enrichment for each subgroup’s ranked gene weights for (a-b) ASD-related gene sets, (c-d) nonpsychiatric disease-related gene sets, (e-f) psychiatric disorder-related gene sets, (g-h) synaptic signaling gene sets, (i-j) immune signaling gene sets, and (k-l) protein translation gene sets. Color indicates strength of negative log transformed FDR for normalized enrichment score multiplied by sign of gene weight (+1 or −1). The results were consistent with our predictions: gene set enrichments for the low-VIQ bin resembled those for subgroup 2 (featured low Verbal IQ) and enrichments for the high-VIQ bin resembled those for subgroup 1 (featured above-average VIQ). See further description of results in Supplementary Discussion. The P values were calculated and FDR-corrected as in Fig. 5.
Extended Data Fig. 10 |
Extended Data Fig. 10 |. Zero-order protein-protein interaction (PPI) networks for genes associated with multiple subgroups.
Zero-order protein-protein interaction (PPI) networks for (a) genes associated with all four subgroups and (b) genes associated with at least 3 subgroups (STRING database; see Methods). Blue genes are known to be transcriptionally regulated in ASD while red genes are genes not known to be transcriptionally regulated but that have been associated with ASD in the SFARI database. The significance of each PPI module is the two-sample Wilcoxon rank sum test (unpaired, two-sided) of within-module degrees versus cross-module degrees (no adjustments for multiple comparisons of modules). For each gene in the module, the within-module degree is the number of connected genes within the module and the cross-module degree is the number of connected genes outside of the module.
Fig. 1 |
Fig. 1 |. Three brain–behavior dimensions explain individual differences in autism spectrum disorder.
a, Schematic summarizing stabilized feature selection and RCCA in N = 299 ASD participants and N = 907 neurotypical controls. b, Glass brain (left) depicting functional parcellation spanning the cerebrum, brainstem and cerebellum (colored by functional network). BOLD signal time series extracted from three representative ROIs (middle) and correlation between each ROI and every other ROI (functional connectivity matrix, right) for each participant. c, Glass brain depicting the neuroanatomical distribution of functional connectivity features that were correlated with one or more ASD behaviors, identified in one representative training set (colored by functional network, sized by correlation). d–f, RCCA revealed three dimensions predicting individual differences in verbal IQ (d), social affect (e), and RRB (f) symptoms. Scatterplots depict the association between connectivity scores and behavior scores for each RCCA dimension across participants. Mean scores calculated on held-out data are light, while the average scores calculated on the training set data are dark. Heat maps (left) depict the mean correlation over training sets between each dimension’s behavior scores and each clinical symptom (Fisher z-transformed Spearman correlation coefficients). The canonical correlations (r) for all three dimensions were statistically significant in held-out data (inset also shows Cohen’s d) compared to an empirical null distribution (shuffled held-out test set data; 1,000 shuffles in each of the 1,000 training/test sets). (variate 1: r = 0.269, P <0.0001, d = 1.119; variate 2: r = 0.180, P = 0.0005, d = 0.771; and variate 3: r = 0.115, P = 0.0185, d = 0.484; r indicates mean test set canonical correlation, P indicates P value, and d indicates Cohen’s d). a.u., arbitrary units; BOLD, blood-oxygen-level-dependent; CBL, cerebellum; Cd, caudate; COTC, cerebellar-occipital task control; DMN, default mode network; FPTC, frontoparietal task control; M1, primary motor cortex; MOG, medial orbital gyrus; MTG, middle temporal gyrus; PFC, prefrontal cortex; PPC, posterior parietal cortex; r, canonical correlation; RCCA, regularized canonical correlation; S1, primary somatosensory cortex; SA, social affect.
Fig. 2 |
Fig. 2 |. Functional connectivity correlates of autism spectrum disorder symptoms.
a, Mean correlation between RSFC features and behavior scores for verbal IQ-related dimension (on cross-validation (CV) training folds). Heat map (left) labeled by brain region (x axis) and RSFC network (y axis), showing a subset of RSFC features with strong loadings for dimension (maximum RSFC-to-dimension correlation; FDR < 0.05; 247 ROIs mapped to 37 brain regions, collapsed over hemispheres). Chord plot (middle) depicts connectivity score correlations for the most important RSFC features (>1 connection with FDR < 0.001). Glass brain (right) depicts neuroanatomical distribution of RSFC features in chord plot. b, Mean correlation between RSFC features and behavior scores for social affect-related dimension (on CV training folds). c, Mean correlation between RSFC features and behavior scores for RRB-related dimension (on CV training folds). d, Heat map of atypical connectivity in N = 299 individuals with ASD compared to N = 907 neurotypical controls (two-sided Welch’s t-test; FDR < 0.001), showing maximum atypical connectivity statistic between ROIs within each of the 37 brain region groups. See Extended Data Fig. 1 for whole-brain (247 × 247 ROIs) results. e, Venn diagram indicating the number of RSFC features (of 247 × 247) correlated with dimensions in a–c but not atypical (yellow; nRSFC = 1,137; FDR < 0.05) and number of RSFC features not correlated with any dimension but atypical (green; nRSFC = 4,257; FDR < 0.05). Only 13.4% of symptom-predictive RSFC features (overlap; nRSFC = 176 of 1,313; FDR < 0.05) were also atypical. f, Venn diagram indicating number of RSFC features (of 247 × 247) significantly (FDR < 0.05) correlated with each dimension. Each RSFC dimension score was associated with a mostly unique set of RSFC features. ACC, anterior cingulate cortex; antPFC, anterior prefrontal cortex; DLPFC, dorsolateral prefrontal cortex; IOG, inferior orbital gyrus; IPL, inferior parietal lobe; ITG, inferior temporal gyrus; MCC, medial cingulate cortex; NAcc, nucleus accumbens; OFC, orbital frontal cortex; paraHC, parahippocampus; PCC, posterior cingulate cortex; SM, somatomotor; SMA, supplementary motor area; STG, superior temporal gyrus; Temp Pole, temporal pole; VLPFC, ventrolateral prefrontal cortex; VMPFC, ventromedial prefrontal cortex.
Fig. 3 |
Fig. 3 |. Hierarchical clustering on brain–behavior dimension scores reveals four autism spectrum disorder subgroups.
a, Heat map and dendrogram depict hierarchical clustering on all 299 ASD individuals (rows) along three dimensions (columns) using cosine similarity (dendrogram) between connectivity scores of ASD participant pairs (heat map; dashed line indicates 80% of maximum cosine distance). b–e, Box plots of the distribution of clinical symptom z-scores (superimposed bar graphs depict the median) for social affect (SA) (b), RRB (c), verbal IQ (VIQ) (d) and total severity (e; N = 69, N = 87, N = 67 and N = 76 ASD participants for subgroups 1–4, respectively; color indicates subgroup). All four measures–social affect, RRB, verbal IQ and total severity–differed by subgroup (Kruskal–Wallis test between subgroups showed significant between-subgroup differences for each symptom: social affect, X2 (3, N = 299) = 115.86, P = 6.02 × 10⁻²⁵; RRB: X2 (3, N = 299) = 124.52, P = 8.18 × 10⁻²⁷; VIQ: X2 (3, N = 299) = 138.28, P = 8.88 × 10⁻³⁰; total severity: X2 (3, N = 299) = 115.22, P = 8.25 × 10⁻²⁵). Note that higher social affect, RRB and total severity scores and lower verbal IQ indicate greater impairment. f–h, Kernel density estimation plots of participant connectivity scores in two dimensions (lowest iso-proportion level = 0.25). Box plots indicate distributions of subgroup connectivity scores along a single dimension (N = 69, N = 87, N = 67 and N = 76 ASD participants for subgroups 1–4, respectively). For b–h, box bounds indicate the 25th and 75th percentiles; the center line denotes the median; whiskers correspond to ±2.7σ and 99.3% of the data; and outliers are shown as circles. Analyses for b–h use the aggregate clustering assignment described in the main text and Methods.
Fig. 4 |
Fig. 4 |. Autism spectrum disorder subgroups have distinct atypical connectivity patterns in dimension-related RSFC features.
a-l, Chord plots of atypical connectivity (two-sided Welch’s t-test between RSFC of participants with ASD in each subgroup (N = 69, N = 87, N = 67 and N = 76 ASD participants) and N = 907 neurotypical controls; FDR < 0.05) for the most important dimension-related RSFC features identified in Fig. 2a–c. Blue boxes highlight findings discussed in the main text. a–d, Subgroup atypical connectivity in verbal IQ-related RSFC (dimension 1). e–h, Subgroup atypical connectivity in social affect-related RSFC (dimension 2); i–l, Subgroup atypical connectivity in RRB-related RSFC (dimension 3). b, Subgroup 2 had atypical connectivity associated with dimension 1, predicting lower verbal IQ. g, Subgroup 3 had atypical connectivity associated with dimension 2, predicting high social affect symptoms and low RRB symptoms. h, Subgroup 4 had atypical connectivity associated with dimension 2 but in the opposite direction, predicting low social affect symptoms and high RRB symptoms. i, Subgroup 1 had atypical connectivity associated with dimension 3, predicting high RRB symptoms and high verbal IQ. k, Subgroup 3 had atypical connectivity associated with dimension 3 but in the opposite direction, predicting low RRB symptoms. Color bars on the right indicate the direction of atypical connectivity and connection strength (warm indicates increased, while cool indicates decreased relative to neurotypical controls) and functional network (node color). Analyses use the aggregate clustering assignment described in the main text and Methods.
Fig. 5 |
Fig. 5 |. Transcriptomic correlates of atypical connectivity patterns in autism spectrum disorder subgroups.
a, Schematic of transcriptomics analysis to test whether gene expression explains atypical connectivity in each subgroup. First, we calculated gene expression at each brain region (ROI) and atypical connectivity (RSFC) summed over ROIs for each subgroup. Second, we performed PLS regression for each subgroup and estimated the significance of each PLS model using a spatial permutation (‘spin’) test,. The PLS models for all four subgroups were significant (subgroup 1: P = 0.014; subgroup 2: P < 0.001; subgroup 3: P < 0.001; subgroup 4: P < 0.001; all statistics in Supplementary Table 3). Third, we ranked genes by PLS gene weights in each model. b, Heat map of similarity between subgroup gene rank lists (average of RBO for top 1,000 positively ranked genes and RBO for the top 1,000 negatively ranked genes between subgroups). Each subgroup was associated with a distinct set of genes (RBO = 0.36–0.59, 1 is perfect similarity). c–e, Heat maps of gene set enrichment for each subgroup’s ranked gene weights for ASD-related gene sets (c), nonpsychiatric disease-related gene sets (d), psychiatric disorder-related gene sets (e), synaptic signaling gene sets (f), immune signaling gene sets (g) and protein translation gene sets (h). Full GSEA results are in Supplementary Table 4. All subgroups were enriched for ASD-related gene sets, but not for unrelated diseases. Color indicates strength of negative log-transformed FDR for normalized enrichment score multiplied by the sign of the gene weight (+1 or −1). ADHD, attention-deficit/hyperactivity disorder; CNS, central nervous system; GAD, generalized anxiety disorder; GPCR, G-protein-coupled receptor; ID, intellectual disability; MDD, Major depressive disorder; MSA, multiple system atrophy; PD, personality disorder; RDNV, rare de novo variants.
Fig. 6 |
Fig. 6 |. Protein-protein interaction networks reveal distinct connectivity-related genes with textual associations to autism spectrum disorder-related behaviors.
a, Heat map of overlap between genes (y axis) significantly associated with each subgroup’s atypical connectivity (P < 0.01; Methods). Some genes were significantly associated with all four subgroups (red), while others were associated with just one, two or three subgroups (yellow, pale orange or orange). b–e, Zero-order PPI networks for genes associated with each subgroup and no more than one other subgroup (STRING database; Methods). b, Subgroup 1’s interactome was associated with protein synthesis-related genes (dashed line around genes). c–e, Subgroups 2–4 had multiple significant functional modules as determined by the Walktrap algorithm (Supplementary Table 5), delineated by colored lines around each module, and implicating G-protein-coupled receptor signaling (subgroups 2–4), transforming growth factor-beta (TGF-β) signaling (subgroup 2), synapse function and signal transduction (subgroup 3) and gastrin–CREB signaling (subgroup 4), among others. The significance of each PPI module is the two-sample Wilcoxon rank-sum test (unpaired, two-sided) of within-module degrees versus cross-module degrees (no adjustments for multiple comparisons of modules). For each gene in the module, the within-module degree is the number of connected genes within the module and the cross-module degree is the number of connected genes outside the module. f, Nested bar graph of relative frequency (for each subgroup, number of keyword-associated abstracts divided by total number of abstracts) of PubMed abstract associations between subgroup-specific hub genes (up to ten top-connected genes in subgroup PPI) and behavioral keywords. Radar charts (right) show relative distribution of clinical symptom severity between subgroups (Fig. 3b–e). Subgroup 4 (severe RRB, mild social affect) connectivity-associated hub genes were most strongly associated with RRB-related keywords (RRB-related terms for S4 = 80.85%). Subgroups 1–3 showed the opposite relationship (social affect-related terms are S1 = 75.00%, S2 = 74.71% and S3 = 84.35%). Keywords are defined in Supplementary Table 6. In g, “immune response transduction’ abbreviates the ‘immune response-activating signal transduction’ gene set and in h, ‘*ribosomal structure’ abbreviates the ‘structural constituent of ribosome’ gene set.

References

    1. Lombardo MV, Lai M-C & Baron-Cohen S Big data approaches to decomposing heterogeneity across the autism spectrum. Mol. Psychiatry 24, 1435–1450 (2019). - PMC - PubMed
    1. Insel T. et al. Research domain criteria (RDoC): toward a new classification framework for research on mental disorders. Am. J. Psychiatry 167, 748–751 (2010). - PubMed
    1. Jeste SS & Geschwind DH Disentangling the heterogeneity of autism spectrum disorder through genetic findings. Nat. Rev. Neurol 10, 74–81 (2014). - PMC - PubMed
    1. Lord C, Elsabbagh M, Baird G & Veenstra-Vanderweele J Autism spectrum disorder. Lancet 392, 508–520 (2018). - PMC - PubMed
    1. Kana RK, Keller TA, Cherkassky VL, Minshew NJ & Just MA Sentence comprehension in autism: thinking in pictures with decreased functional connectivity. Brain 129, 2484–2493 (2006). - PMC - PubMed

Publication types