. 2023 Mar 10;23(1):226.
doi: 10.1186/s12885-023-10678-9.

A novel cuproptosis-related gene model predicts outcomes and treatment responses in pancreatic adenocarcinoma

Affiliations

A novel cuproptosis-related gene model predicts outcomes and treatment responses in pancreatic adenocarcinoma

Qixian Liu et al. BMC Cancer. .

Abstract

Background: Cuproptosis is recently emerging as a hot spot in cancer research. However, its role in pancreatic adenocarcinoma (PAAD) has not yet been clarified. This study aimed to explore the prognostic and therapeutic implications of cuproptosis-related genes in PAAD.

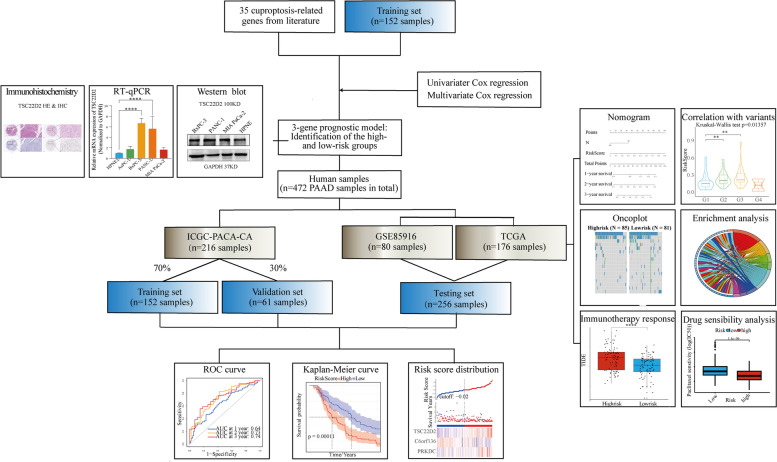
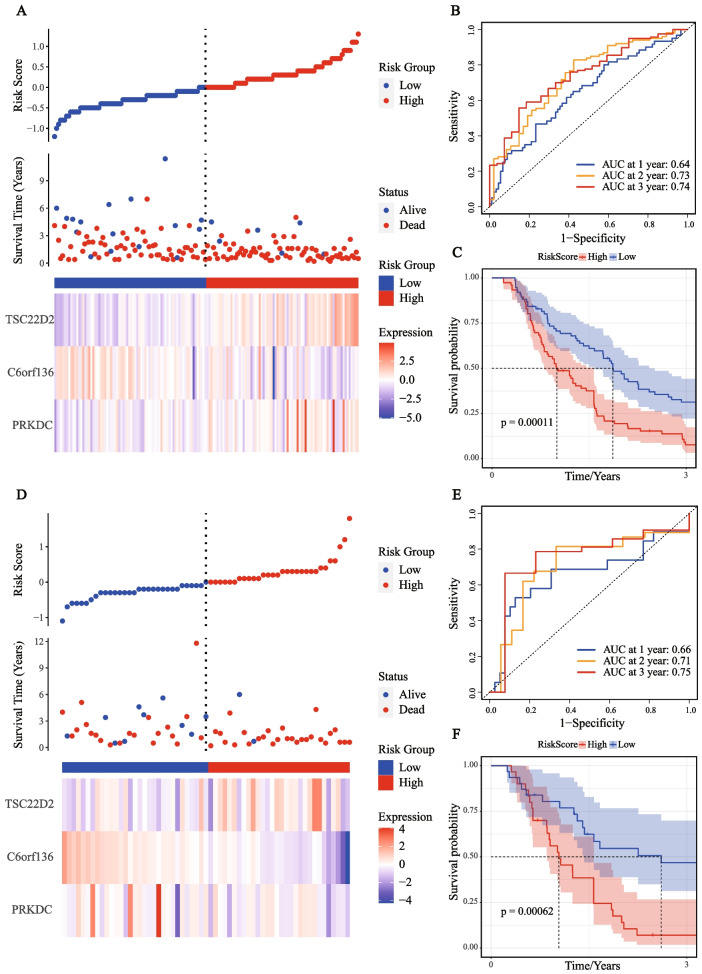
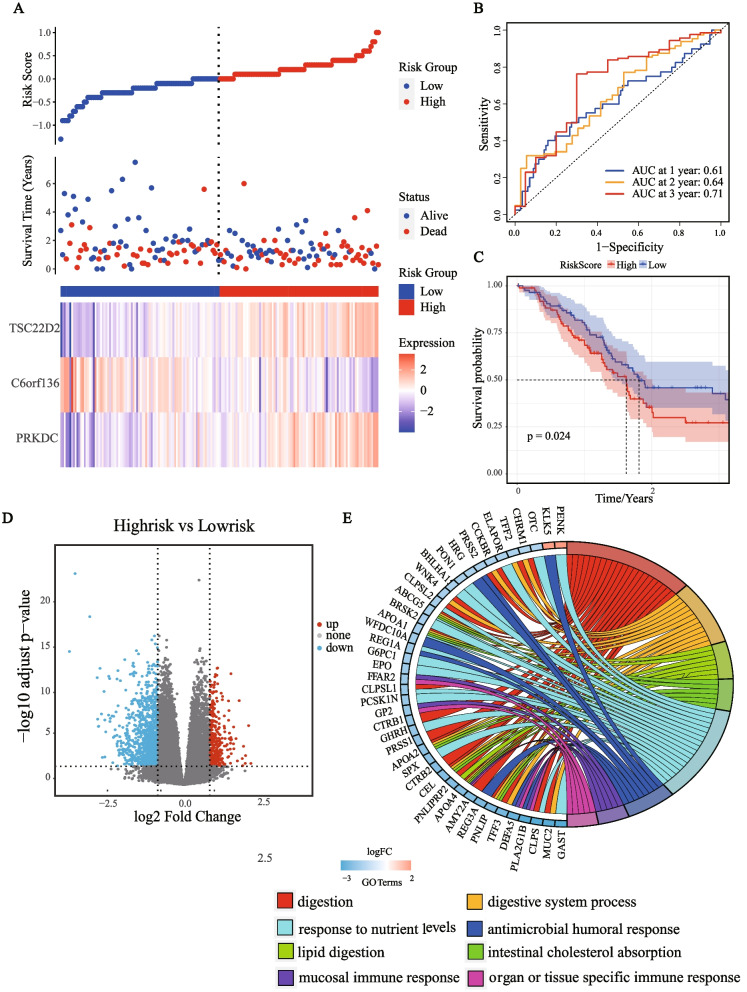
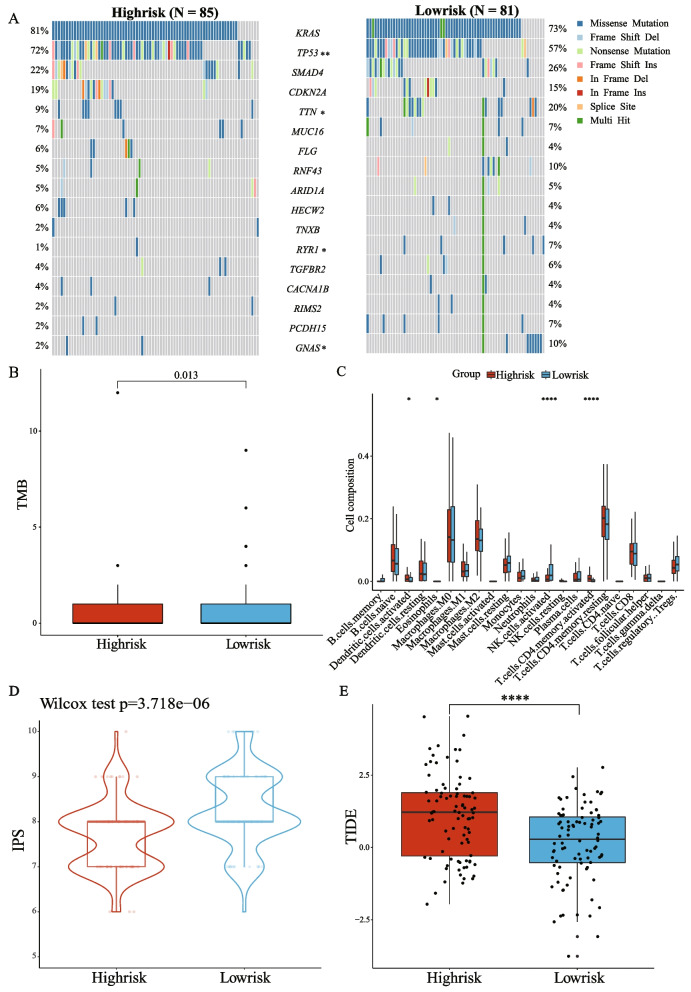
Methods: Two hundred thirteen PAAD samples from the International Cancer Genome Consortium (ICGC) were split into training and validation sets in the ratio of 7:3. The Cox regression analyses generated a prognostic model using the ICGC cohort for training (n = 152) and validation (n = 61). The model was externally tested on the Gene Expression Omnibus (GEO) (n = 80) and The Cancer Genome Atlas (TCGA) datasets (n = 176). The clinical characteristics, molecular mechanisms, immune landscape, and treatment responses in model-defined subgroups were explored. The expression of an independent prognostic gene TSC22D2 was confirmed by public databases, real-time quantitative PCR (RT-qPCR), western blot (WB), and immunohistochemistry (IHC).

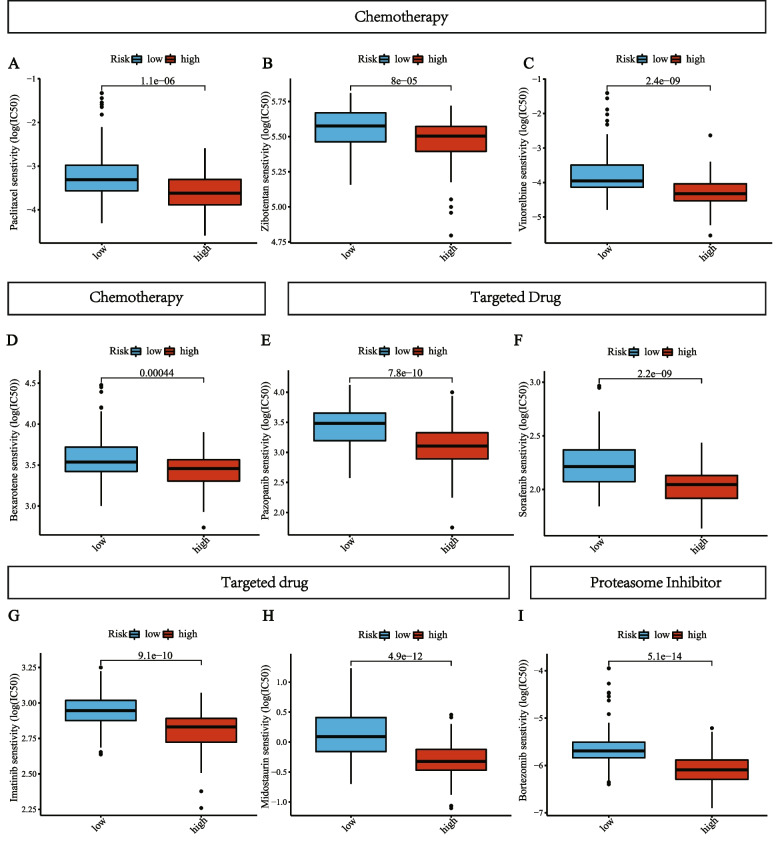
Results: A prognostic model was established based on three cuproptosis-related genes (TSC22D2, C6orf136, PRKDC). Patients were stratified into high- and low-risk groups using the risk score based on this model. PAAD patients in the high-risk group had a worse prognosis. The risk score was statistically significantly correlated with most clinicopathological characteristics. The risk score based on this model was an independent predictor of overall survival (OS) (HR = 10.7, p < 0.001), and was utilized to create a scoring nomogram with excellent prognostic value. High-risk patients had a higher TP53 mutation rate and a superior response to multiple targeted therapies and chemotherapeutic drugs, but might obtain fewer benefits from immunotherapy. Moreover, elevated TSC22D2 expression was discovered to be an independent prognostic predictor for OS (p < 0.001). Data from public databases and our own experiments showed that TSC22D2 expression was significantly higher in pancreatic cancer tissues/cells compared to normal tissues/cells.

Conclusion: This novel model based on cuproptosis-related genes provided a robust biomarker for predicting the prognosis and treatment responses of PAAD. The potential roles and underlying mechanisms of TSC22D2 in PAAD need further explored.

Keywords: Cuproptosis; Immunotherapy; Pancreatic adenocarcinoma; Prognosis; Risk model; Treatment response; Tumor microenvironment.


Conflict of interest statement

The authors declare no competing interests.

Figures

Fig. 1
Fig. 1
The overall study design and workflow
Fig. 2
Fig. 2
Construction and validation of the prognostic model in the training and validation sets. A The risk score, survival time, survival status, and 3-gene expression trend in the training set (ICGC, 152 samples). B ROC curves for the sensitivity and specificity of one-, two-, and three-year OS according to the risk score in the training set. C Kaplan–Meier curve for OS between the high- and low-risk groups in the training set. D The risk score, survival time, survival status, and 3-gene expression trend in the validation set (ICGC, 61 samples). E ROC curves for the sensitivity and specificity of one-, two-, and three-year OS according to the risk score in the validation set. F Kaplan–Meier curve for OS between the high- and low-risk groups in the validation set
Fig. 3
Fig. 3
Evaluation of prognostic model in the TCGA-testing set and functional enrichment analysis of DEGs between the risk groups. A The risk score, survival time, survival status, and 3-gene expression trend in the testing set (TCGA, 176 samples). B ROC curves for the sensitivity and specificity of one-, two-, and three-year OS according to the risk score in the testing set. C Kaplan–Meier curve for OS between the high- and low-risk groups in the testing set. D Volcano plot of DEGs between the high-risk and low-risk groups from TCGA data set. E The Chord of eight significantly enriched GO terms between high-risk and low-risk groups
Fig. 4
Fig. 4
The clinical implications and prognostic role of the model. A-F Correlation between the risk score and various clinical characteristics. G Univariate Cox analysis of the risk score and clinical characteristics for OS in the TCGA cohort. H Multivariate Cox analysis of the risk score and clinical characteristics for OS in the TCGA cohort. (I) The nomogram built in combination with the risk score and the N stage predicted one-, two-, and three-year OS in the TCGA cohort. J The probabilities of OS at one-, two-, and three-year were assessed by the calibration curve of the nomogram in the TCGA cohort. * p < 0.05; ** p < 0.01; *** P < 0.001; **** P < 0.0001
Fig. 5
Fig. 5
Comparing the molecular characteristics and immune landscapes between the high- and low-risk groups. A The oncoplot of somatic mutations in high- and low-risk patients using the TCGA cohort. B TMB between the high- and low-risk patients from the TCGA cohort. C Estimation of the proportions of immune infiltration cells using the CIBERSORT algorithm between the high- and low-risk groups. D The IPS score between the high- and low-risk patients from the TCGA cohort. E The TIDE score between the high- and low-risk patients from the TCGA cohort. * p < 0.05; ** p < 0.01; *** P < 0.001; **** P < 0.0001
Fig. 6
Fig. 6
Association between the risk score and drug sensitivity, including chemotherapeutic and targeted agents, and a proteasome inhibitor. IC50: half-maximal inhibitory concentration
Fig. 7
Fig. 7
The prognostic value and expression of TSC22D2. A Kaplan–Meier curve for OS between the high- and low-TSC22D2 expression group in the ICGC cohort. B CPTAC website showed the differences in TSC22D2 expression between cancer tissues and normal tissues at the protein level. C Results from GEPIA indicated the relative mRNA expression of TSC22D2 in PAAD samples and normal samples. D Bar chart shows quantification of TSC22D2 protein levels compared to GAPDH control in three independent experiments. One representative blot is shown. Error bars show standard deviation. E Assessment of relative fold change in TSC22D2 mRNA expression (HPNE set as 1) by RT-qPCR, normalized to GAPDH. Error bars show standard deviation* p < 0.05; ** p < 0.01; *** P < 0.001; **** P < 0.0001. F Hematoxylin and eosin (H&E) staining and IHC staining of TSC22D2 was performed in pancreatic cancer tissues and normal pancreatic tissues. Scale bars: low magnification, 200 μm; high magnification, 100 μm

References

    1. Yu S, Zhang C, Xie KP. Therapeutic resistance of pancreatic cancer: roadmap to its reversal. Biochim Biophys Acta Rev Cancer. 2021;1875(1):188461. doi: 10.1016/j.bbcan.2020.188461. - DOI - PubMed
    1. Grossberg AJ, et al. Multidisciplinary standards of care and recent progress in pancreatic ductal adenocarcinoma. CA Cancer J Clin. 2020;70(5):375–403. doi: 10.3322/caac.21626. - DOI - PMC - PubMed
    1. Balachandran VP, Beatty GL, Dougan SK. Broadening the impact of immunotherapy to pancreatic cancer: challenges and opportunities. Gastroenterol. 2019;156(7):2056–2072. doi: 10.1053/j.gastro.2018.12.038. - DOI - PMC - PubMed
    1. Shi S, et al. Proposed modification of the 8th edition of the AJCC staging system for pancreatic ductal adenocarcinoma. Ann Surg. 2019;269(5):944–950. doi: 10.1097/SLA.0000000000002668. - DOI - PubMed
    1. Wang Z, et al. Pancreatic cancer: understanding and overcoming chemoresistance. Nat Rev Gastroenterol Hepatol. 2011;8(1):27–33. doi: 10.1038/nrgastro.2010.188. - DOI - PubMed