. 2023 Mar 9;12(1):10.
doi: 10.1186/s40035-023-00343-3.

Inflammasome activation under high cholesterol load triggers a protective microglial phenotype while promoting neuronal pyroptosis

Affiliations

Inflammasome activation under high cholesterol load triggers a protective microglial phenotype while promoting neuronal pyroptosis

Cristina de Dios et al. Transl Neurodegener. .

Abstract

Background: Persistent inflammatory response in the brain can lead to tissue damage and neurodegeneration. In Alzheimer's disease (AD), there is an aberrant activation of inflammasomes, molecular platforms that drive inflammation through caspase-1-mediated proteolytic cleavage of proinflammatory cytokines and gasdermin D (GSDMD), the executor of pyroptosis. However, the mechanisms underlying the sustained activation of inflammasomes in AD are largely unknown. We have previously shown that high brain cholesterol levels promote amyloid-β (Aβ) accumulation and oxidative stress. Here, we investigate whether these cholesterol-mediated changes may regulate the inflammasome pathway.

Methods: SIM-A9 microglia and SH-SY5Y neuroblastoma cells were cholesterol-enriched using a water-soluble cholesterol complex. After exposure to lipopolysaccharide (LPS) plus muramyl dipeptide or Aβ, activation of the inflammasome pathway was analyzed by immunofluorescence, ELISA and immunoblotting analysis. Fluorescently-labeled Aβ was employed to monitor changes in microglia phagocytosis. Conditioned medium was used to study how microglia-neuron interrelationship modulates the inflammasome-mediated response.

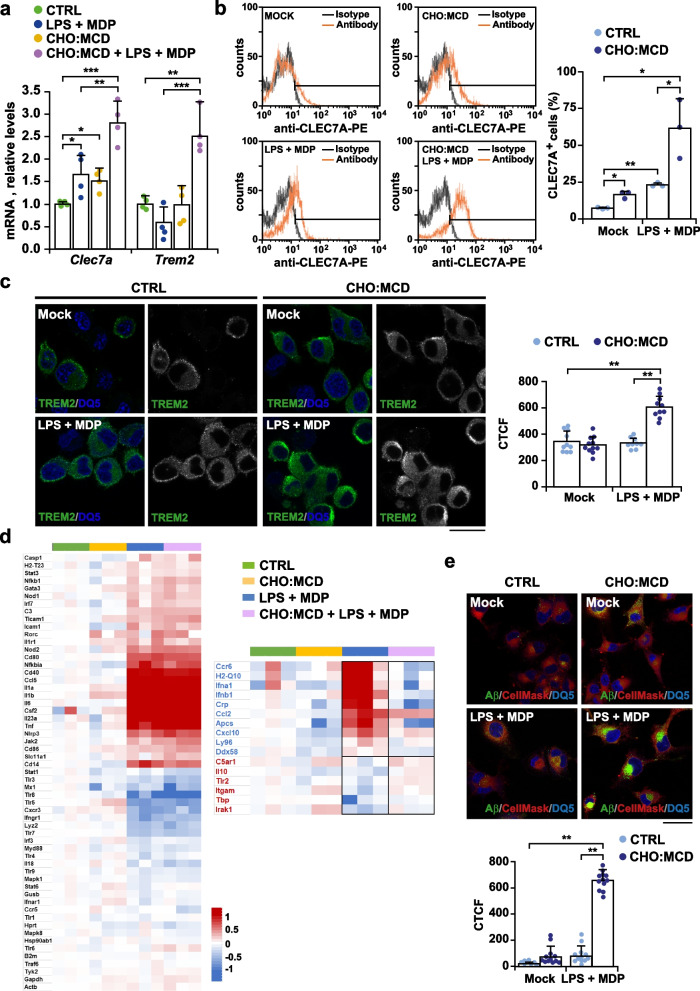
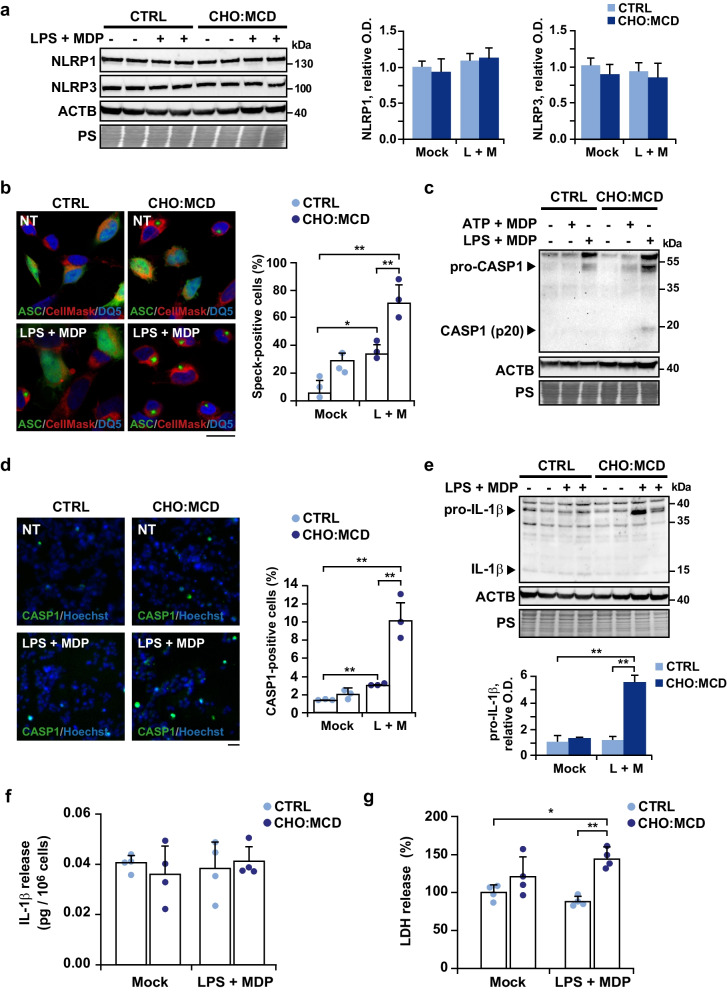
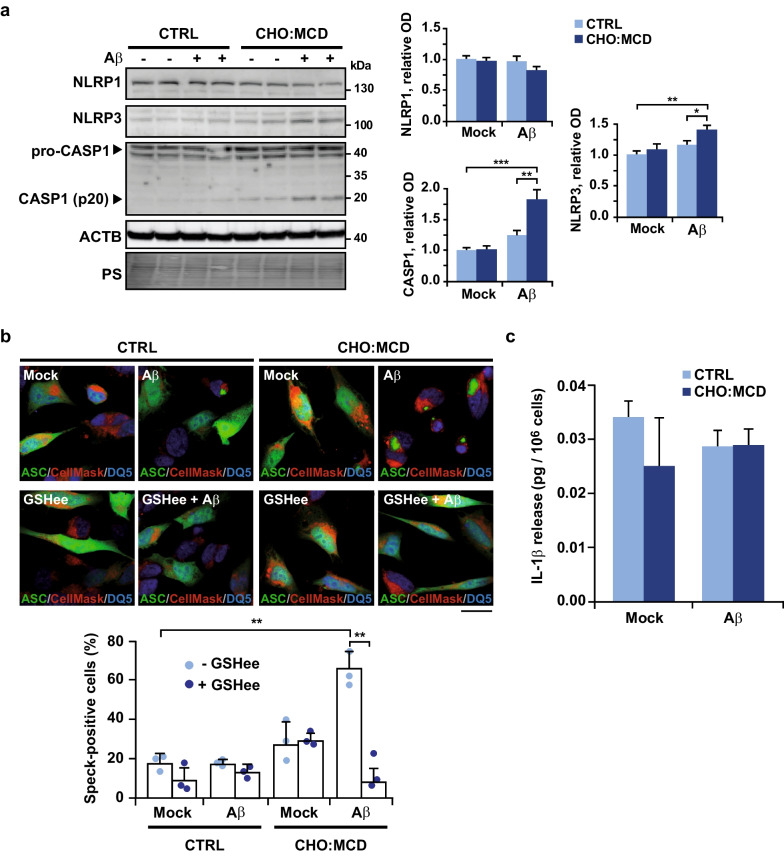
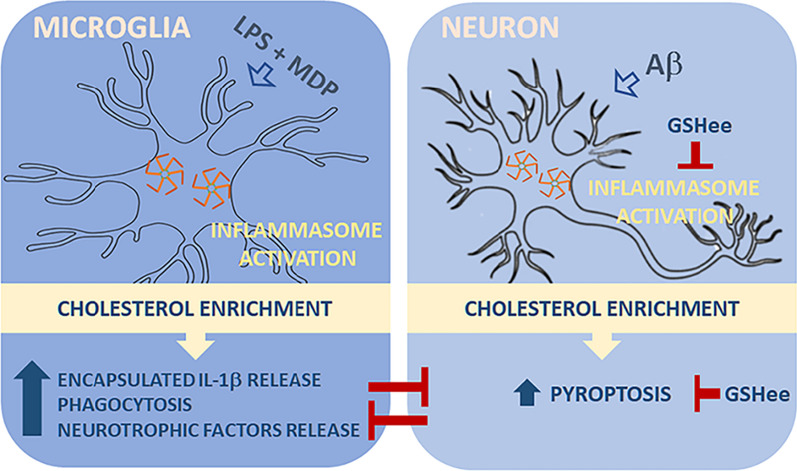
Results: In activated microglia, cholesterol enrichment promoted the release of encapsulated IL-1β accompanied by a switch to a more neuroprotective phenotype, with increased phagocytic capacity and release of neurotrophic factors. In contrast, in SH-SY5Y cells, high cholesterol levels stimulated inflammasome assembly triggered by both bacterial toxins and Aβ peptides, resulting in GSDMD-mediated pyroptosis. Glutathione (GSH) ethyl ester treatment, which recovered the cholesterol-mediated depletion of mitochondrial GSH levels, significantly reduced the Aβ-induced oxidative stress in the neuronal cells, resulting in lower inflammasome activation and cell death. Furthermore, using conditioned media, we showed that neuronal pyroptosis affects the function of the cholesterol-enriched microglia, lowering its phagocytic activity and, therefore, the ability to degrade extracellular Aβ.

Conclusions: Changes in intracellular cholesterol levels differentially regulate the inflammasome-mediated immune response in microglia and neuronal cells. Given the microglia-neuron cross-talk in the brain, cholesterol modulation should be considered a potential therapeutic target for AD treatment, which may help to block the aberrant and chronic inflammation observed during the disease progression.

Keywords: Alzheimer’s disease; DAM signature; Mitochondrial oxidative stress; NLRP3; Neuroinflammation; Phagocytosis.


Conflict of interest statement

The authors declare that they have no competing interests.

Figures

Fig. 1
Fig. 1
Activation of the NLRP3 inflammasome by PAMPs in SIM-A9 microglial cells after cholesterol enrichment. Cells were treated with the CHO:MCD complex for 1 h. Inflammasome was induced by co-incubation with LPS and MDP (L + M, 10 μg/ml each for 16 h), LPS (10 μg/ml for 16 h) and ATP (5 mM for 1 h) (L + A), or MSU (150 μg/ml for 4 h). a Total cholesterol levels of cellular extracts. (n = 3 independent experiments). b Filipin staining. Representative images from 3 independent experiments. Scale bar: 100 μm. Filipin staining was quantified as the CTCF of the green channel (n = 12). c Western blot analysis of NLRP1, NLRP3 and IL-1β in cellular extracts. (pro-IL-1β: IL-1β pro-form). ACTB/actin β and ponceau S (PS) staining were used as loading controls. Optical density (O.D.) values of the bands representing the specific protein immunoreactivity were normalized to PS staining (n = 4). d Representative confocal images of oligomeric ASC from 3 independent experiments. Cells were transfected with a plasmid encoding an ASC:GFP fusion protein and treated as indicated. Cells were counterstained with CellMask (cytosol/plasma membrane, red). Scale bar: 25 μm. e Representative fluorescence micrographs of CASP1-positive cells (green). The fluorescent CASP1 inhibitor was added during the inflammasome induction period (16 h). Nuclei were stained with 1 μg/ml Hoechst 33342. Scale bar: 100 μm. Data in the graph are expressed as % of CASP1-positive cells (green) over total Hoechst-stained cells (blue). (n = 3 independent experiments). f Levels of IL-1β in the cell culture supernatants. Values were normalized to the total protein content of the corresponding cellular extracts. In some cases, to assess the presence of IL-1β encapsulated in EV, supernatants were incubated with 1% Triton X-100 (n = 6–7 independent experiments). g Cell death by the LDH assay. Results are expressed as % to the untreated control values (n = 6 independent experiments). Two-tailed Student's t-test (a and b) and one-way ANOVA followed by the Tukey–Kramer test (c-g) were applied to calculate statistical significance (*P ≤ 0.05, **P ≤ 0.01). See Additional file 1: Fig. S5 for uncropped blots
Fig. 2
Fig. 2
High cholesterol burden attenuates the pro-inflammatory phenotype displayed by PAMP-activated SIM-A9 microglial cells. Cells were cholesterol-enriched by incubation with the CHO:MCD complex for 1 h. After 4 h of recovery, cells were stimulated with LPS (10 μg/ml) plus MDP (10 μg/ml) for 16 h. a Trem2 and Clec7a mRNA expression levels analyzed by selfie qRT-PCR. Transcript copies were normalized to total genomic DNA and reported as relative levels referred to the expression in CTRL cells (n = 4 independent experiments). b CLEC7A levels quantified by flow cytometry (n = 3). Histogram plots provide representative data from 3 independent experiments. c Representative confocal immunomicrographs from 3 independent experiments showing enhanced cell surface presence of TREM2 in cholesterol-enriched cells after PAMP exposure. Nuclei were stained with DRAQ5 (blue). Images from the green channel corresponding to TREM2 immunostaining are shown in black and white. Plot represents TREM2 levels per cell, quantified as the CTCF of the green channel (n = 9–10 non-overlapping images). Scale bar: 25 μm. d Heat map depicting transcriptional changes in gene expression assayed by qRT-PCR using an innate and adaptive immune response gene array. Each probe set is represented in a blue-red row Z-score scale with red indicating high expression and blue low expression. The panel on the right shows the genes whose endotoxin-mediated changes in expression are up/down-regulated by cholesterol enrichment (n = 3 independent experiments). See Additional file 2 for array dataset. e Immunofluorescence measurement of phagocytosis. Representative confocal images of microglia incubated with fluorescent Aβ and counterstained with CellMask (cytosol/plasma membrane, red) and DRAQ5 (nuclei, blue) (n = 3 independent experiments). Scale bar, 25 μm. Plot represents Aβ phagocytosed per cell, quantified as the CTCF of the green channel (n = 12 non-overlapping images). One-way ANOVA followed by the Tukey–Kramer test was applied to calculate statistical significance (*P ≤ 0.05, **P ≤ 0.01, ***P ≤ 0.001)
Fig. 3
Fig. 3
Neuroprotective effect of conditioned media from activated microglia after cholesterol enrichment. Cells were cholesterol-enriched by incubation with the CHO:MCD complex for 1 h. After 4 h of recovery, cells were stimulated with LPS (10 μg/ml) plus MDP (10 μg/ml) for 16 h. a NGF and BDNF secretion. Cell culture media were collected after the indicated treatments and the levels of both neurotrophins were analyzed by ELISA. The protein concentration of cell extracts was used for data normalization (n = 4–5 independent experiments). b and c Analysis of cell death by LDH assay. Primary neuronal cell cultures (b) and SH-SY5Y cells (c) were first incubated for 16 h with conditioned media (CM) from SIM-A9 cells treated as indicated (CM1: mock, CM2: CHO:MCD exposure for 1 h, CM2: 10 μg/ml LPS + 10 μg/ml MDP induction for 16 h, and CM4: CHO:MCD exposure for 1 h followed by LPS + MDP induction for 16 h). Then, cells were exposed to Aβ for 24 h. LDH activity was determined in the cell culture media and normalized to total cellular LDH content. Results are expressed as % relative to the untreated control values. (n = 4–5 independent experiments). One-way ANOVA followed by the Tukey–Kramer test was applied to calculate statistical significance (*P ≤ 0.05, **P ≤ 0.01, ***P ≤ 0.001)
Fig. 4
Fig. 4
Cholesterol-enriched neuroblastoma SH-SY5Y cells show enhanced endotoxin-mediated activation of NLRP3 inflammasome. After treatment with the CHO:MCD complex cells were co-incubated with LPS and MDP (L + M, 10 μg/ml each for 16 h) or MDP (10 μg/ml, 16 h) plus ATP (5 mM, 1 h). a Western blot analysis of NLRP1 and NLRP3 in cellular extracts. (n = 3 independent experiments). b Representative confocal images of oligomeric ASC. Cells were transfected with a plasmid encoding an ASC:GFP fusion protein and 48 h later were treated as indicated. Cells were counterstained with CellMask (cytosol/plasma membrane, red) and DRAQ5 (nuclei, blue). Scale bar: 25 μm. Data in the graph are expressed as % of speck-positive cells of total transfected cells (n = 3 independent experiments). c Representative immunoblots from 3 independent experiments showing pro- and cleaved CASP1 (active product of 20 kDa) in cellular extracts. d Representative micrographs of CASP1-positive cells (green). The fluorescent CASP1 inhibitor was added during the inflammasome induction period (16 h). Nuclei were stained with Hoechst 33342 (1 μg/ml). Scale bar: 100 μm. Data in the graph are expressed as % of CASP1-positive cells to the total Hoechst-stained cells (blue) (n = 3 independent experiments). e Representative immunoblots of pro- and mature IL-1β in cellular extracts. (n = 4 independent experiments). f Levels of IL-1β in the cell culture supernatants. Values were normalized to the total protein content and expressed as % relative to the untreated control values (n = 4 independent experiments). g Cell death by the LDH assay. Results are expressed as % to the untreated control values (n = 4 independent experiments). In western blots, ACTB/actin β and ponceau S (PS) staining were used as loading controls and optical density (O.D.) values of the bands representing the specific protein immunoreactivity were normalized to PS staining. One-way ANOVA followed by the Tukey–Kramer test was applied to calculate statistical significance (*P ≤ 0.05, **P ≤ 0.01). See Additional file 1: Fig. S6 for uncropped blots
Fig. 5
Fig. 5
Cholesterol overload promotes inflammasome activation in SH-SY5Y cells in response to Aβ exposure. For cholesterol enrichment, cells were treated with the CHO:MCD complex for 1 h. After 4 h of recovery, cells were exposed to Aβ (10 μM) for 24 h. In some cases, cells were pre-treated with GSH ethyl ester (GSHee, 4 mM) for 30 min before Aβ treatment. a Western blot analysis of NLRP1, NLRP3 and pro- and cleaved CASP1 (self-cleavage and active product of 20 kDa) in cellular extracts. The ACTB/actin β immunoblot and ponceau S (PS) staining were used as loading controls. Optical density (O.D.) values of the bands representing the specific protein immunoreactivity were normalized to the values of the corresponding PS staining (n = 4 independent experiments). b Representative confocal images of oligomeric ASC forms. To monitor ASC-dependent inflammasome assembly cells were transfected with a plasmid encoding an ASC:GFP fusion protein and counterstained with CellMask (cytosol/plasma membrane, red) and DRAQ5 (nuclei, blue). Speck formation (seen as an aggregate) was determined by confocal microscopy and the number of speck-positive cells of total transfected cells was quantified (n = 3 independent experiments). Scale bar, 25 μm. c Levels of IL-1β in the cell culture supernatants after Aβ incubation (n = 4 independent experiments). One-way ANOVA followed by the Tukey–Kramer test was applied to calculate statistical significance (*P ≤ 0.05, **P ≤ 0.01, ***P ≤ 0.001). See Additional file 1: Fig. S6 for uncropped blots
Fig. 6
Fig. 6
Cholesterol-enriched SH-SY5Y cells display increased susceptibility to Aβ-induced pyroptosis, which is prevented by GSHee treatment. After treatment with the CHO:MCD complex for 1 h, cells were exposed to Aβ (10 μM) for 24 h. In some cases, cells were pre-treated with GSH ethyl ester (GSHee, 4 mM) or a cell-permeable CASP1 inhibitor (10 μM) for 30 min before Aβ treatment. a Analysis of cell death by the LDH assay. LDH activity was determined in the cell culture media and normalized to total cellular LDH content. Results are expressed as % of untreated control values. (n = 6 independent experiments). b Intracellular ROS generation assessed by DCF fluorescence intensity (A.U.: arbitrary units). (n = 6–8 independent experiments). c Representative confocal immunomicrographs showing apical GSDMD puncta (white arrows) in cholesterol-enriched cells after Aβ exposure. Nuclei were stained with DRAQ5 (blue). Cells incubated with LPS (100 ng/ml) for 6 h followed by nigericin (NG, 10 μM) for 2 h were used as positive controls. Scale bar: 15 μm. Data in the graph are expressed as % of cells with GSDMD puncta over total cells. (n = 3 independent experiments). d Time-lapse microscopy of cells expressing mNeoGreen-GSDMD. Image series (20-min frames) depict the 2 h leading up to the loss of membrane integrity and cell round-up characteristic of necroptotic death in cholesterol-enriched cells exposed to Aβ. Presence of GSDMD puncta is indicated by white arrows. See Additional file 3, Additional file 4, Additional file 5 and Additional file 6 for the corresponding movies. One-way ANOVA followed by the Tukey–Kramer test was applied to calculate statistical significance (*P ≤ 0.05, **P ≤ 0.01)
Fig. 7
Fig. 7
Conditioned media from cholesterol-enriched SH-SY5Y cells exposed to Aβ alter the phagocytic capacity of microglia. Conditioned media were obtained from SH-SY5Y cells cholesterol-enriched (CHO:MCD complex, 1 h) and then treated with Aβ (10 μM, 24 h). In some cases, cells were pre-treated with GSH ethyl ester (GSHee, 4 mM) for 30 min before Aβ exposure. SIM-A9 cells were incubated with the conditioned media for 16 h and then HiLyte Fluor 488-labeled Aβ (1 μM) was added for 4 h. a and b Representative confocal micrographs from 3 independent experiments showing Aβ phagocytosis (green). In b, SIM-A9 cells were cholesterol-enriched with the CHO:MCD complex for 1 h and after 4-h recovery were primed with LPS (10 μg/ml) plus MDP (10 μg/ml) (L + M) for 16 h or Aβ (10 μM) for 24 h before exposure to conditioned media from SH-SY5Y cells. Cells were counterstained with CellMask (cytosol/plasma membrane, red) and DRAQ5 (nuclei, blue). Images from the green channel corresponding to fluorescent-labeled Aβ are shown in black and white. Scale bars: 15 μm. a and c Plots represent Aβ phagocytosed per cell, quantified as the corrected total cell fluorescence (CTCF) of the green channel (n = 9–12 non-overlapping images). d Trem2 and Clec7a mRNA expression levels analyzed by selfie qRT-PCR. Transcript copies were normalized to total genomic DNA and reported as relative levels referred to the expression in mock cells. (n = 4 independent experiments). One-way ANOVA followed by the Tukey–Kramer test was applied to calculate statistical significance (*P ≤ 0.05, **P ≤ 0.01, ***P ≤ 0.001)
Fig. 8
Fig. 8
Conditioned media from Aβ-treated SREBF2 neurons inhibit phagocytosis in activated and cholesterol-enrichment microglia. Conditioned media were obtained from WT and SREBF2 primary neuronal cultures treated with Aβ (1 μM, 48 h). SIM-A9 cells were cholesterol-enriched with the CHO:MCD complex for 1 h and after 4-h recovery were primed with LPS (10 μg/ml) plus MDP (10 μg/ml) (L + M) for 16 h or Aβ (10 μM) for 24 h before exposure to conditioned media for 16 h. HiLyte Fluor 488-labeled Aβ (1 μM) was added for 4 h to evaluate phagocytosis by confocal microcopy. Shown are representative confocal micrographs from 2 independent experiments. Cells were counterstained with CellMask (cytosol/plasma membrane, red). Images from the green channel corresponding to fluorescent-labeled Aβ are shown in black and white. Scale bars: 15 μm. Plots represent Aβ phagocytosed per cell, quantified as the corrected total cell fluorescence (CTCF) of the green channel (n = 5 non-overlapping images). One-way ANOVA followed by the Tukey–Kramer test was applied to calculate statistical significance (*P ≤ 0.05, **P ≤ 0.01, ***P ≤ 0.001)
Fig. 9
Fig. 9
Proposed model illustrating the cholesterol regulation of the inflammasome-mediated immune response in microglia and neuronal cells

References

    1. Abbott A. Is 'friendly fire' in the brain provoking Alzheimer's disease? Nature. 2018;556(7702):426–428. doi: 10.1038/d41586-018-04930-7. - DOI - PubMed
    1. Mathys H, Adaikkan C, Gao F, Young JZ, Manet E, Hemberg M, et al. Temporal tracking of microglia activation in neurodegeneration at single-cell resolution. Cell Rep. 2017;21(2):366–380. doi: 10.1016/j.celrep.2017.09.039. - DOI - PMC - PubMed
    1. Hashemiaghdam A, Mroczek M. Microglia heterogeneity and neurodegeneration: the emerging paradigm of the role of immunity in Alzheimer's disease. J Neuroimmunol. 2020;341:577185. doi: 10.1016/j.jneuroim.2020.577185. - DOI - PubMed
    1. Keren-Shaul H, Spinrad A, Weiner A, Matcovitch-Natan O, Dvir-Szternfeld R, Ulland TK, et al. A unique microglia type associated with restricting development of Alzheimer's disease. Cell. 2017;169(7):1276–1290 e1217. doi: 10.1016/j.cell.2017.05.018. - DOI - PubMed
    1. Krasemann S, Madore C, Cialic R, Baufeld C, Calcagno N, El Fatimy R, et al. The TREM2-APOE pathway drives the transcriptional phenotype of dysfunctional microglia in neurodegenerative diseases. Immunity. 2017;47(3):566–581 e569. doi: 10.1016/j.immuni.2017.08.008. - DOI - PMC - PubMed

Publication types

MeSH terms

Substances