. 2023 May;44(7):2684-2700.
doi: 10.1002/hbm.26220. Epub 2023 Mar 9.

Cerebellar and subcortical atrophy contribute to psychiatric symptoms in frontotemporal dementia

Collaborators, Affiliations

Cerebellar and subcortical atrophy contribute to psychiatric symptoms in frontotemporal dementia

Aurélie Bussy et al. Hum Brain Mapp. 2023 May.

Abstract

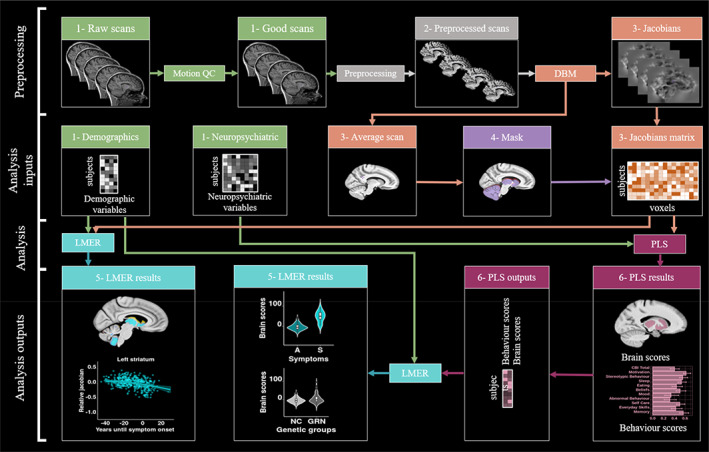
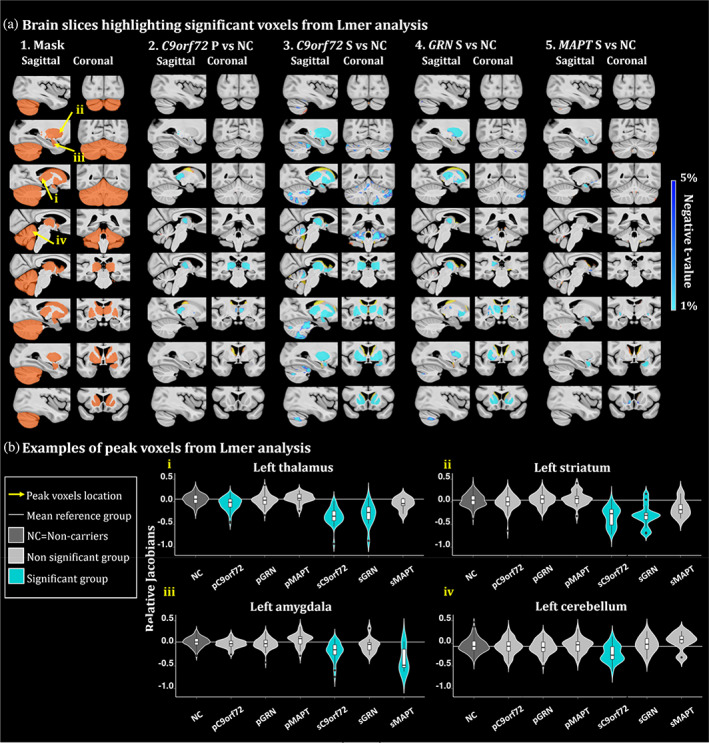
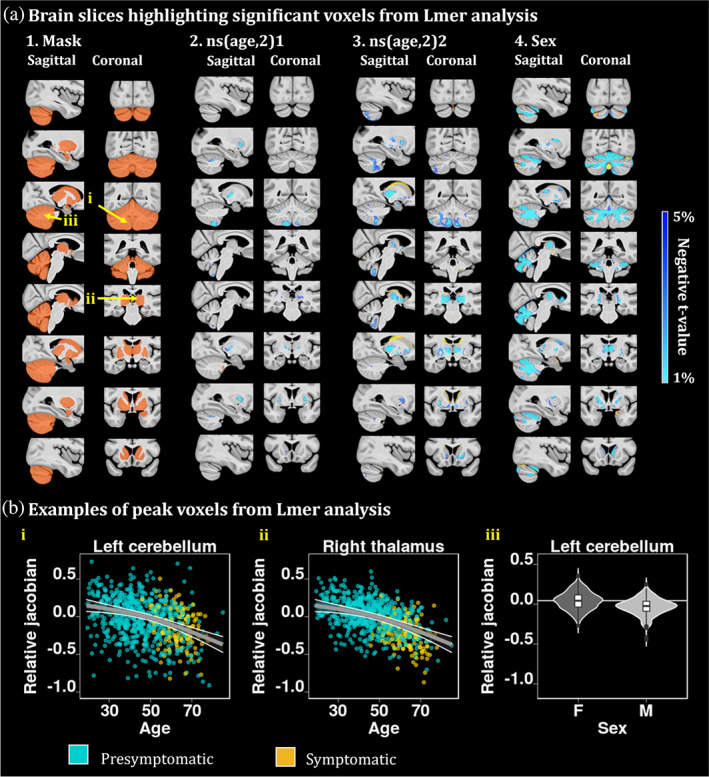
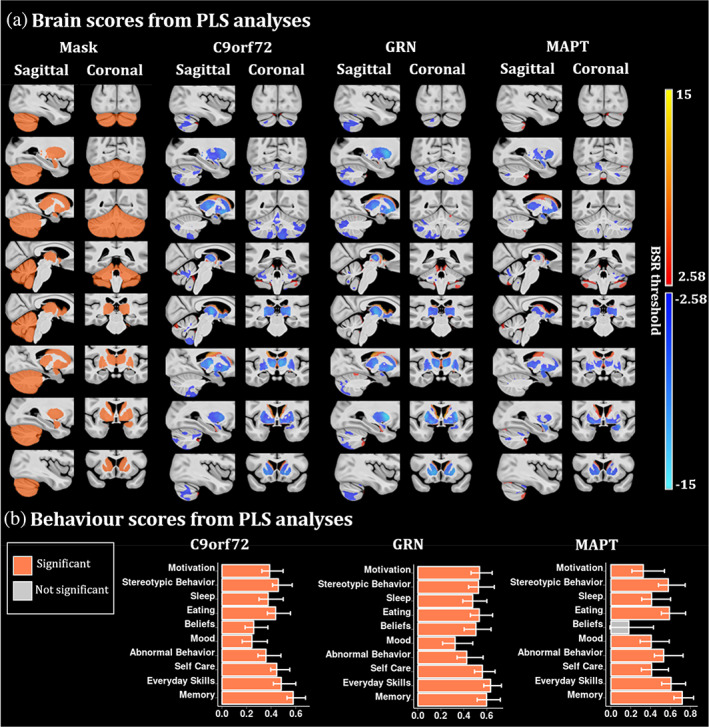
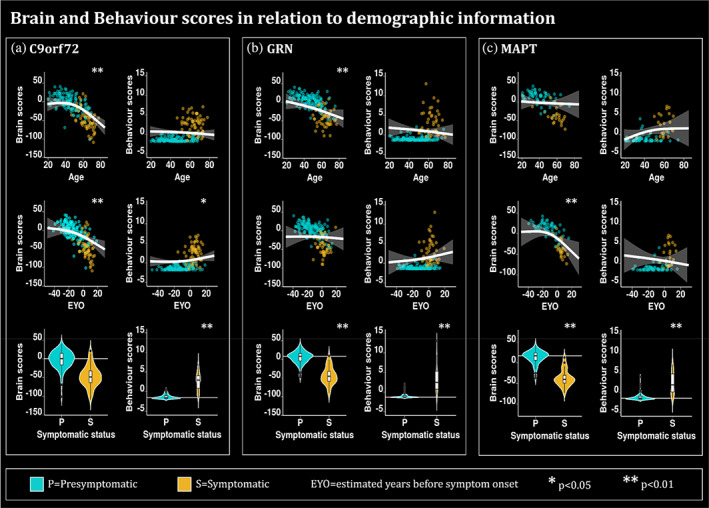
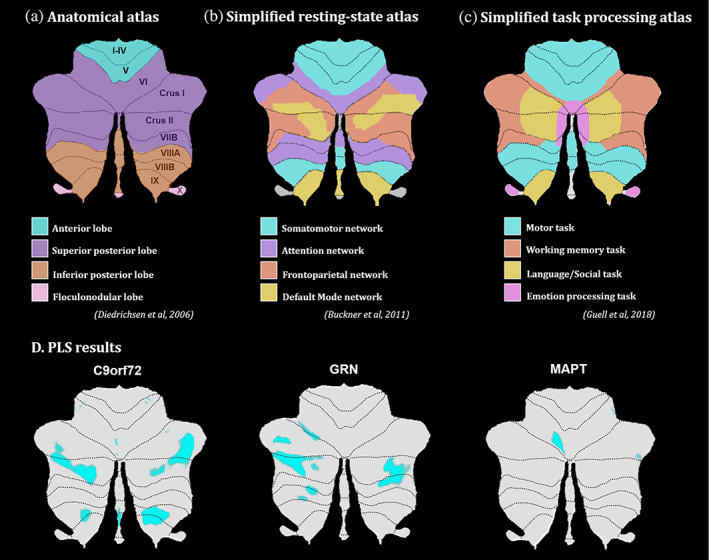
Recent studies have reported early cerebellar and subcortical impact in the disease progression of genetic frontotemporal dementia (FTD) due to microtubule-associated protein tau (MAPT), progranulin (GRN) and chromosome 9 open reading frame 72 (C9orf72). However, the cerebello-subcortical circuitry in FTD has been understudied despite its essential role in cognition and behaviors related to FTD symptomatology. The present study aims to investigate the association between cerebellar and subcortical atrophy, and neuropsychiatric symptoms across genetic mutations. Our study included 983 participants from the Genetic Frontotemporal dementia Initiative including mutation carriers and noncarrier first-degree relatives of known symptomatic carriers. Voxel-wise analysis of the thalamus, striatum, globus pallidus, amygdala, and the cerebellum was performed, and partial least squares analyses (PLS) were used to link morphometry and behavior. In presymptomatic C9orf72 expansion carriers, thalamic atrophy was found compared to noncarriers, suggesting the importance of this structure in FTD prodromes. PLS analyses demonstrated that the cerebello-subcortical circuitry is related to neuropsychiatric symptoms, with significant overlap in brain/behavior patterns, but also specificity for each genetic mutation group. The largest differences were in the cerebellar atrophy (larger extent in C9orf72 expansion group) and more prominent amygdalar volume reduction in the MAPT group. Brain scores in the C9orf72 expansion carriers and MAPT carriers demonstrated covariation patterns concordant with atrophy patterns detectable up to 20 years before expected symptom onset. Overall, these results demonstrated the important role of the subcortical structures in genetic FTD symptom expression, particularly the cerebellum in C9orf72 and the amygdala in MAPT carriers.

Keywords: frontotemporal dementia; genetics; magnetic resonance imaging; neuropsychiatry.


Conflict of interest statement

The authors report no competing interests related to this paper.

Figures

FIGURE 1
FIGURE 1
Chart flow of the step by step methods and analyses used in this paper. 1‐Green: Raw inputs (2.3.1. Image acquisition); 2‐Gray: preprocessing (2.3.2 Preprocessing); 3‐Orange: Deformation based morphometry (2.3.3. Deformation based morphometry); 4‐Purple: Mask creation (2.3.4. Mask creation); 5‐Turquoise: linear mixed effect models (2.4.1. Linear mixed effect models); 6‐Pink: Partial least squares (2.4.2. Partial least squares analysis). DBM, deformation based morphometry; LMER, linear mixed effect models; PLS, partial least squares; Preprocessing, minc‐bpipe‐library; QC, quality control; SVD, singular value decomposition.
FIGURE 2
FIGURE 2
(a) Brain slices of the brain highlighting significant group differences from the lmer analyses. t‐value maps correspond to significant p‐values between 5% and 1% after FDR correction. Axial slices represented from left to right and coronal slices represented from posterior to anterior. The t‐statistics color maps for the significant expansion are in yellow to red and for the significant contraction are in turquoise to blue. Yellow arrows were used to highlight the peak voxels selected for the plots in Figure 2b. A1. Sagittal and coronal slices of the mask used to focus the analyses in the regions of interest. Slices of the brain showing significant differences between the relative Jacobians of the A2. presymptomatic (P) C9orf72 carriers; A3. symptomatic (S) C9orf72 carriers; A4. symptomatic GRN carriers and A5. MAPT carriers versus the relative Jacobians of the noncarrier participants. (b) Examples of peak voxels from lmer analyses. White horizontal line highlights the mean relative Jacobian of the reference group (i.e., noncarrier participants). Violin plots illustrate the group difference of a peak voxel in the i. left thalamus, ii. left striatum, iii. left amygdala and iv. left cerebellum.
FIGURE 3
FIGURE 3
(a) Brain slices of the brain highlighting significant age effects from the lmer analyses. t‐value maps of the age variable corresponding to significant p‐values between 5% and 1% after FDR correction. Axial slices represented from left to right and coronal slices represented from posterior to anterior. The t‐statistics color maps for the significant expansion are in yellow to red and for the significant contraction are in turquoise to blue. Yellow arrows were used to highlight the peak voxels selected for the plots in Figure 3b. A.4. Map of the relative Jacobians difference between males versus females. (b) (i) and (ii) second order relationships between the relative Jacobians and age, using the predicted Jacobians between age 19 and 85 for a subject of mean EYO and unweighted averages over the levels of sex and group. These plots highlight a second order volume decrease with advanced age in two peak voxels of the left cerebellum lobule IX and right thalamus. (iii) peak voxel from the white matter cerebellum showing sex difference atrophy between males and females.
FIGURE 4
FIGURE 4
PLS analyses between the voxel‐wise relative Jacobians and the CBI‐R variables for each mutation group separately. (a) Brain scores of each latent variable (LV) were plotted using the vertex wise BSR thresholded at 2.58 (p < .01). The range of BSR values was (−12.4, 11.7) for C9orf72, (−14.8, 14.5) for GRN and (−8.4, 9.1) for MAPT LV. A common minimum/maximum BSR threshold was selected (−15, 15) to have a similar color scale between each brain map. Each group demonstrated one significant LV except the noncarriers group (not shown). The LV explained 91.8% of the variance for C9orf72, 93.2% of the variance for GRN and 84.4% of the variance for MAPT. (b) Bar plots describe the correlation of each CBI‐R variable with each LV, with error bars denoting the 95% confidence interval. Orange color represents CBI‐R variables that significantly participate in the LV while grey color represents nonsignificant CBI‐R variables.
FIGURE 5
FIGURE 5
Plots describing the relationship of the brain and behavior scores for (a) C9orf72, (b) GRN and (c) MAPT mutation carriers with demographic and clinical information such as age, EYO, and symptomatic status. The plots for age and EYO either demonstrate the second order relationships between the relative Jacobians and age using the predicted Jacobians between age 19 and 85 for a subject of mean EYO or using the predicted Jacobians between EYO‐50 and 30 for a subject of mean age, respectively. These models were computed using the unweighted averages over the levels of sex, education and symptomatic status. Turquoise is used to highlight the presymptomatic (P) individuals while gold is used to highlight the symptomatic (S) individuals. * is used to show significant variables (p < .05 after FDR correction) and ** to show significant variables (p < .01 after FDR correction. The age and EYO relationships were plotted based on the lmer model. White horizontal lines highlight the mean relative Jacobian of the presymptomatic individuals (reference group).
FIGURE 6
FIGURE 6
Flatmaps of the (a) cerebellar anatomical atlas Diedrichsen et al., 2009), (b) simplified resting‐state network atlas Buckner et al., 2011), (c) simplified task processing atlas (Guell et al., 2023) and (d) LV1 brain map results from PLS analyses for each mutation group.

References

    1. Avants, B. B. , Tustison, N. J. , Song, G. , Cook, P. A. , Klein, A. , & Gee, J. C. (2011). A reproducible evaluation of ANTs similarity metric performance in brain image registration. NeuroImage, 54(3), 2033–2044. - PMC - PubMed
    1. Balleine, B. W. , Delgado, M. R. , & Hikosaka, O. (2007). The role of the dorsal striatum in reward and decision‐making. The Journal of Neuroscience: The Official Journal of the Society for Neuroscience, 27(31), 8161–8165. - PMC - PubMed
    1. Benjamini, Y. , & Hochberg, Y. (1995). Controlling the false discovery rate: A practical and powerful approach to multiple testing. Journal of the Royal Statistical Society. Series B, Statistical Methodology, 57(1), 289–300.
    1. Benussi, A. , Premi, E. , Gazzina, S. , Brattini, C. , Bonomi, E. , Alberici, A. , Jiskoot, L. , van Swieten, J. C. , Sanchez‐Valle, R. , Moreno, F. , Laforce, R. , Graff, C. , Synofzik, M. , Galimberti, D. , Masellis, M. , Tartaglia, C. , Rowe, J. B. , Finger, E. , Vandenberghe, R. , … Zulaica, M. (2021). Progression of behavioral disturbances and neuropsychiatric symptoms in patients with genetic frontotemporal dementia. JAMA Network Open, 4(1), e2030194. - PMC - PubMed
    1. Bertrand, A. , Wen, J. , Rinaldi, D. , Houot, M. , Sayah, S. , Camuzat, A. , Fournier, C. , Fontanella, S. , Routier, A. , Couratier, P. , Pasquier, F. , Habert, M.‐O. , Hannequin, D. , Martinaud, O. , Caroppo, P. , Levy, R. , Dubois, B. , Brice, A. , Durrleman, S. , … for the Predict to Prevent Frontotemporal Lobar Degeneration and Amyotrophic Lateral Sclerosis (PREV‐DEMALS) Study Group . (2018). Early cognitive, structural, and microstructural changes in Presymptomatic C9orf72 carriers younger than 40 years. JAMA Neurology, 75(2), 236–245. - PMC - PubMed

Publication types

Substances