. 2023 Mar 7;2(3):pgad012.
doi: 10.1093/pnasnexus/pgad012. eCollection 2023 Mar.

Local calcium signal transmission in mycelial network exhibits decentralized stress responses

Affiliations

Local calcium signal transmission in mycelial network exhibits decentralized stress responses

Ayaka Itani et al. PNAS Nexus. .

Abstract

Many fungi live as mycelia, which are networks of hyphae. Mycelial networks are suited for the widespread distribution of nutrients and water. The logistical capabilities are critical for the extension of fungal survival areas, nutrient cycling in ecosystems, mycorrhizal symbioses, and virulence. In addition, signal transduction in mycelial networks is predicted to be vital for mycelial function and robustness. A lot of cell biological studies have elucidated protein and membrane trafficking and signal transduction in fungal hyphae; however, there are no reports visualizing signal transduction in mycelia. This paper, by using the fluorescent Ca2+ biosensor, visualized for the first time how calcium signaling is conducted inside the mycelial network in response to localized stimuli in the model fungus Aspergillus nidulans. The wavy propagation of the calcium signal inside the mycelium or the signal blinking in the hyphae varies depending on the type of stress and proximity to the stress. The signals, however, only extended around 1,500 μm, suggesting that the mycelium has a localized response. The mycelium showed growth delay only in the stressed areas. Local stress caused arrest and resumption of mycelial growth through reorganization of the actin cytoskeleton and membrane trafficking. To elucidate the downstream of calcium signaling, calmodulin, and calmodulin-dependent protein kinases, the principal intracellular Ca2+ receptors were immunoprecipitated and their downstream targets were identified by mass spectrometry analyses. Our data provide evidence that the mycelial network, which lacks a brain or nervous system, exhibits decentralized response through locally activated calcium signaling in response to local stress.

Keywords: calcium signal; calmodulin; calmodulin-dependent kinases; fungi; mycelia.


Figures

Fig. 1.
Fig. 1.
Conduction of calcium signal in the cut mycelia. A) Image of calcium signal immediately after cutting the mycelium, from Video 1. The cut site is indicated by a gray line. According to the distance from the cut site, the regions were classified as near, middle and far. B) Time course of signal intensity of calcium signal in the hyphae near, middle and far from the cut site. mean ± SD; n = 5. C, D) Time variation of calcium signal propagation is indicated by different colors (C). Line profiles along arrow in (C) at different time are shown by different colors (D), mean ± SD; n = 3. E) Time course of signal intensity at different color boxes. Images of signal appearance at color boxes. The region is shown in (A) as the dot-line box. F) Images of calcium signal before and after cut the mycelial edge perpendicular to the hyphal growth direction from Video 2. The cut site is indicated by a gray line. G) Line profiles along the arrow. Mean ± SD; n = 3. H) Line profiles of calcium signal conduction in the 1-day, 2-, 7- and 14-days colonies. Mean ± SD; n = 3. Box plots of signals longest distance from the cut site. n = 14, 13 from 3, 4 independent experiments. I) The box area 800–1400 mm from the cut site. J) Image sequence of two frequent signal appearances. The region is shown in (I) as the dot-line box. K) Time course of signal intensity at different color circles in (J) at different time. L) Scatterplot of the time the signal appeared and the distance from the cut site. Different colors by different waves. M) Images of calcium signal after cut the mycelial edge in 7-days and 14-days colonies from Video 3. The cut site is indicated by a gray line. Line profiles along the arrow. Mean ± SD; n = 3. N) Image sequence of mycelial growth before and after the cut. O) Mycelial elongation rate at the area severed near hyphal tips, severed at the bottom of hyphae, and not severed. Mean ± SD; n = 3.
Fig. 2.
Fig. 2.
Conduction of calcium signal in the mycelia with a drop of EtOH or NaCl. A) Image of calcium signal immediately after a drop of EtOH, from Video S4. The drop site is indicated by a white circle. According to the distance from the drop site, the regions were classified as near, middle and far. B) Time course of signal intensity of calcium signal in the hyphae near, middle and far from the drop site. Mean ± SD; n = 5. C, D) Time variation of calcium signal propagation is indicated by different colors (C). Line profiles along arrow in (C) at different time are shown by different colors (D). Mean ± SD; n = 3. E) Blinking of calcium signal in the hyphae at color boxes. The region is shown in (A) as the dot-line box. F) Time course of signal intensity at different color boxes in (E). G) Image sequence and time course of signal intensity at the boxed in (E) are shown. Number of blinks are shown. H) Image of calcium signal immediately after a drop of NaCl. I) Time course of signal intensity of calcium signal in the hyphae near, middle and far from the drop site. Mean ± SD; n = 5. J, K) Time variation of calcium signal propagation is indicated by different colors (J). Line profiles along arrow in (J) at different time are shown by different colors (K). Mean ± SD; n = 3. L) Image sequence of spread of calcium signal in the hyphae. The spread is show by colored arrows. Time variation of diffusion distance are shown by colored line graph. M) Time course of signal intensity of calcium signal in the hyphae with cut, a drop of EtOH or NaCl. Mean ± SD; n = 5.
Fig. 3.
Fig. 3.
Calcium pulses in hyphae stimulated by point laser irradiation. A) Image sequence of calcium pulses after 10 s of pointed laser irradiation to the tip of the hypha (arrowhead) from Video S6. The elapsed time is given in seconds. Scale bar: 20 μm. (B) Kymograph along the hypha shown in (A). Total elapsed time 120 s. Scale bar: 20 μm. C) Box plots of the number of calcium pulse and the intervals of calcium pulses from hyphal tips after 5, 10, and 20 s laser irradiation (n = 10–14, n = 17–33, respectively). D) Box plots of duration, distance, and velocity of calcium singal from hyphal tips (n = 35 measurements for each) and at the middle of hyphae (n = 6 measurements for each). E) Image sequence of the calcium signal at the middle of the hypha from Video S7. The elapsed time is given in seconds. Scale bar: 20 μm. Total 120 s. F) Image sequence of calcium signal that reached and passed through the septa (arrows). The elapsed time is given in seconds. Scale bar: 20 μm. G) Ca2+ pulses in the surrounding hyphae (2–4) after the laser irradiation at (1, arrowhead). Line profiles of temporal changes in the calcium signal at each hyphal tip (1–4). Total 120 s. H) Image sequence of GFP-TpmA and change of growth direction after point laser irradiation (arrowhead). The elapsed time is given in seconds (left) and minutes (right). I) Images of F-actin and Ca2+ in hyphae treated with Cytochalasin A (actin polymerization inhibitor). Kymographs along the hyphae are shown. Total 120 s. Scale bar: 5 μm.
Fig. 4.
Fig. 4.
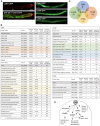
Localization and interacting proteins of CaM and CaMKs. A) Fluorescence image of GFP-labeled microtubules and CaM-RFP. Cytoplasmic localization of CmkA-GFP, CmkB-GFP, and CmkC-GFP in the hyphae. Scale bar: 10 μm. B) Proteins interacting with CaM, CmkA, CmkB, and CmkC. The table lists the protein name, gene ID, intensity of bait proteins and a negative control, and sequence coverage. The functional classification is shown by different colors. C) Venn diagram of proteins interacting with CaM, CmkA, CmkB, and CmkC. D) Summary of the calcium signaling pathway through CaM and CaMKs.

Similar articles

Cited by

References

    1. Riquelme M, et al. . 2018. Fungal morphogenesis, from the polarized growth of hyphae to complex reproduction and infection structures. Microbiol Mol Biol Rev. 82:e00068-17. - PMC - PubMed
    1. Fricker MD, Heaton LLM, Jones NS, Boddy L. 2017. The mycelium as a network. Microbiol Spectr. 5:3. - PMC - PubMed
    1. Heaton L, et al. . 2012. Analysis of fungal networks. Fung Biol Rev. 26:12–29.
    1. Rokas A. 2022. Evolution of the human pathogenic lifestyle in fungi. Nat Microbiol. 7:607–619. - PMC - PubMed
    1. Treseder KK, Lennon JT. 2015. Fungal traits that drive ecosystem dynamics on land. Microbiol Mol Biol Rev. 79:243–262. - PMC - PubMed