. 2023 Feb 3;2(3):pgad036.
doi: 10.1093/pnasnexus/pgad036. eCollection 2023 Mar.

The circadian control of tryptophan metabolism regulates the host response to pulmonary fungal infections

Affiliations

The circadian control of tryptophan metabolism regulates the host response to pulmonary fungal infections

Claudia Stincardini et al. PNAS Nexus. .

Abstract

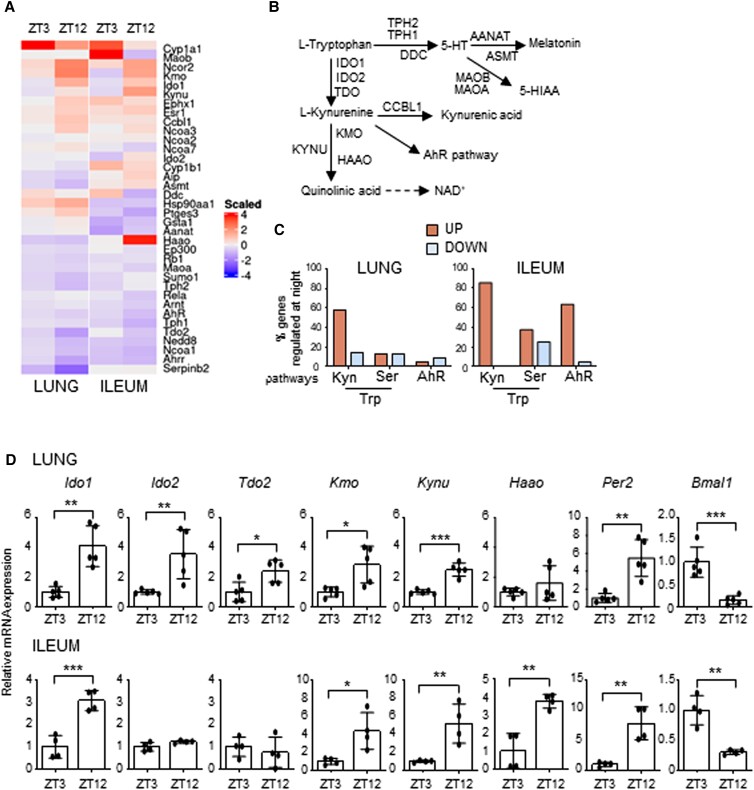
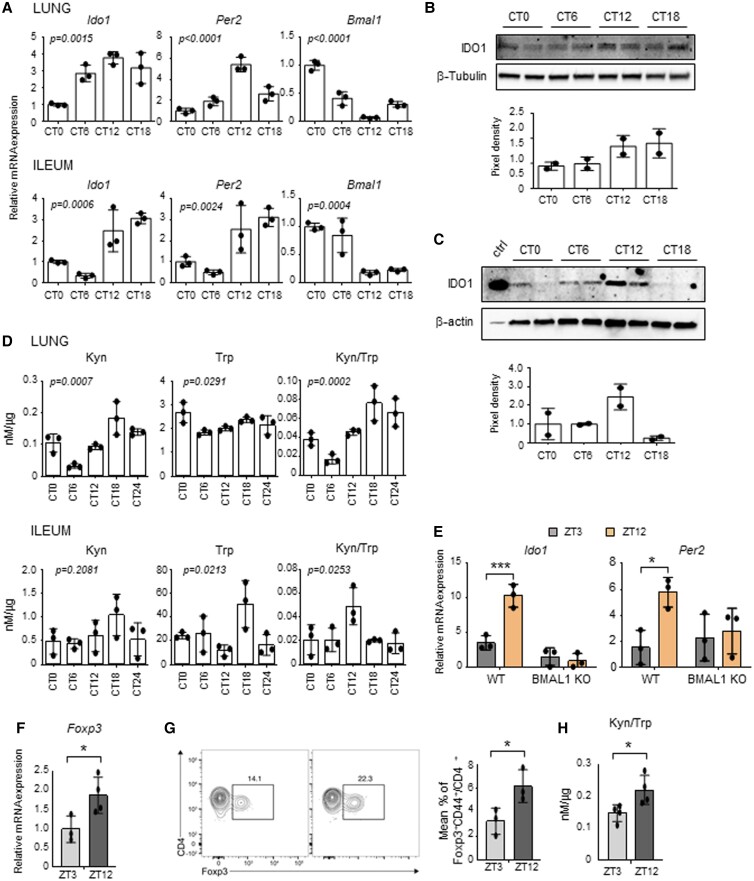
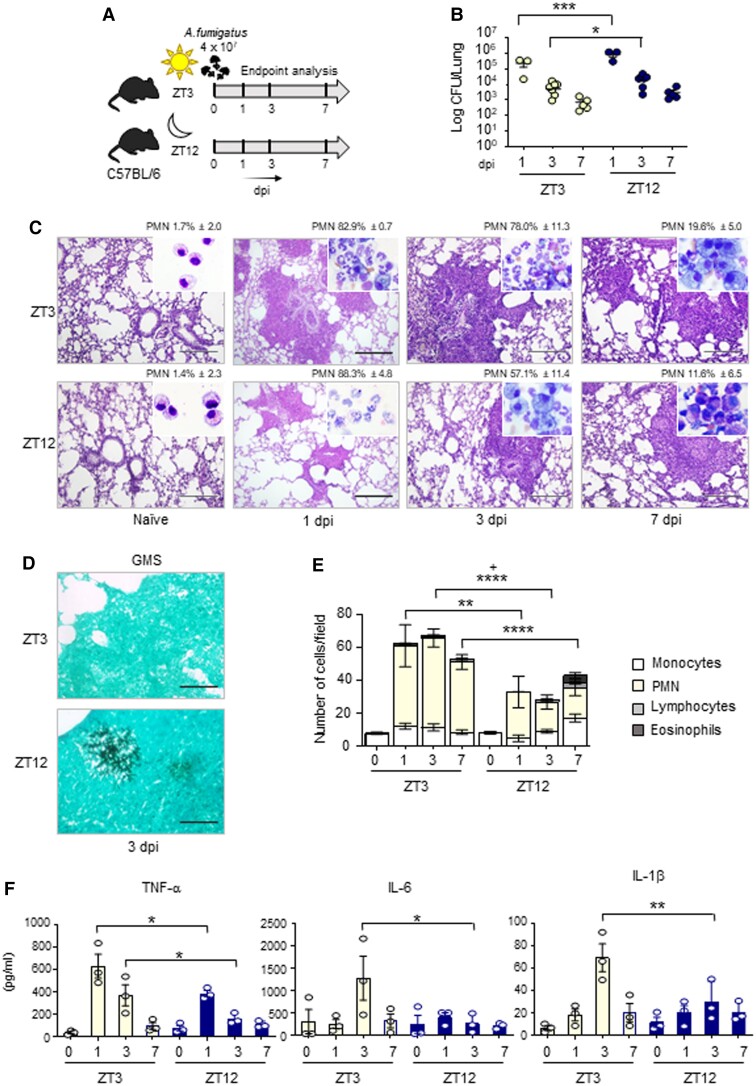
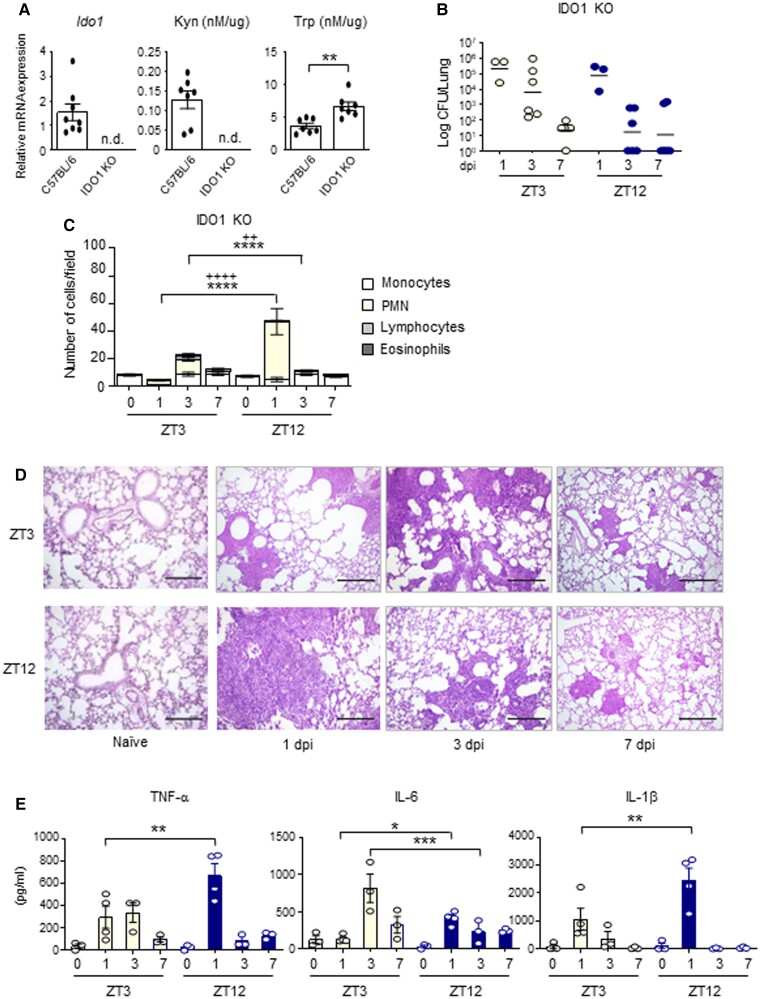
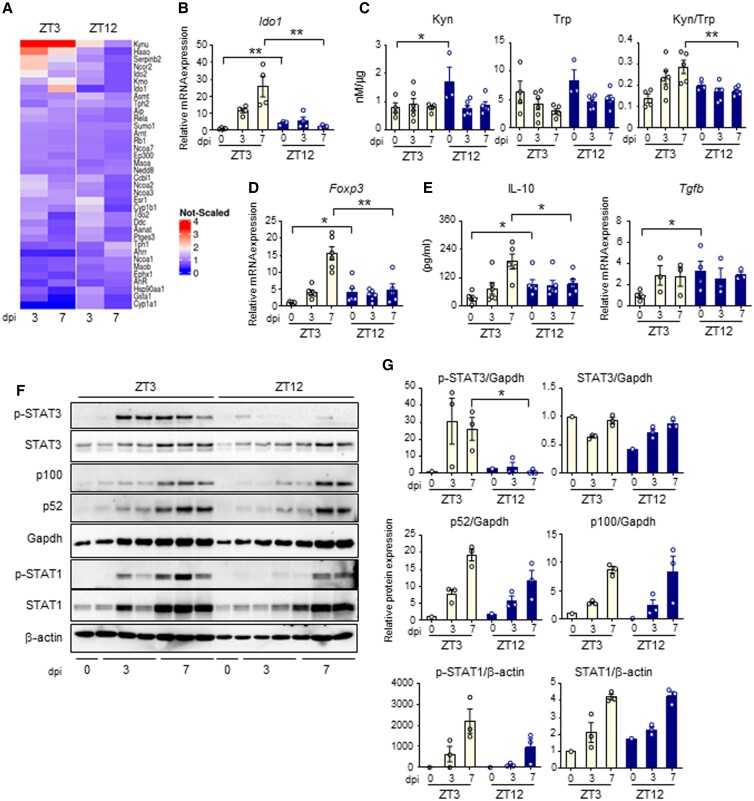
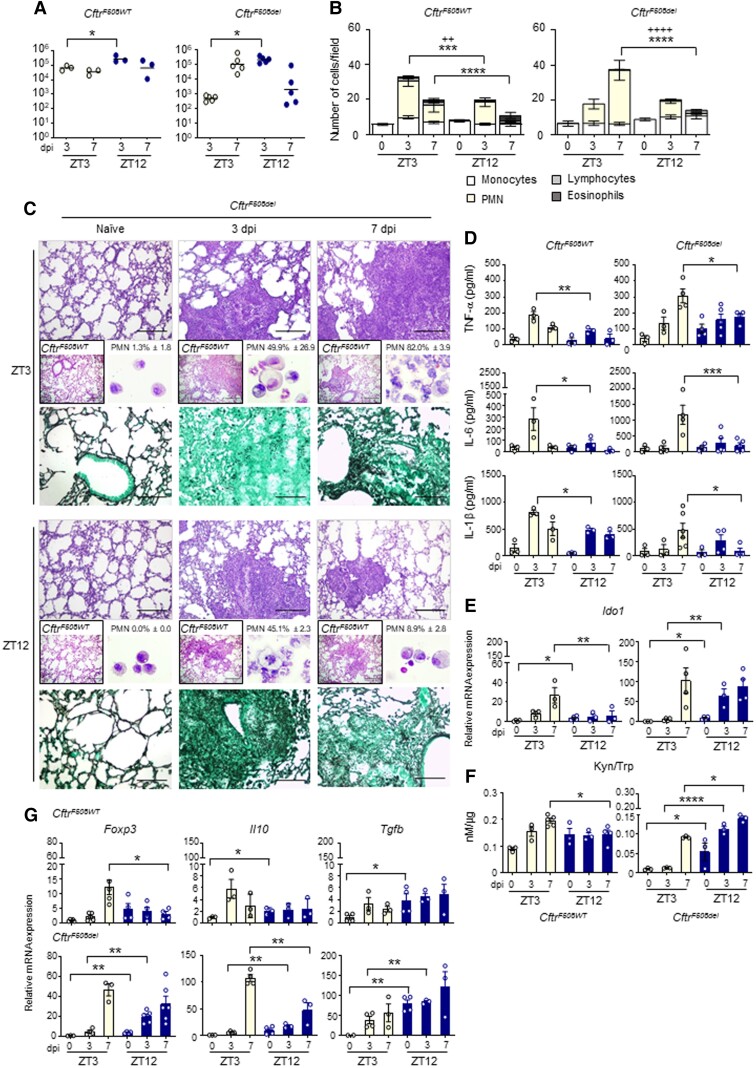
The environmental light/dark cycle has left its mark on the body's physiological functions to condition not only our inner biology, but also the interaction with external cues. In this scenario, the circadian regulation of the immune response has emerged as a critical factor in defining the host-pathogen interaction and the identification of the underlying circuitry represents a prerequisite for the development of circadian-based therapeutic strategies. The possibility to track down the circadian regulation of the immune response to a metabolic pathway would represent a unique opportunity in this direction. Herein, we show that the metabolism of the essential amino acid tryptophan, involved in the regulation of fundamental processes in mammals, is regulated in a circadian manner in both murine and human cells and in mouse tissues. By resorting to a murine model of pulmonary infection with the opportunistic fungus Aspergillus fumigatus, we showed that the circadian oscillation in the lung of the tryptophan-degrading enzyme indoleamine 2,3-dioxygenase (IDO)1, generating the immunoregulatory kynurenine, resulted in diurnal changes in the immune response and the outcome of fungal infection. In addition, the circadian regulation of IDO1 drives such diurnal changes in a pre-clinical model of cystic fibrosis (CF), an autosomal recessive disease characterized by progressive lung function decline and recurrent infections, thus acquiring considerable clinical relevance. Our results demonstrate that the circadian rhythm at the intersection between metabolism and immune response underlies the diurnal changes in host-fungal interaction, thus paving the way for a circadian-based antimicrobial therapy.

Keywords: Aspergillus fumigatus; IDO1; circadian rhythm; cystic fibrosis; kynurenines.


Figures

Fig. 1.
Fig. 1.
Time-of-day variation of the Trp metabolic pathway. (A) Heat diagram showing changes in gene expression detected by a custom QuantiGene plex gene expression assay in lungs and ilea of C57BL/6 wild-type mice collected at ZT3 and ZT12. Relative increase (red) or decrease (blue) of mRNA level is shown. Each time point includes three mice per group pooled before analysis. (B) Schematic representation of Trp metabolic pathways. (C) Diagram showing the % of genes whose basal levels are up- or down-regulated (>20%) at night versus day in the Trp-Kyn pathway, the Trp-Ser pathway or the downstream AhR pathway. (D) mRNA expression of Ido1, Ido2, Tdo2, Kmo, Kynu, Haao, Per2, and Bmal1 in lung (n = 5) and ileum (n = 4) of C57BL/6 mice collected at ZT3 and ZT12. Data represent means ± SD. Student's t-test, significant changes are shown. *P < 0.05, **P < 0.01, ***P < 0.001.
Fig. 2.
Fig. 2.
Circadian regulation of IDO1 expression and activity. (A-D) Lungs and ilea from C57BL/6 wild-type mice housed in constant darkness were collected at different circadian times (CT). A) Ido1, Per2 and Bmal1 expression profiles were analyzed by quantitative PCR. The values are relative to those of beta-actin mRNA levels at each CT. (B, C) Immunoblot and the relative densitometric analysis of IDO1 protein expression level was performed in lungs (B) and ilea (C). β-tubulin and β-actin were used as loading controls. Ctrl, IDO1 positive control. (D) Tissue homogenates were also assessed for kynurenine (Kyn) and tryptophan (Trp) levels, and Kyn/Trp ratio. All values are the mean ± SD (n = 3). One-way ANOVA, P-values are shown. E) Ido1 and Per2 gene expression were evaluated from ilea of villin-CRE conditional BMAL1 KO mice and isogenic wild-type taken at ZT3 and ZT12. The values are relative to those of 18S mRNA levels at each ZT. All values are the mean ± SD (n = 3). Two-way ANOVA, Bonferroni post-hoc test, significant changes are shown.*P < 0.05, ***P < 0.001. F-H) Quantification of Foxp3 mRNA levels (F), Foxp3+ T cells by flow cytometry (G) and Kyn/Trp ratio (H) in lungs collected at the indicated ZTs. In (F) the values are relative to those of beta-actin mRNA levels at each ZT. In (G) the flow plot shows the % of Foxp3+ gated on CD4+ CD44+. Bar graph shows the % of total CD4+ T cells that express Foxp3. All values are the mean ± SD (n = 3–4). Student's t-test, significant changes are shown. *P < 0.05.
Fig. 3.
Fig. 3.
Diurnal regulation of the host response to A. fumigatus infection. C57BL/6 wild-type mice (n = 3–7 mice per group from two independent experiments) were infected intranasally with live A. fumigatus conidia at two ZT, and assessed at 1, 3, and 7 day post-infection (dpi), as described in the experimental plan (A). (B) Lung fungal growth studied by the count of colony forming units (log10 CFU). Black bars indicate the geometric mean (n = 3–7). P-values were generated by two-way ANOVA test, Bonferroni post-hoc test, significant changes are shown. *P < 0.05, ***P < 0.001. (C) Lung histology studied by periodic acid–Schiff staining (left, scale bars 200 μm), and percentage of polymorphonuclear neutrophils studied by May–Grünwald Giemsa staining of cells obtained from BAL (insets). (D) Lung fungal infiltration at 3 dpi studied by Grocott-Gomori methenamine staining (right, scale bars 100 μm). (E) BAL cellular morphometry, expressed as means of total and differential cell counts ± SEM are presented. P-values were generated by two-way ANOVA test, Bonferroni post-hoc test, significant changes are shown. **P < 0.01, ****P < 0.0001 for PMN, +P < 0.05 for total cells. (E) Mouse pro-inflammatory cytokines measured by multiplex immunoassay in lung homogenates. Results shown as mean ± SEM (n = 3). P-values were generated by two-way ANOVA test, Bonferroni post-hoc test. Significant changes are shown. *P < 0.05, **P < 0.01.
Fig. 4.
Fig. 4.
IDO1-dependent day–night changes of the host response to A. fumigatus infection. (A) Ido1 gene expression, Kyn, and Trp levels in lung homogenates from WT and IDO1 KO mice. All values are the mean + SEM (n = 7–8). Student's t-test, significant changes are shown. **P < 0.01, n.d., not detectable. (B-E) IDO1 KO mice (n = 3–6 mice per group) were infected intranasally with live A. fumigatus conidia at two ZT, together with C57BL/6 wild-type described in Fig. 3. (B) Lung CFU were assessed at 1, 3, and 7 dpi in IDO1 KO. Black bars indicate the geometric mean (n = 3–6). P-values were generated by two-way ANOVA test, Bonferroni post-hoc test. No statistically significant changes were found. (C) BAL cellular morphometry, expressed as means of total and differential cell counts ± SEM are presented. P-values were generated by two-way ANOVA test, Bonferroni post-hoc test, significant changes are shown. ****P < 0.0001 for PMN, ++++ P < 0.0001 and ++ P < 0.01 for total cells. (D) Lung histology studied by periodic acid–Schiff staining. Scale bars 200 μm. In (E), mouse pro-inflammatory cytokines measured by multiplex immunoassay in lung homogenates of IDO1 KO mice. (n = 3–4). All the values are the mean ± SEM, *P < 0.05, **P < 0.01, ***P < 0.001. Two-way ANOVA, Bonferroni post-hoc test.
Fig. 5.
Fig. 5.
Day–night induction of the IDO1-kyn pathway during A. fumigatus infection. (A) Heat diagram showing changes in gene expression detected by a custom QuantiGene plex gene expression assay in lungs of C57BL/6 WT mice infected at ZT3 and ZT12 as in the experimental plan of Fig. 3A. Relative increase (red) or decrease (blue) of mRNA level is shown. (B-E) Evaluation of Ido1 (B), Kyn, Trp and Kyn/Trp ratio (C), Foxp3 (D), IL-10 and Tgfb production (E) in lung homogenates from C57BL/6 mice collected at the indicated time points. All the values are the mean ± SEM (n = 3–8), *P < 0.05, **P < 0.01. Two-way ANOVA, Bonferroni post-hoc test and Student's t-test. (F-G) Evaluation of JAK-STAT pathway (p-STAT3, STAT3, p-STAT1, STAT1) and non-canonical NF-kB pathway (p100/p52) through immunoblotting in lung homogenates. Diagrams on the right show densitometric analysis. All the values are the mean ± SEM (n = 3), Student's t-test, *P < 0.05.
Fig. 6.
Fig. 6.
Circadian IDO1 modulates the response to A. fumigatus infection in CF mice. Homozygous F508del-Cftr C57BL/6 mice (referred to as CftrF508del mice) and isogenic WT (CftrWT) were infected at ZT3 and ZT12 and assessed at 3 and 7 dpi. (A) Fungal growth in the lung (log10 CFU). Black bars indicate the geometric mean (n = 3–5). P-values were generated by two-way ANOVA test, Bonferroni post-hoc test, significant changes are shown. *P < 0.05. (B) BAL cellular morphometry expressed as means of total and differential cell counts ± SEM are presented. P-values were generated by two-way ANOVA test, Bonferroni post-hoc test, significant changes are shown. ***P < 0.001, ****P < 0.0001 for PMN, ++P < 0.01, ++++P < 0.0001 for total cells. (C) Lung histology studied by periodic acid–Schiff staining in CftrWT (left boxed insets) and CftrF508del mice (scale bars 200 μm); lung fungal infiltration studied by Grocott-Gomori's methenamine silver stain (scale bars 100 μm) and percentage of polymorphonuclear neutrophils studied by May–Grünwald Giemsa staining of cells obtained from BAL (right insets) in CftrF508del mice. (D) Mouse pro-inflammatory cytokines measured by multiplex immunoassay in lung homogenates. Results shown as mean ± SEM (n = 3–6). P-values were generated by two-way ANOVA test, Bonferroni post-hoc test. Significant changes are shown. *P < 0.05, **P < 0.01, ***P < 0.001. (E-G) Ido1 mRNA expression (E) and activity (F), Foxp3, Il10 and Tgfb gene expression in lung homogenates (G). The values are the mean ± SEM (n = 3–6). Two-way ANOVA, Bonferroni post-hoc test and Student's t-test, significant changes are shown, *P < 0.05, **P < 0.01, ***P < 0.001.

Similar articles

Cited by

  • Circadian metabolic adaptations to infections.
    Costantini C, Brancorsini S, Grignani F, Romani L, Bellet MM. Costantini C, et al. Philos Trans R Soc Lond B Biol Sci. 2025 Jan 23;380(1918):20230473. doi: 10.1098/rstb.2023.0473. Epub 2025 Jan 23. Philos Trans R Soc Lond B Biol Sci. 2025. PMID: 39842481 Review.
  • Crosstalk between circadian clocks and pathogen niche.
    Borrmann H, Rijo-Ferreira F. Borrmann H, et al. PLoS Pathog. 2024 May 9;20(5):e1012157. doi: 10.1371/journal.ppat.1012157. eCollection 2024 May. PLoS Pathog. 2024. PMID: 38723104 Free PMC article. Review.

References

    1. Mohawk JA, Green CB, Takahashi JS. 2012. Central and peripheral circadian clocks in mammals. Annu Rev Neurosci. 35:445–462. - PMC - PubMed
    1. Scheiermann C, Gibbs J, Ince L, Loudon A. 2018. Clocking in to immunity. Nat Rev Immunol. 18(7):423–437. - PubMed
    1. Curtis AM, Bellet MM, Sassone-Corsi P, O'Neill LA. 2014. Circadian clock proteins and immunity. Immunity. 40(2):178–186. - PubMed
    1. Nguyen KD, et al. . 2013. Circadian gene Bmal1 regulates diurnal oscillations of Ly6C(hi) inflammatory monocytes. Science. 341(6153):1483–1488. - PMC - PubMed
    1. Bellet MM, et al. . 2013. Circadian clock regulates the host response to Salmonella. Proc Natl Acad Sci U S A. 110(24):9897–9902. - PMC - PubMed