. 2023 Jan 21;2(3):pgad011.
doi: 10.1093/pnasnexus/pgad011. eCollection 2023 Mar.

Mechanisms of pathogenicity in the hypertrophic cardiomyopathy-associated TPM1 variant S215L

Affiliations

Mechanisms of pathogenicity in the hypertrophic cardiomyopathy-associated TPM1 variant S215L

Saiti S Halder et al. PNAS Nexus. .

Abstract

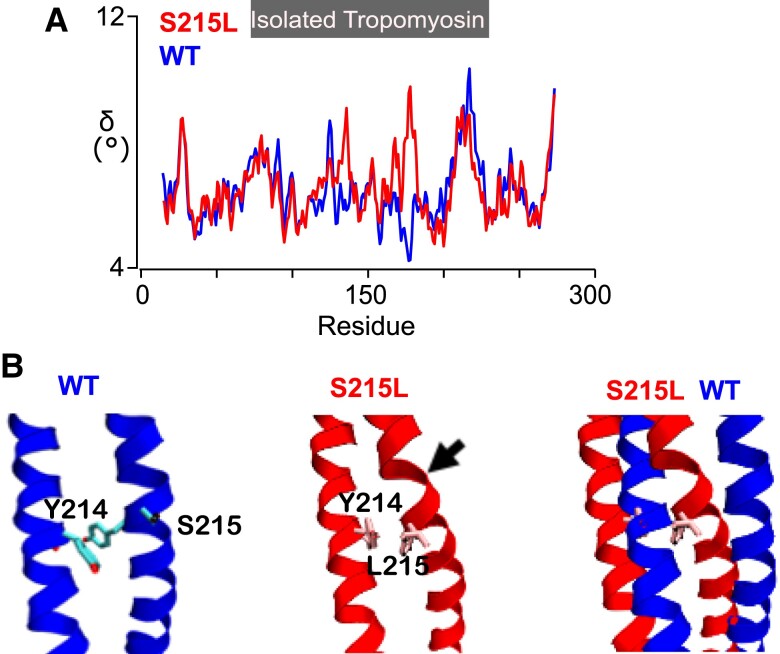
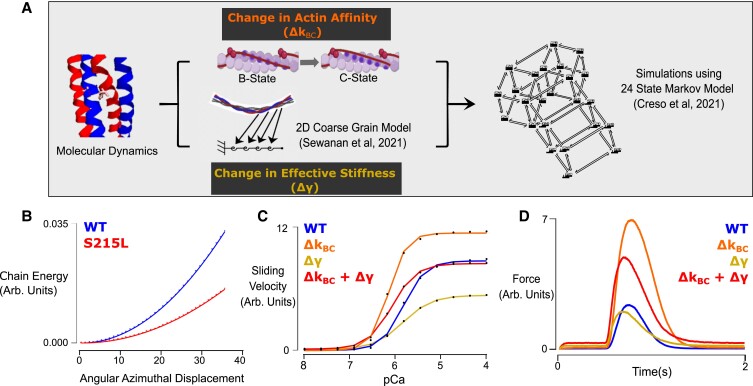
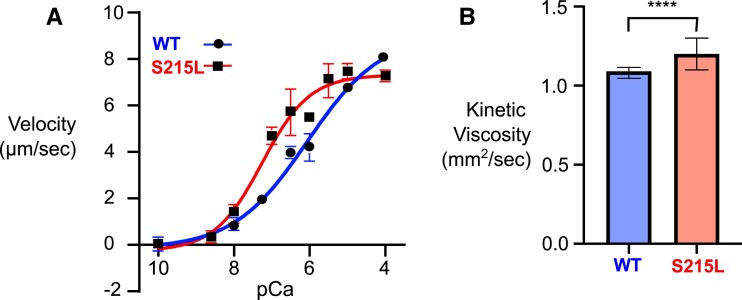
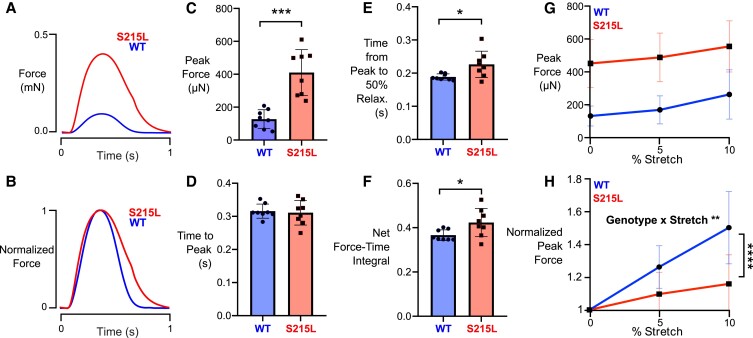
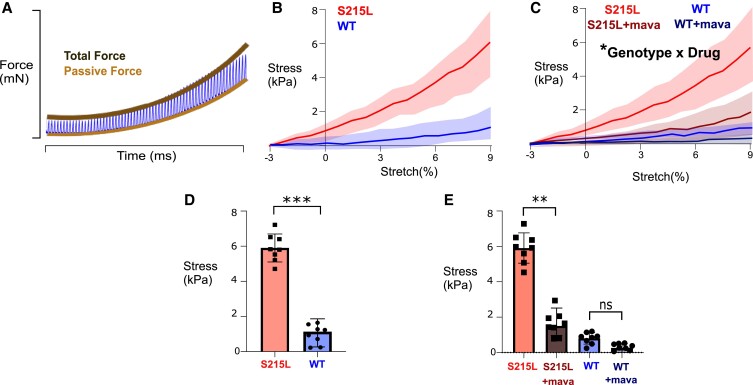
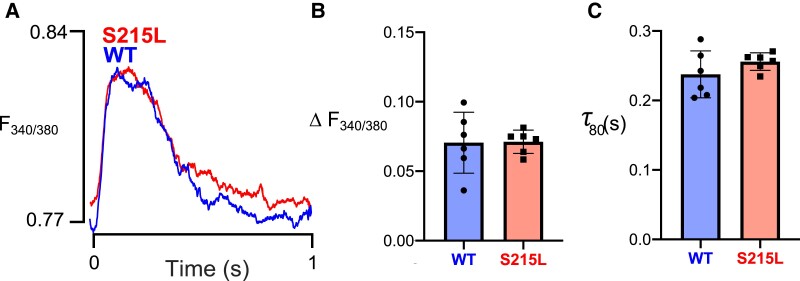
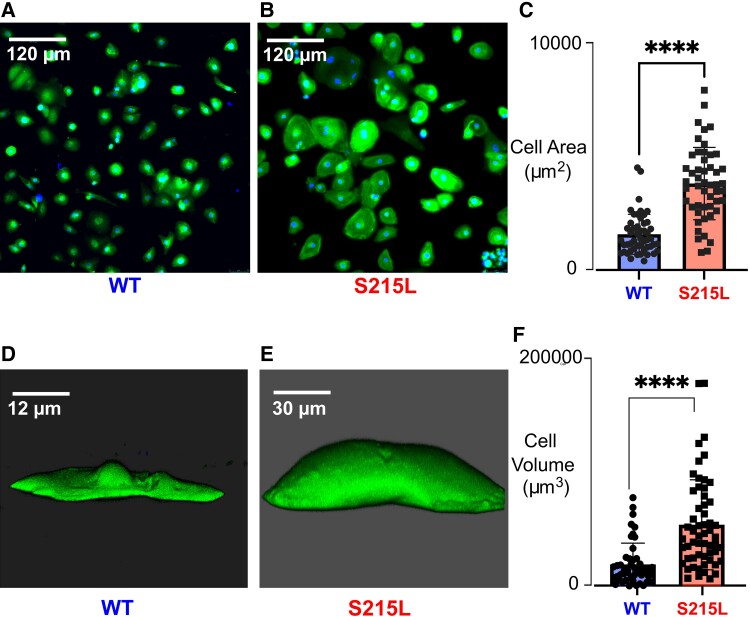
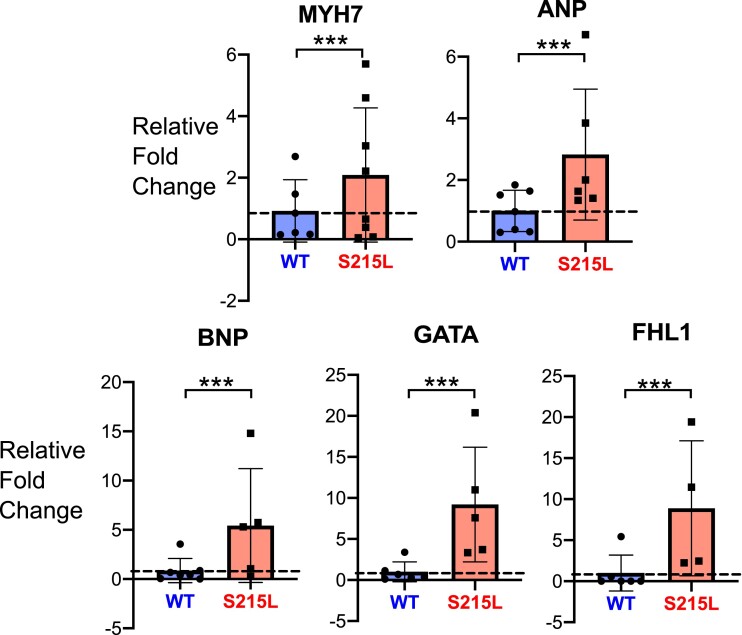
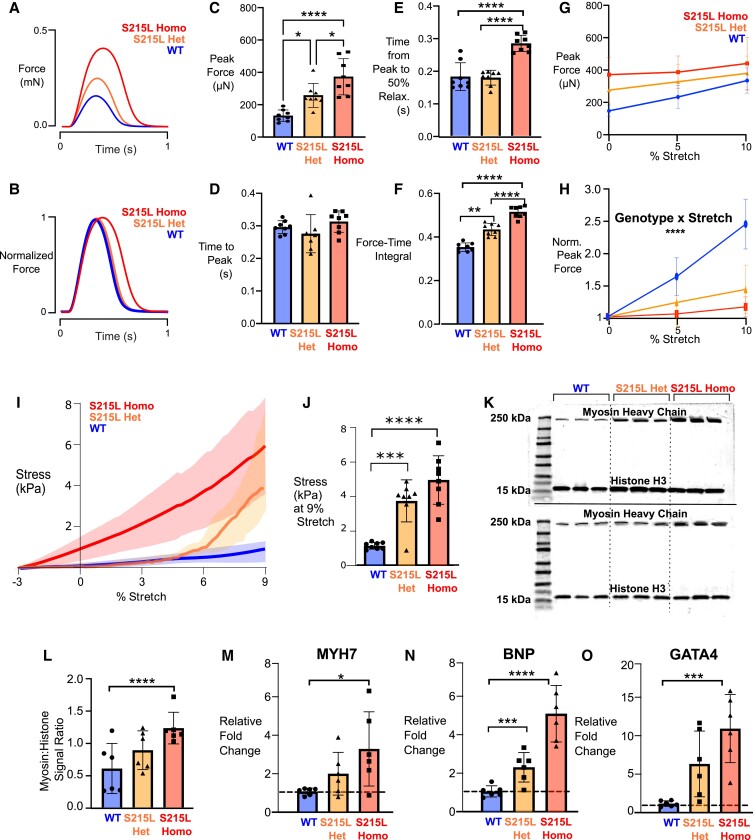
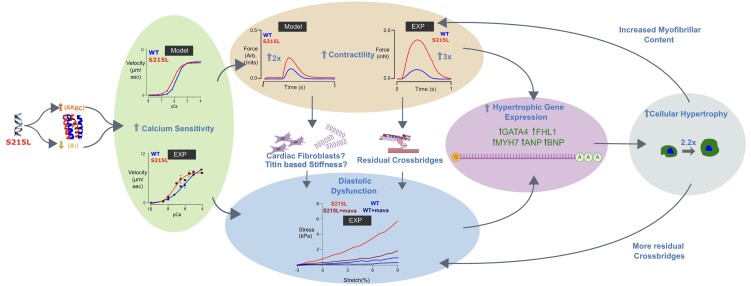
Hypertrophic cardiomyopathy (HCM) is an inherited disorder often caused by mutations to sarcomeric genes. Many different HCM-associated TPM1 mutations have been identified but they vary in their degrees of severity, prevalence, and rate of disease progression. The pathogenicity of many TPM1 variants detected in the clinical population remains unknown. Our objective was to employ a computational modeling pipeline to assess pathogenicity of one such variant of unknown significance, TPM1 S215L, and validate predictions using experimental methods. Molecular dynamic simulations of tropomyosin on actin suggest that the S215L significantly destabilizes the blocked regulatory state while increasing flexibility of the tropomyosin chain. These changes were quantitatively represented in a Markov model of thin-filament activation to infer the impacts of S215L on myofilament function. Simulations of in vitro motility and isometric twitch force predicted that the mutation would increase Ca2+ sensitivity and twitch force while slowing twitch relaxation. In vitro motility experiments with thin filaments containing TPM1 S215L revealed higher Ca2+ sensitivity compared with wild type. Three-dimensional genetically engineered heart tissues expressing TPM1 S215L exhibited hypercontractility, upregulation of hypertrophic gene markers, and diastolic dysfunction. These data form a mechanistic description of TPM1 S215L pathogenicity that starts with disruption of the mechanical and regulatory properties of tropomyosin, leading thereafter to hypercontractility and finally induction of a hypertrophic phenotype. These simulations and experiments support the classification of S215L as a pathogenic mutation and support the hypothesis that an inability to adequately inhibit actomyosin interactions is the mechanism whereby thin-filament mutations cause HCM.

Keywords: engineered heart tissue; hypertrophic cardiomyopathy; tropomyosin.


Figures

Fig. 1.
Fig. 1.
Molecular dynamics simulations. A) A comparison of mutation-induced local changes in flexibility (δ) of isolated tropomyosin (TPM1). B) A detailed view of the isolated TPM1 structure: WT (left), S215L (center), and overlay (right). Arrow indicates the position where a bend in the TPM1 chain is observed.
Fig. 2.
Fig. 2.
Computational modeling. A) A schematic explaining which parameter changes were considered and how they were calculated. B) Chain energy vs. azimuthal displacement showing decreased effective stiffness of S215L calculated using the 2D coarse-grain model. (C) Steady-state simulation and (D) Isometric twitch simulation using 24-state Markov model.
Fig. 3.
Fig. 3.
In vitro assays. A) In vitro motility assay showing increase in Ca sensitivity for S215L. B) Increase in kinetic viscosity in S215L.
Fig. 4.
Fig. 4.
Basic twitch properties of WT and S215L EHTs while pacing at 1 Hz. A, B) Sample force traces. C) Peak force. D) Time from start of stimulus to peak force. E) Time from peak to 50% relaxation. F) Net force time integral. G) Length-dependent activation of EHTs showing peak forces at 0, 5, and 10% stretch. No statistical test performed. H) Length-dependent activation of EHTs showing normalized peak forces (data from each EHT normalized to its own peak force at culture length, i.e. 0% stretch). Curves significantly different by two-way ANOVA, significant interaction between stretch and genotype (P = 0.0069). Result of post-hoc pairwise comparison indicated on the graph.
Fig. 5.
Fig. 5.
Detailed analysis of diastolic forces in WT and mutant EHTs. A) A schematic showing the sample force trace as the stretch is applied. B) Passive stress in WT and S215L EHTs (N = 8, curves significantly different by two-way ANOVA). C) Passive stress in WT and S215L EHTs followed by 30 min of 2 µM mavacamten treatment [N = 8, curves significantly different by three-way ANOVA; significant interaction of genotype × drug (P = 0.0167)]. D) Stress values at 9% stretch showing results for Tukey post hoc of graph shown in B. E) Stress values at 9% stretch showing results for Tukey post hoc of graph shown in C. The shaded areas in B and C represent the standard deviation of individual tissue data.
Fig. 6.
Fig. 6.
A) Sample calcium transient observed in the EHTs. Calcium handling properties: (B) change in F340/F380 ratio and (C) τ80 (time decay constant calculated after fitting an exponential decay curve starting from 80% of maximal value).
Fig. 7.
Fig. 7.
Cell size comparison in 2D and 3D. Immunofluorescent staining of cardiac troponin T (green) and DAPI (blue) on a monolayer of iPSC-CM cells (A) WT and (B) S215L. (C) Cell area measurement for 50 cells. 3D reconstruction of CellTracker Live Imaging (green) of (D) WT and (E) S215L cells combining Z-stacks captured using a laser confocal microscope. (F) Cell volume measurement for 50 cells.
Fig. 8.
Fig. 8.
Hypertrophic gene expression profile of EHTs showing relative fold change for: myosin heavy chain 7 (MYH7), atrial natriuretic peptide (ANP), brain natriuretic peptide (BNP), GATA-binding protein 4 (GATA4), four-and-a-half LIM domain protein-1 (FHL1).
Fig. 9.
Fig. 9.
Comparison of wild type (WT), S215L heterozygous (S215L het), and S215L homozygous (S215L homo) EHTs. A and B) Sample force traces. C) Peak force. D) Time from start of stimulus to peak force. E) Time from peak to 50% relaxation. F) Net force time integral. G) Length-dependent activation of EHTs showing peak forces at 0, 5, and 10% stretch. No statistical test performed. H) Length-dependent activation of EHTs showing normalized peak forces (data from each EHT normalized to its own peak force at culture length i.e. 0% stretch). Curves significantly different by two-way ANOVA, significant interaction between stretch and genotype (P < 0.0001). Result of post-hoc pairwise comparison indicated on the graph. I) Passive stress in WT, S215L het, and S215L homo EHTs (N = 8, curves significantly different by two-way ANOVA). The shaded areas represent the standard deviation of individual tissue data. J) Stress values at 9% stretch showing results for Tukey post hoc of graph shown in I. K) Two western blots showing the myosin heavy chain and histone H3 bands. L) The myosin/histone signal ratios calculated from the two blots shown in I. M–O) Hypertrophic gene expression profile of EHTs showing relative fold change for: myosin heavy chain 7 (MYH7), brain natriuretic peptide (BNP) and GATA-binding protein 4 (GATA4).
Fig. 10.
Fig. 10.
A schematic depicting the probable pathological mechanism in S215L.

Similar articles

Cited by

References

    1. Yotti R, Seidman CE, Seidman JG. 2019. Advances in the genetic basis and pathogenesis of sarcomere cardiomyopathies. Annu Rev Genomics Hum Genet. 20:129–153. - PubMed
    1. Kaltman JR, et al. . 2011. Screening for sudden cardiac death in the young: report from a national heart, lung, and blood institute working group. Circulation 123(17):1911–1918. - PubMed
    1. Risgaard B. 2016. Sudden cardiac death: a nationwide cohort study among the young. Dan Med J. 63(12):B5321. - PubMed
    1. Lynge TH, et al. . 2016. Cardiac symptoms before sudden cardiac death caused by hypertrophic cardiomyopathy: a nationwide study among the young in Denmark. Europace 18(12):1801–1808. - PubMed
    1. Jacoby DL, DePasquale EC, McKenna WJ. 2013. Hypertrophic cardiomyopathy: diagnosis, risk stratification and treatment. CMAJ 185(2):127–134. - PMC - PubMed