

Nanogap traps for passive bacteria concentration and single-point confocal Raman spectroscopy
- PMID: 36896354
- PMCID: PMC9991444
- DOI: 10.1063/5.0142118
Nanogap traps for passive bacteria concentration and single-point confocal Raman spectroscopy
Abstract
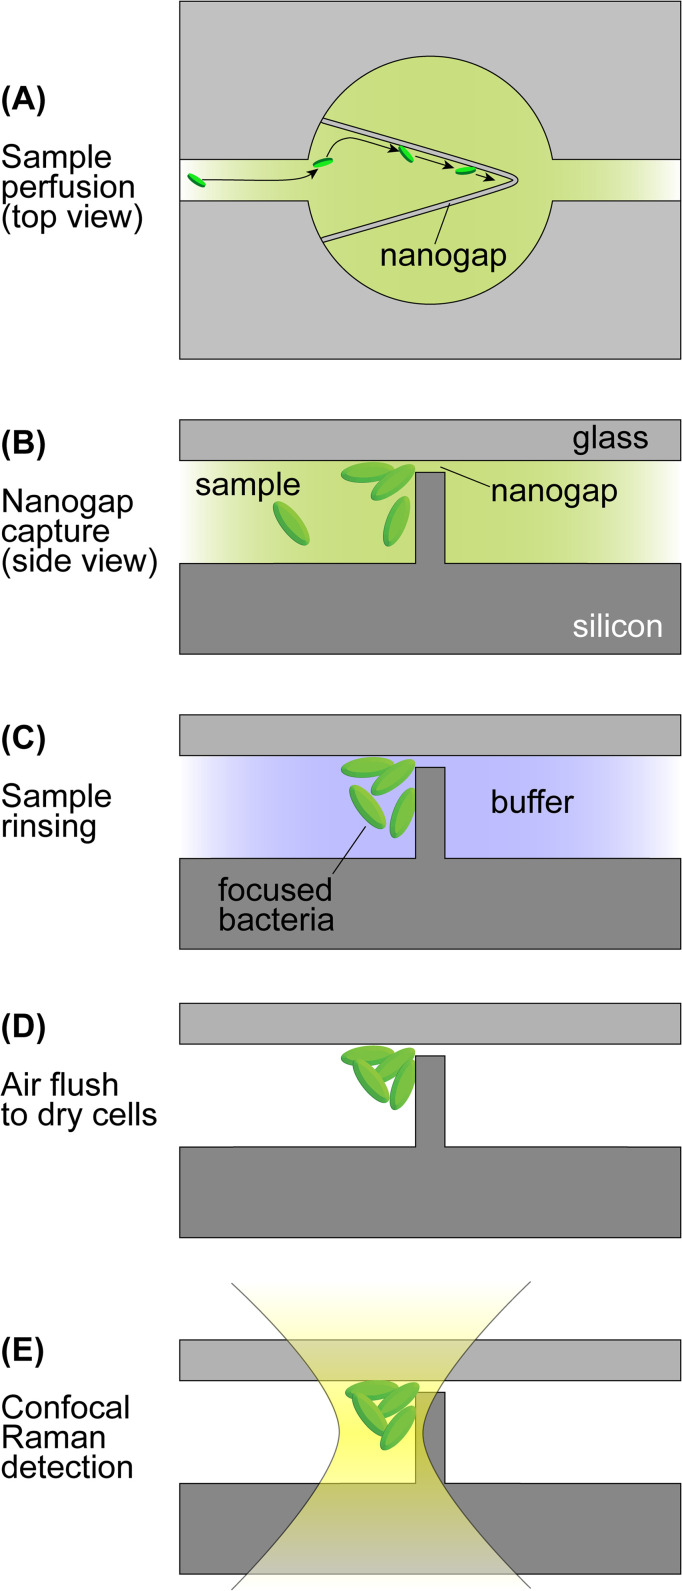
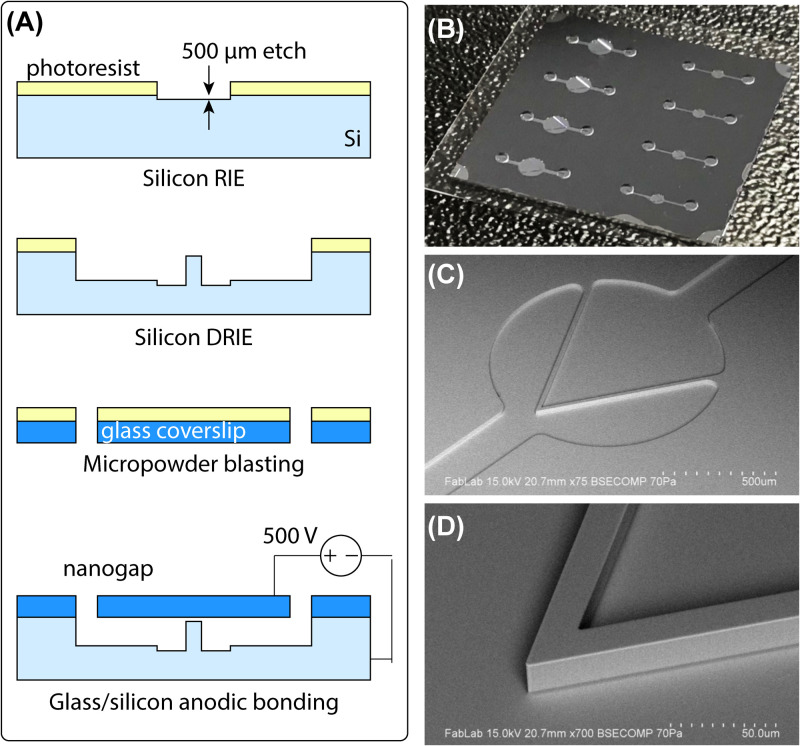
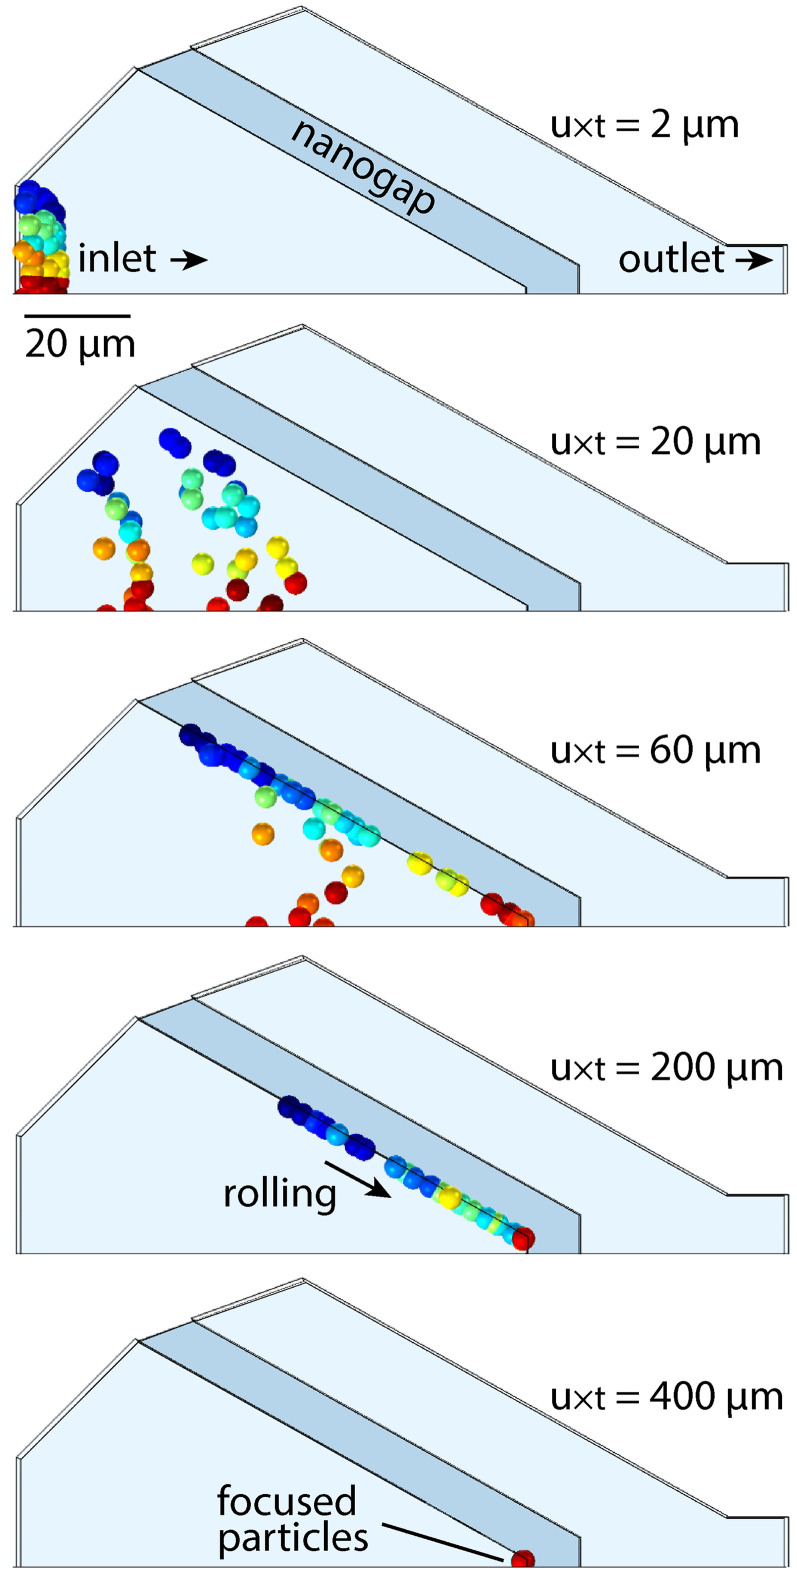
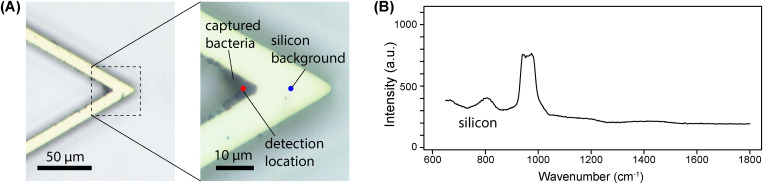
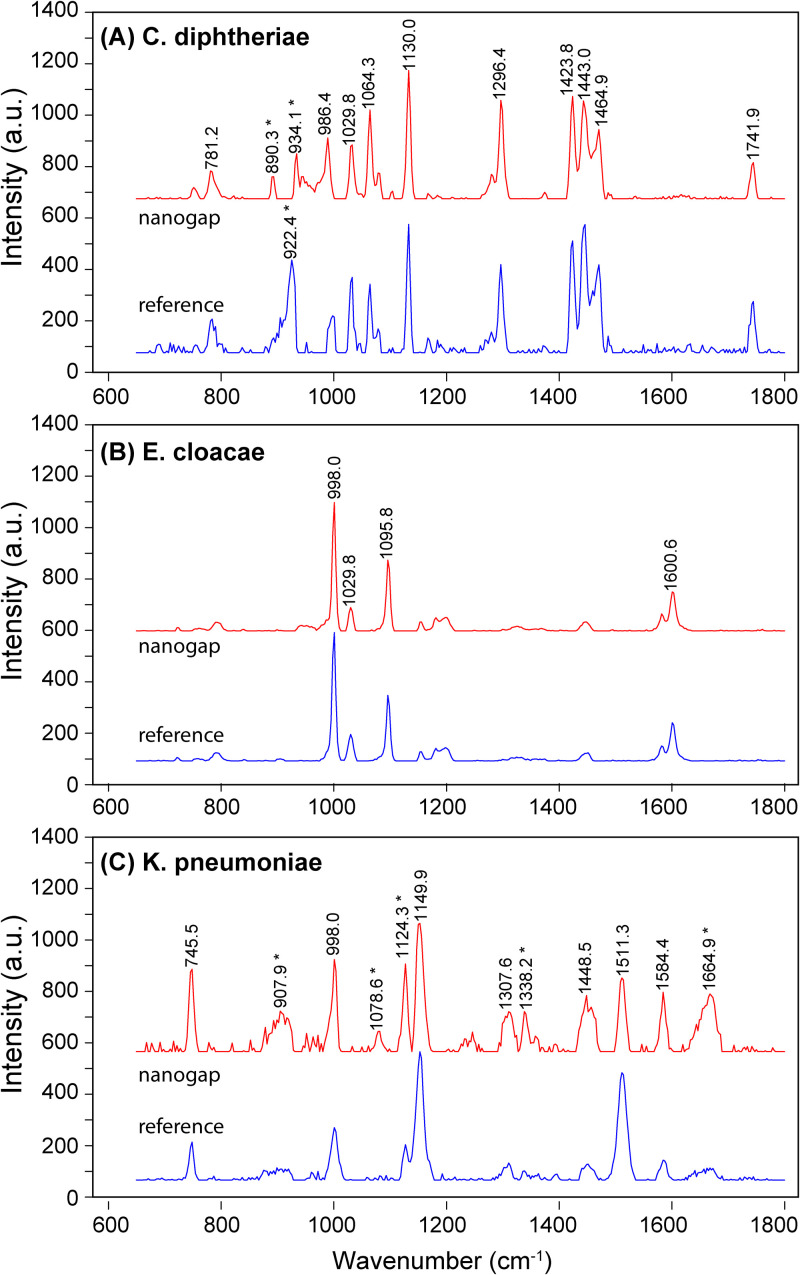
A microfluidic device enabling the isolation and concentration of bacteria for analysis by confocal Raman spectroscopy is presented. The glass-on-silicon device employs a tapered chamber surrounded by a 500 nm gap that serves to concentrate cells at the chamber apex during sample perfusion. The sub-micrometer gap retains bacteria by size exclusion while allowing smaller contaminants to pass unimpeded. Concentrating bacteria within the fixed volume enables the use of single-point confocal Raman detection for the rapid acquisition of spectral signatures for bacteria identification. The technology is evaluated for the analysis of E. cloacae, K. pneumoniae, and C. diphtheriae, with automated peak extraction yielding distinct spectral fingerprints for each pathogen at a concentration of 103 CFU/ml that compare favorably with spectra obtained from significantly higher concentration reference samples evaluated by conventional confocal Raman analysis. The nanogap technology offers a simple, robust, and passive approach to concentrating bacteria from dilute samples into well-defined optical detection volumes, enabling rapid and sensitive confocal Raman detection for label-free identification of focused cells.
© 2023 Author(s).
Figures
Similar articles
-
Tumour cell identification by means of Raman spectroscopy in combination with optical traps and microfluidic environments.Lab Chip. 2011 Apr 21;11(8):1484-90. doi: 10.1039/c0lc00612b. Epub 2011 Feb 22. Lab Chip. 2011. PMID: 21340095
-
Integration of a nanostructured dielectrophoretic device and a surface-enhanced Raman probe for highly sensitive rapid bacteria detection.Nanoscale. 2015 Feb 28;7(8):3726-36. doi: 10.1039/c4nr07183b. Nanoscale. 2015. PMID: 25641315
-
Noise Sources and Requirements for Confocal Raman Spectrometers in Biosensor Applications.Sensors (Basel). 2021 Jul 27;21(15):5067. doi: 10.3390/s21155067. Sensors (Basel). 2021. PMID: 34372304 Free PMC article.
-
Recent Progress of Surface-Enhanced Raman Spectroscopy for Bacteria Detection.Biosensors (Basel). 2023 Mar 6;13(3):350. doi: 10.3390/bios13030350. Biosensors (Basel). 2023. PMID: 36979564 Free PMC article. Review.
-
Isolation and identification of bacteria by means of Raman spectroscopy.Adv Drug Deliv Rev. 2015 Jul 15;89:105-20. doi: 10.1016/j.addr.2015.04.006. Epub 2015 Apr 17. Adv Drug Deliv Rev. 2015. PMID: 25895619 Review.
Cited by
-
Constrained Volume Micro- and Nanoparticle Collection Methods in Microfluidic Systems.Micromachines (Basel). 2024 May 25;15(6):699. doi: 10.3390/mi15060699. Micromachines (Basel). 2024. PMID: 38930668 Free PMC article. Review.
-
Development of a Mass-Producible Microfluidic Device for Single and Bulk Mycobacteria Investigations.Biosensors (Basel). 2025 Feb 13;15(2):108. doi: 10.3390/bios15020108. Biosensors (Basel). 2025. PMID: 39997010 Free PMC article.
-
Raman-Activated, Interactive Sorting of Isotope-Labeled Bacteria.Sensors (Basel). 2024 Jul 11;24(14):4503. doi: 10.3390/s24144503. Sensors (Basel). 2024. PMID: 39065901 Free PMC article.
References
-
- CDC, “Antibiotic resistance threats in the United States,” Report (U.S. Department of Health and Human Services, CDC, Atlanta, GA, U.S.A., 2019).
-
- Maurer F. P., Christner M., Hentschke M., and Rohde H., “Advances in rapid identification and susceptibility testing of bacteria in the clinical microbiology laboratory: Implications for patient care and antimicrobial stewardship programs,” Infect. Dis. Rep. 9, 6839 (2017). 10.4081/idr.2017.6839 - DOI - PMC - PubMed
-
- Lipsky B. A., Dryden M., Gottrup F., Nathwani D., Seaton R. A., and Stryja J., “Antimicrobial stewardship in wound care: A position paper from the British society for antimicrobial chemotherapy and European wound management association,” J. Antimicrob. Chemother. 71, 3026–3035 (2016). 10.1093/jac/dkw287 - DOI - PubMed
LinkOut - more resources
Full Text Sources
Miscellaneous