

An application of artificial intelligence for investigating the effect of COVID-19 lockdown on three-dimensional temperature variation in equatorial Africa
- PMID: 36896455
- PMCID: PMC8744409
- DOI: 10.1016/j.gsf.2021.101318
An application of artificial intelligence for investigating the effect of COVID-19 lockdown on three-dimensional temperature variation in equatorial Africa
Abstract
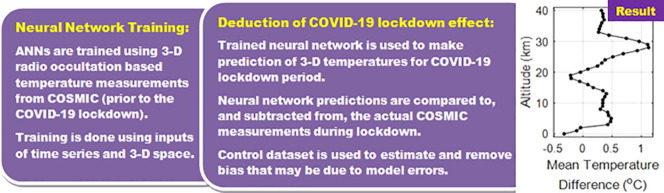
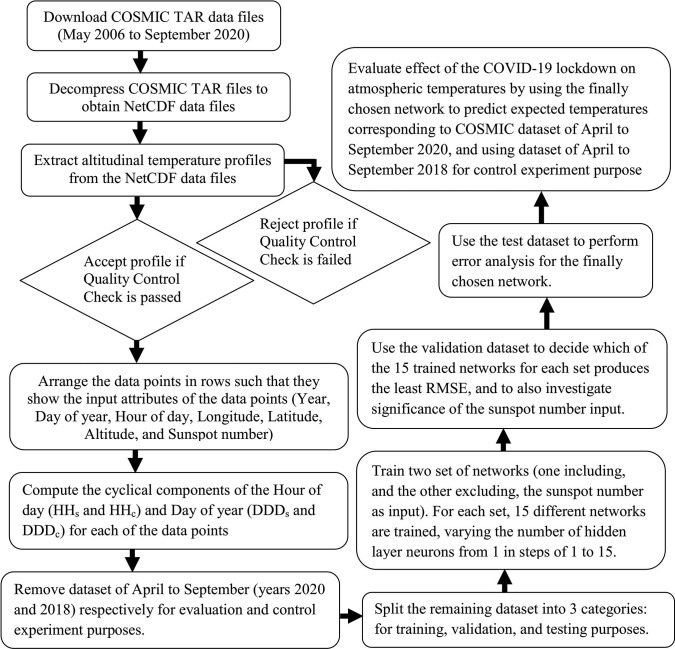
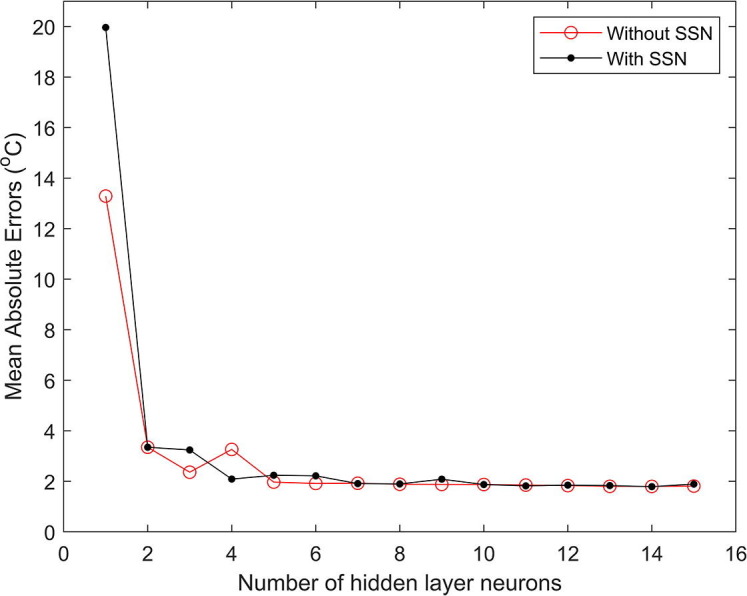
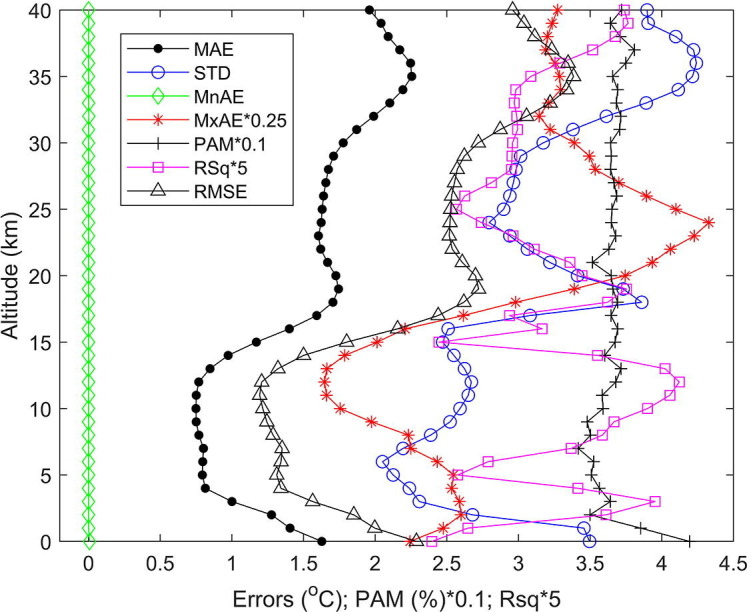
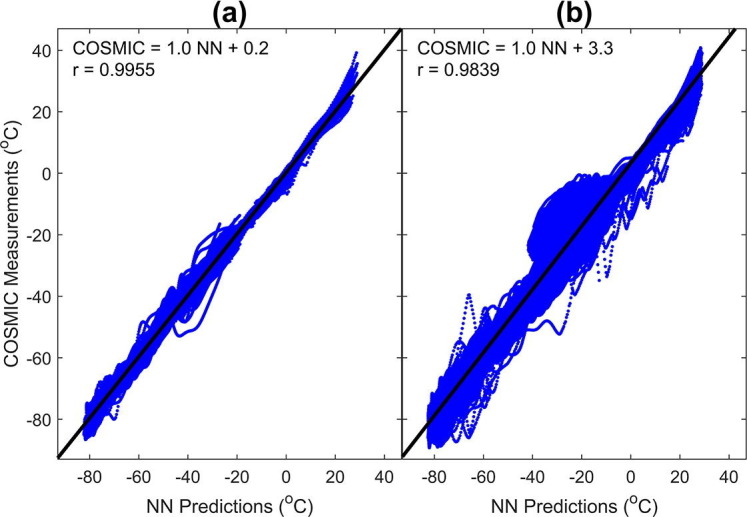
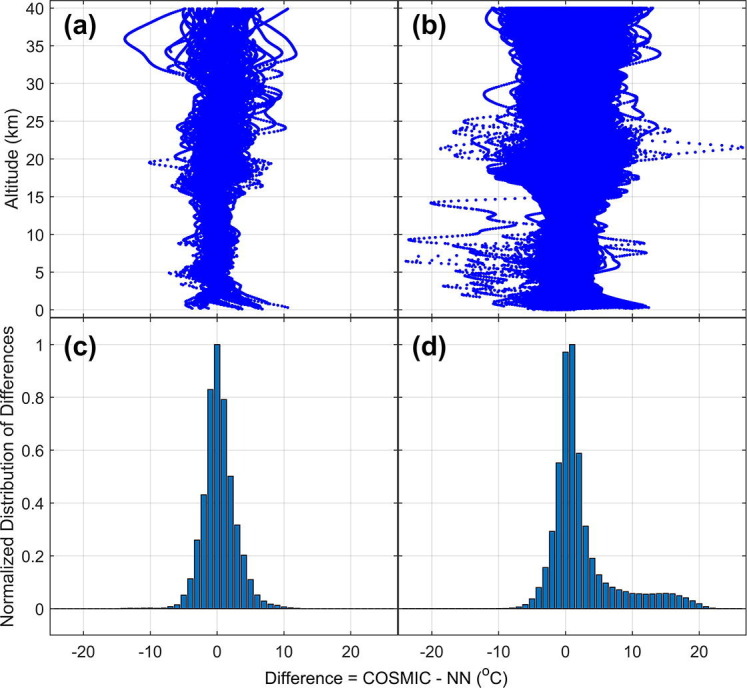
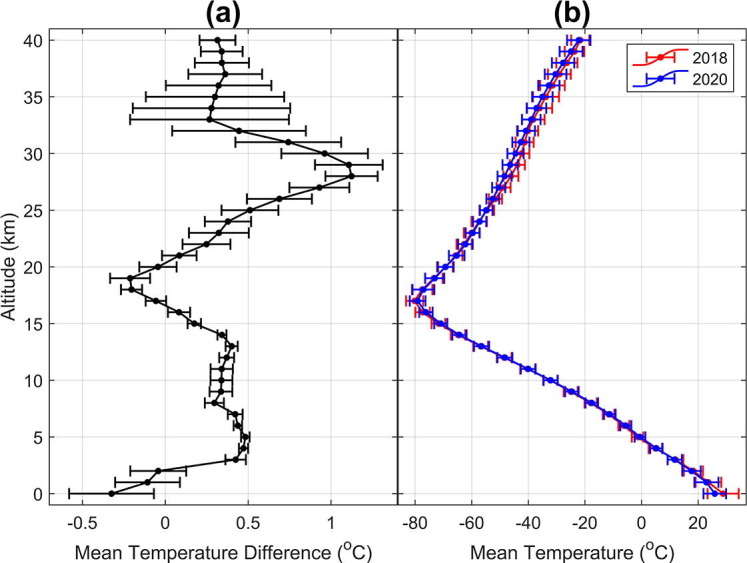
We present interesting application of artificial intelligence for investigating effect of the COVID-19 lockdown on 3-dimensional temperature variation across Nigeria (2°-15° E, 4°-14° N), in equatorial Africa. Artificial neural networks were trained to learn time-series temperature variation patterns using radio occultation measurements of atmospheric temperature from the Constellation Observing System for Meteorology, Ionosphere, and Climate (COSMIC). Data used for training, validation and testing of the neural networks covered period prior to the lockdown. There was also an investigation into the viability of solar activity indicator (represented by the sunspot number) as an input for the process. The results indicated that including the sunspot number as an input for the training did not improve the network prediction accuracy. The trained network was then used to predict values for the lockdown period. Since the network was trained using pre-lockdown dataset, predictions from the network are regarded as expected temperatures, should there have been no lockdown. By comparing with the actual COSMIC measurements during the lockdown period, effects of the lockdown on atmospheric temperatures were deduced. In overall, the mean altitudinal temperatures rose by about 1.1 °C above expected values during the lockdown. An altitudinal breakdown, at 1 km resolution, reveals that the values were typically below 0.5 °C at most of the altitudes, but exceeded 1 °C at 28 and 29 km altitudes. The temperatures were also observed to drop below expected values at altitudes of 0-2 km, and 17-20 km.
Keywords: COVID-19 lockdown; Equatorial Africa; Neural network; Sunspot number; Temperature; Time-series.
© 2021 China University of Geosciences (Beijing) and Peking University. Production and hosting by Elsevier B.V.
Conflict of interest statement
The authors declare that they have no known competing financial interests or personal relationships that could have appeared to influence the work reported in this paper.
Figures
Similar articles
-
Space Weather Observations by GNSS Radio Occultation: From FORMOSAT-3/COSMIC to FORMOSAT-7/COSMIC-2.Space Weather. 2014 Nov;12(11):616-621. doi: 10.1002/2014SW001133. Epub 2014 Nov 6. Space Weather. 2014. PMID: 26213514 Free PMC article.
-
Improvement in air quality and its impact on land surface temperature in major urban areas across India during the first lockdown of the pandemic.Environ Res. 2021 Aug;199:111280. doi: 10.1016/j.envres.2021.111280. Epub 2021 May 21. Environ Res. 2021. PMID: 34029544 Free PMC article.
-
Improvement in ambient-air-quality reduced temperature during the COVID-19 lockdown period in India.Environ Dev Sustain. 2021;23(6):9581-9608. doi: 10.1007/s10668-020-01034-z. Epub 2020 Oct 22. Environ Dev Sustain. 2021. PMID: 33110388 Free PMC article.
-
Evaluation of Atmospheric 3-Day Waves as a Source of Day-to-Day Variation of the Ionospheric Longitudinal Structure.Geophys Res Lett. 2021 Aug;48(15):e2021GL094877. doi: 10.1029/2021gl094877. Epub 2021 Aug 6. Geophys Res Lett. 2021. PMID: 34690382 Free PMC article.
-
Assessment of ZTD Derived from COSMIC Occultation Data with ECWMF, Radiosondes, and GNSS.Sensors (Basel). 2022 Jul 12;22(14):5209. doi: 10.3390/s22145209. Sensors (Basel). 2022. PMID: 35890887 Free PMC article.
References
-
- Adhikari L., Ho S.-P., Zhou X. Inverting COSMIC-2 phase data to bending angle and refractivity profiles using the full spectrum inversion method. Remote Sens. 2021;13(9):1793. doi: 10.3390/rs13091793. - DOI
-
- Ali S.A., Ali S.A., Suhail N. Ozone depletion, a big threat to climate change: What can be done? Global J. Pharm. Pharm. Sci. 2017;1(2):1–5.
-
- Baboo S.S., Shereef K.I. An efficient weather forecasting system using Artificial Neural Network. Intern. J. Env. Sci. Dev. 2010;1(4):321–326.
-
- Chowdhuri, I., Pal, S.C., Arabameri, A., Thao Thi Ngo, P., Roy, P., Saha, A., Ghosh, M., Chakrabortty, R., 2021. Have any effect of COVID-19 lockdown on environmental sustainability? A study from most polluted metropolitan area of India. Stoch. Environ. Res. Risk Assess. https://doi.org/10.1007/s00477-021-02019-8. - PMC - PubMed
LinkOut - more resources
Full Text Sources