

SIRT3-dependent delactylation of cyclin E2 prevents hepatocellular carcinoma growth
- PMID: 36896611
- PMCID: PMC10157311
- DOI: 10.15252/embr.202256052
SIRT3-dependent delactylation of cyclin E2 prevents hepatocellular carcinoma growth
Abstract
Lysine lactylation (Kla) is a recently discovered histone mark derived from metabolic lactate. The NAD+ -dependent deacetylase SIRT3, which can also catalyze removal of the lactyl moiety from lysine, is expressed at low levels in hepatocellular carcinoma (HCC) and has been suggested to be an HCC tumor suppressor. Here we report that SIRT3 can delactylate non-histone proteins and suppress HCC development. Using SILAC-based quantitative proteomics, we identify cyclin E2 (CCNE2) as one of the lactylated substrates of SIRT3 in HCC cells. Furthermore, our crystallographic study elucidates the mechanism of CCNE2 K348la delactylation by SIRT3. Our results further suggest that lactylated CCNE2 promotes HCC cell growth, while SIRT3 activation by Honokiol induces HCC cell apoptosis and prevents HCC outgrowth in vivo by regulating Kla levels of CCNE2. Together, our results establish a physiological function of SIRT3 as a delactylase that is important for suppressing HCC, and our structural data could be useful for the future design of activators.
Keywords: CCNE2; Honokiol; SIRT3; hepatocellular carcinoma; lactylation.
© 2023 The Authors.
Conflict of interest statement
The authors declare that they have no conflict of interest.
Figures
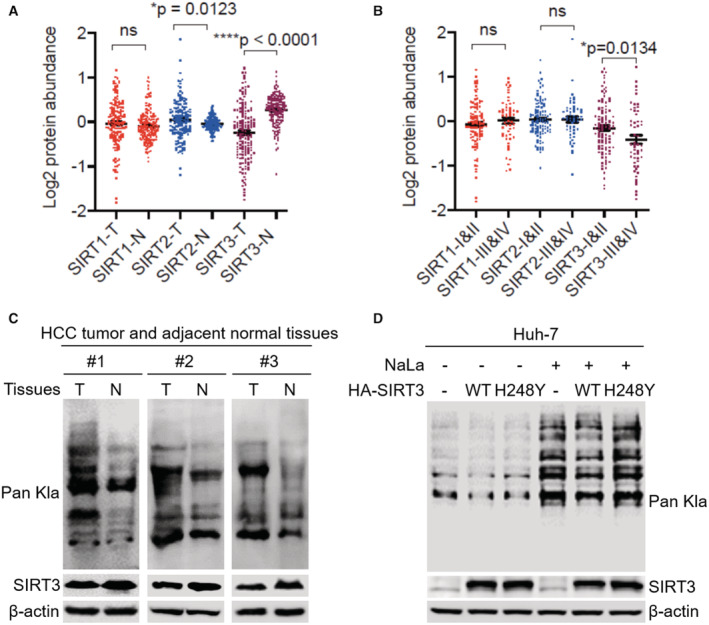
Comparisons of the protein abundance of SIRT1‐3 between tumor (T) and adjacent normal tissue (N) samples (paired t‐test) in the HCC patients' cohort (n = 159). The line represent mean with SEM and upper and lower quartiles, respectively. P‐values were described in the figure.
Comparisons of the protein abundance of SIRT1‐3 between I & II stage and III & IV stage of tumor tissue samples (unpaired t‐test) in the HCC patients' cohort (n = 159). The line represent mean with SEM and upper and lower quartiles, respectively. P‐values were described in the figure.
The immunoblot of the total Kla and SIRT3 in the lysates isolated from three HCC patients' tumor (T) and adjacent normal tissue (N) samples. β‐actin was used as the loading control.
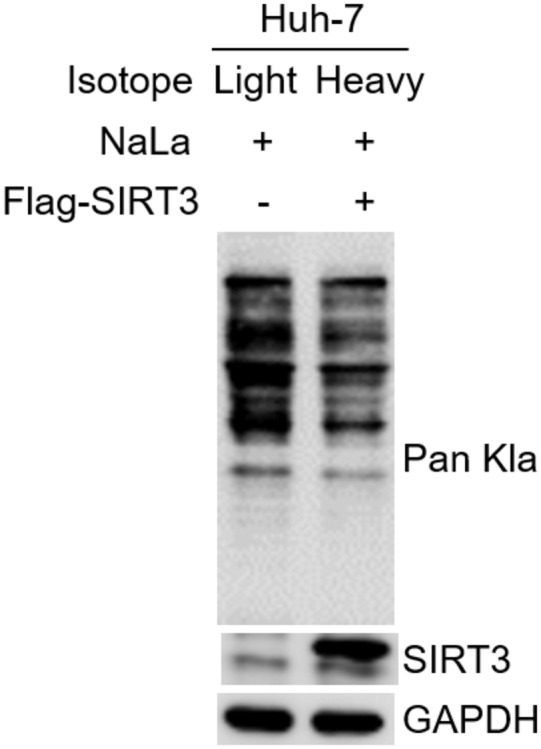
The immunoblot of Kla and SIRT3 in the total cell lysates. The lysates were isolated from Huh7 cells without or with SIRT3 overexpression upon NaLa treatment (25 mM for 24 h) or not. β‐actin was used as the loading control. The shown image is representative of three biological replicates.
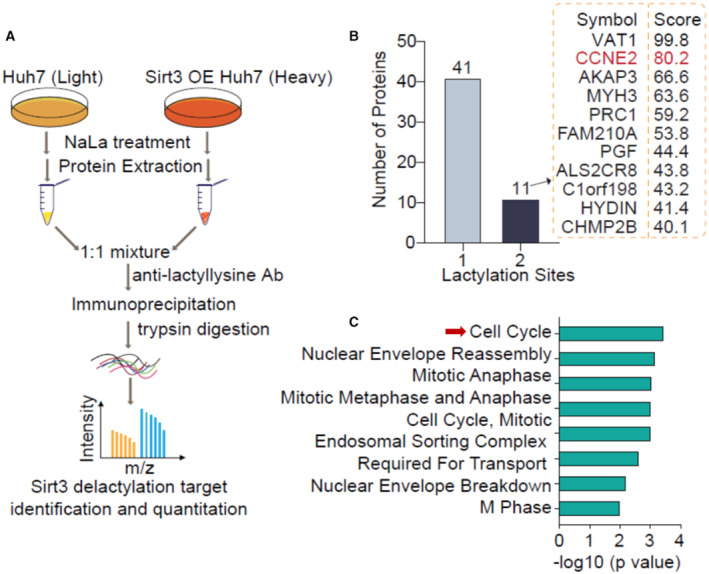
The schematic overview of the SILAC combined with HPLC‐MS/MS strategy to identify SIRT3 delactylation targets. Huh7 cells (without or with SIRT3 overexpression) were cultured in a medium with light or heavy isotopes, respectively. After the total cell lysates extraction, the isotopically labeled lysates were mixed and immunoprecipitated with anti‐lactyllysine antibody‐conjugated beads, and then were proceed to HPLC‐MS/MS analysis.
The distribution of the number of lysine lactylation sites per protein.
The pathway functional enrichment analysis of lysine lactylated proteins.
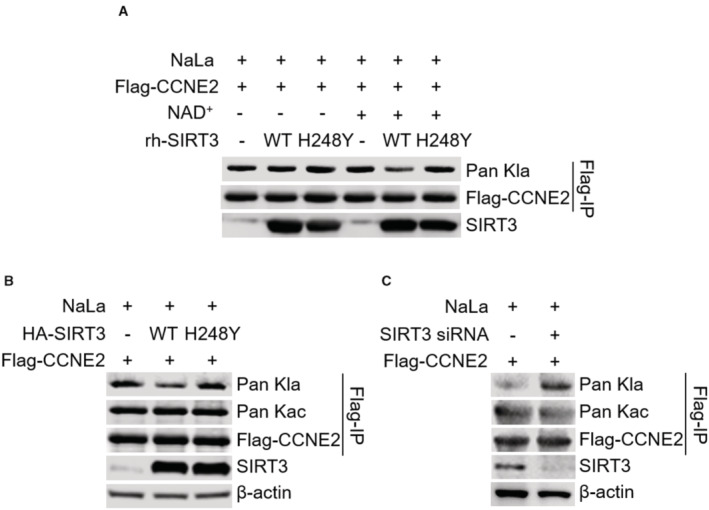
The immunoblot of Kla in the anti‐Flag immunoprecipitates. The immunoprecipitates were incubated with BSA, rh‐SIRT3 WT or H248Y mutant proteins in vitro, respectively, in the absence or presence of NAD+. Flag‐tagged CCNE2 was used as the loading control. The Flag‐IP was performed in the Huh7 cells with Flag‐tagged CCNE2 overexpression upon NaLa treatment (25 mM for 24 h). The shown image is representative of three biological replicates.
The immunoblot of Kla and Kac in the anti‐Flag immunoprecipitates. The immunoprecipitates were isolated from the Huh7 cells overexpressing Flag‐tagged CCNE2 without or with SIRT3 overexpression upon NaLa treatment (25 mM for 24 h). Flag‐tagged CCNE2 was used as the loading control. The shown image is representative of three biological replicates.
The immunoblot of Kla and Kac in the anti‐Flag immunoprecipitates. The immunoprecipitates were isolated from Huh7 cells overexpressing Flag‐tagged CCNE2 without or with SIRT3 siRNA transfection upon NaLa treatment (25 mM for 24 h). Flag‐tagged CCNE2 was used as the loading control. The shown image is representative of three biological replicates.
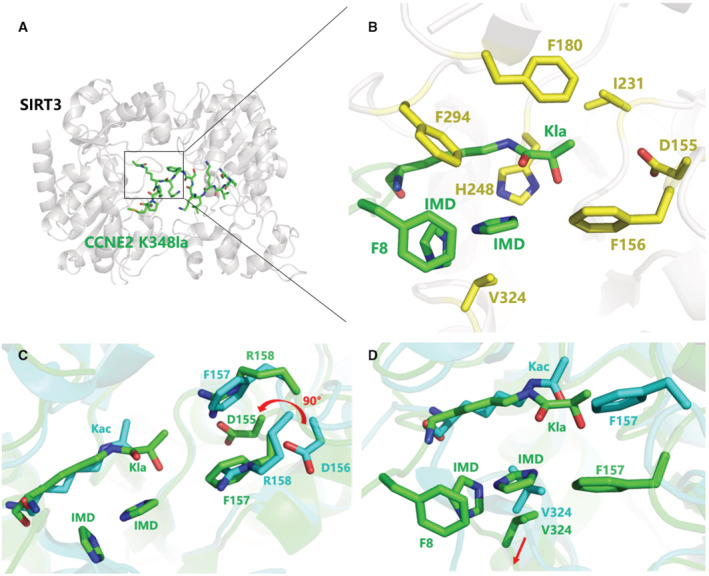
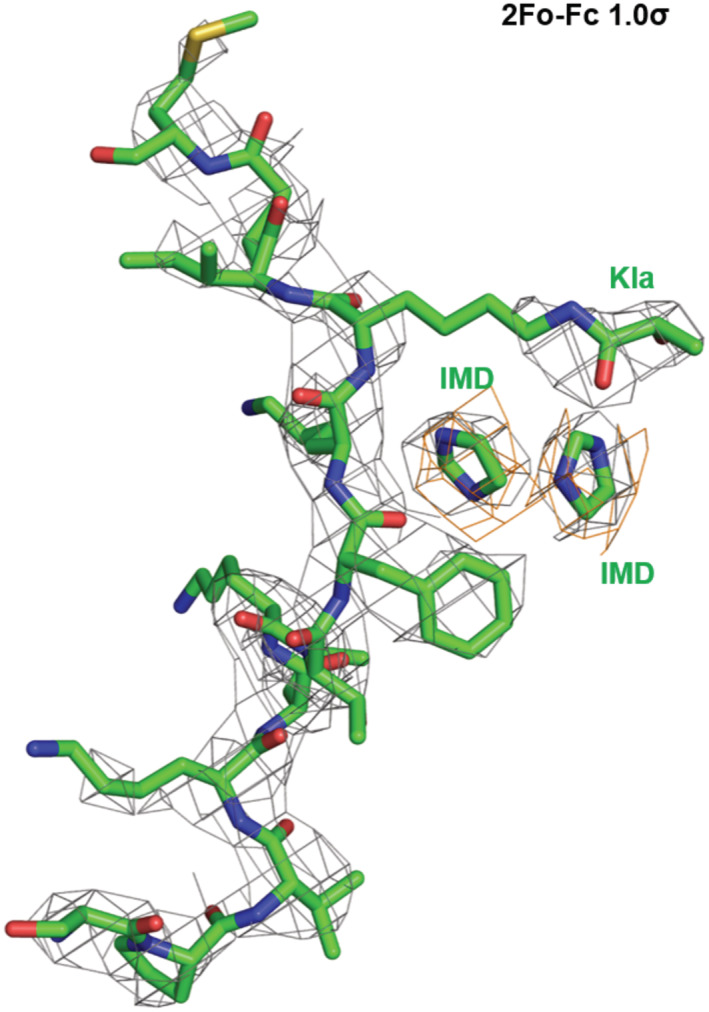
The overall complex structure of SIRT3 (gray) interaction with CCNE2K348la peptide (green).
The catalytic pocket of SIRT3 catalyzing the Kla group. Several residues (yellow) consist of the pocket to accommodate the Kla group, nearby Phe8 and two imidazole molecules (green).
The structural superimposition of SIRT3/CCNE2Kla (green) with SIRT3/AceCS2Kac (PDB 3GLR, Cyan). The reconfiguration of the residues (D156, F157, R158) in the catalytic pocket facilitates the Kla group binding compared to those conformations when SIRT3 binds with Kac.
A conformational change of the residue V324 facilitates the formation of a pocket together with F8 from CCNE2 peptide and re‐organizes F157 to accommodate two imidazoles bridging the interaction of SIRT3 with the peptide substrate.
- A
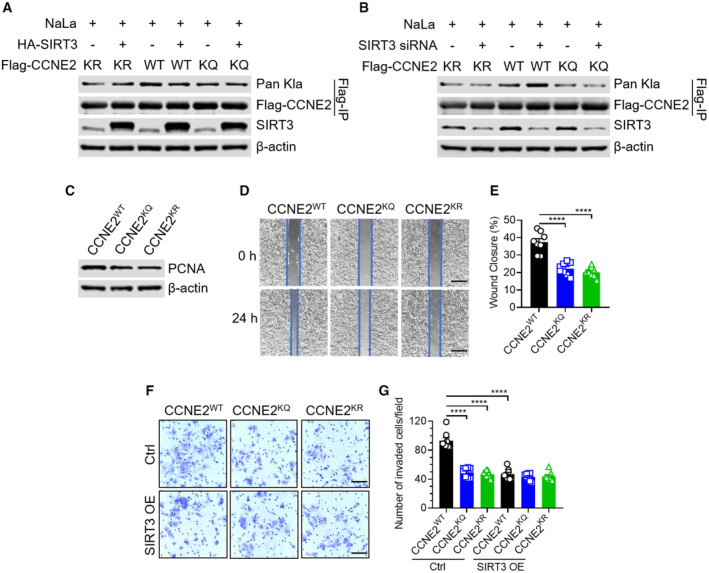
The immunoblot of Kla in the anti‐Flag immunoprecipitates. The immunoprecipitates were isolated from Huh7 cells overexpressing Flag‐tagged CCNE2 KR/WT/KQ without or with HA‐tagged SIRT3 overexpression upon NaLa treatment (25 mM for 24 h). Flag‐tagged CCNE2 was used as the loading control. The immunoblot of SIRT3 in the total cell lysates isolated from the above cells. β‐actin was used as the loading control. The shown image is representative of three biological replicates.
- B
The immunoblot of Kla in the anti‐Flag immunoprecipitates. The immunoprecipitates were isolated from Huh7 cells overexpressing Flag‐tagged CCNE2 KR/WT/KQ without or with SIRT3 siRNA transfection upon NaLa treatment (25 mM for 24 h). Flag‐tagged CCNE2 was used as the loading control. The immunoblot of SIRT3 in the total cell lysates isolated from the above cells. β‐actin was used as the loading control. The shown image is representative of three biological replicates.
- C
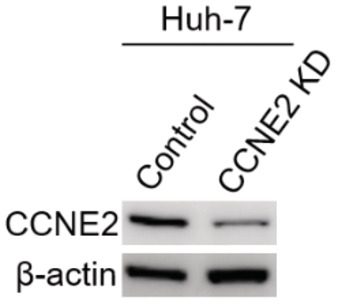
The immunoblot of PCNA in the anti‐Flag immunoprecipitates. The immunoprecipitates were isolated from CCNE2 KD Huh7 cells that were transfected with Flag‐tagged CCNE2 WT, KQ or KR plasmids, respectively. β‐actin was used as the loading control. The shown image is representative of three biological replicates.
- D, E
The CCNE2 KD Huh7 cells, transfected with Flag‐tagged CCNE2 WT, KQ or KR, were subjected to wound‐healing assay. The images (D) and quantification (E) of the percentages of wound closure were shown in mean ± SEM (n = 8); ****P < 0.0001; Unpaired t‐test. Scar bars, 560 μm. Data are representative of three biological replicates.
- F, G
The CCNE2 KD Huh7 cells, transfected with Flag‐tagged CCNE2 WT, KQ or KR, were subjected to transwell invasion assay in the presence of SIRT3 OE or not. The images (F) and quantification (G) of the numbers of invaded cells were shown in mean ± SEM (n = 8); ****P < 0.0001; Unpaired t‐test. Scar bars, 110 μm. Data are representative of three biological replicates.
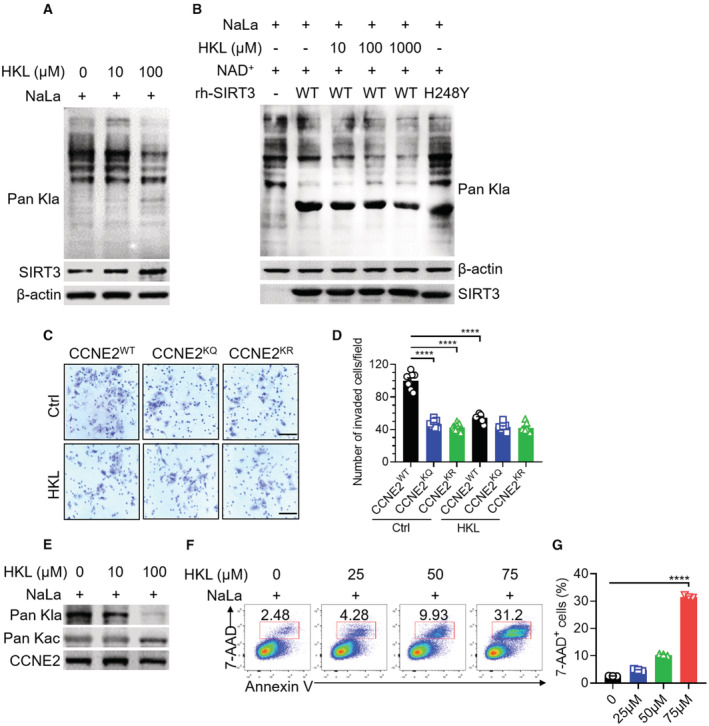
- A
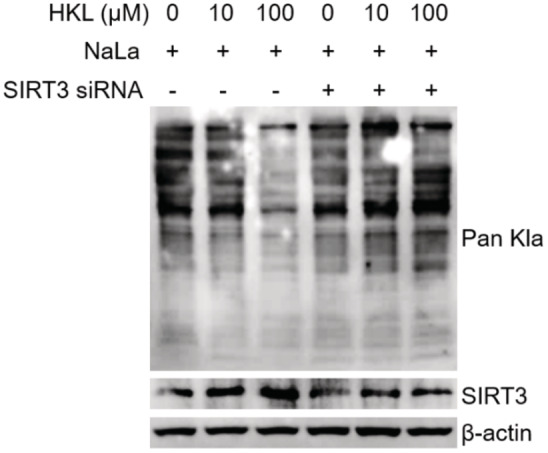
The immunoblot of Kla and SIRT3 in the total cell lysates. The lysates were isolated from Huh7 cells upon NaLa treatment (25 mM) together with HKL treatment (0, 10 and 100 μM) for 24 h. β‐actin was used as the loading control. The shown image is representative of three biological replicates.
- B
The immunoblot of Kla in the total cell lysates, isolated from the Huh7 cells upon NaLa treatment, were incubated with BSA, rh‐SIRT3 WT (in the absence or presence of the indicated doses of HKL) or H248Y mutant proteins in vitro, respectively. β‐actin was used as the loading control. The shown image is representative of three biological replicates.
- C, D
The CCNE2 KD Huh7 cells, transfected with Flag‐tagged CCNE2 WT, KQ or KR, were subjected to transwell invasion assay in the absence or presence of HKL treatment (10 μM for 24 h). The images (C) and quantification (D) of the numbers of invaded cells were shown in mean ± SEM (n = 8); ****P < 0.0001; Unpaired t‐test. Scar bars, 110 μm. Data are representative of three biological replicates.
- E
The immunoblot of Kla and Kac on the endogenous CCNE2 in Huh7 cells upon NaLa treatment (25 mM) together with HKL treatment (0, 10 and 100 μM) for 24 h. β‐actin was used as the loading control. The shown image is representative of three biological replicates.
- F
The percentages of 7‐AAD+ cells were determined by flow cytometry. The flow cytometry detection was performed in Huh7 cells upon NaLa treatment (25 mM) together with HKL treatment (0, 25, 50 and 75 μM) for 24 h. The shown image is representative of three biological replicates.
- G
The quantification of the percentages of 7‐AAD+ cells that were determined in (F). The results are expressed as mean ± SEM (n = 3); ****P < 0.0001; Unpaired t‐test. Data are representative of three biological replicates.
- A
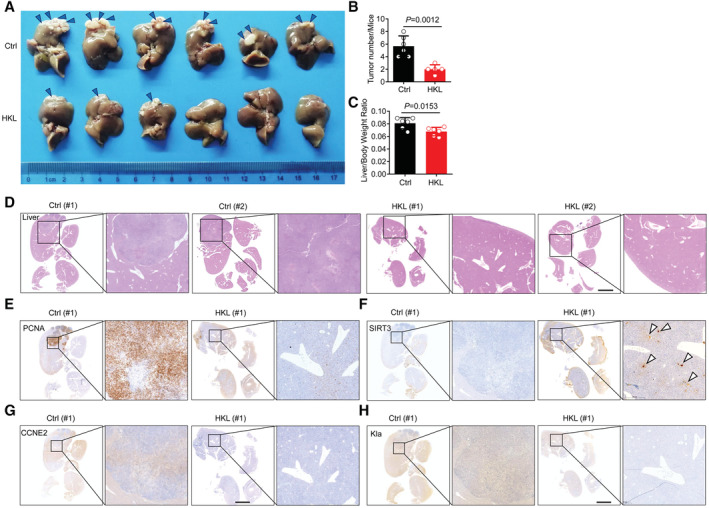
Representative pictures of HCC on day 21 from control mice (above) and mice treated with HKL (below). n = 6 for each group. The arrowheads show the area where the tumor is growing. Data are representative of three independent experiments.
- B, C
Quantification of liver tumor number (B) as well as liver/ body weight ratio (C) in mice from the control group and HKL group at autopsy on day 20. The results are expressed as mean ± SD (n = 6); Unpaired t‐test. P‐value was described in the figure.
- D
Representative hematoxylin and eosin (H&E) staining of harvested liver tissues from the control group and HKL group. Scale bars, 5 mm. Data are representative of three independent experiments.
- E–H
Representative images of immunohistochemistry (IHC) staining of PCNA (E), SIRT3 (F), CCNE2 (G) and Kla (H) in liver tissue sections of mice from the control group and HKL group. Scale bars, 5 mm. Data are representative of three independent experiments.
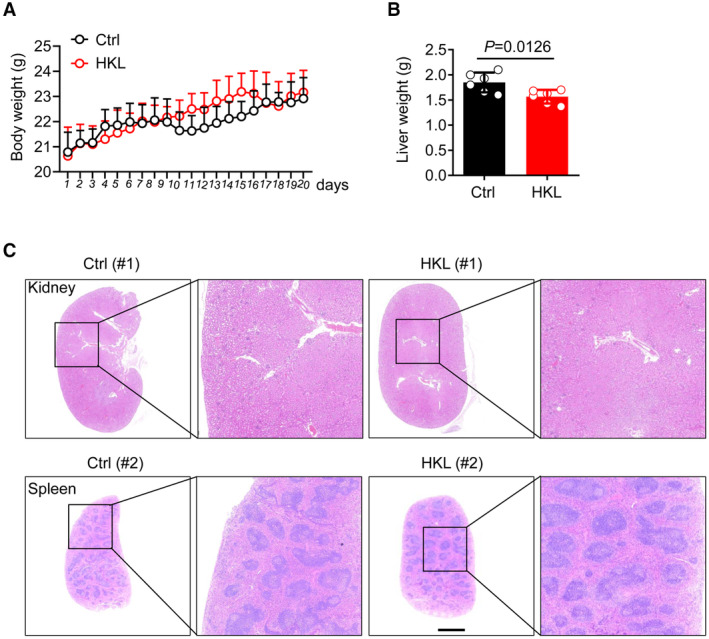
Body weight of individual mice from the control group and HKL group from day 1 to day 20. The results are expressed as mean ± SD (n = 6). Data are representative of three biological replicates.
Quantification of liver weight in mice from the control group and HKL group at autopsy on day 20. The results are expressed as mean ± SD (n = 6); Unpaired t‐test. P‐value was described in the figure.
Representative hematoxylin and eosin (H&E) staining of harvested kidney tissues (above), and spleen tissues (below) from the control group and HKL group. Scale bars, 5 mm. Data are representative of three independent experiments.
References
-
- Bailey S, Fairlamb AH, Hunter WN (1994) Structure of trypanothione reductase from Crithidia fasciculata at 2.6 a resolution; enzyme‐NADP interactions at 2.8 a resolution. Acta Crystallogr D Biol Crystallogr 50: 139–154 - PubMed
Publication types
MeSH terms
Substances
Associated data
- Actions
LinkOut - more resources
Full Text Sources
Medical
Molecular Biology Databases
