Clinical Trial
. 2023 May;67(3):264-279.
doi: 10.1007/s10384-023-00979-8. Epub 2023 Mar 10.

Efficacy, durability, and safety of faricimab with extended dosing up to every 16 weeks in Japanese patients with diabetic macular edema: 1-year results from the Japan subgroup of the phase 3 YOSEMITE trial

Collaborators, Affiliations
Clinical Trial

Efficacy, durability, and safety of faricimab with extended dosing up to every 16 weeks in Japanese patients with diabetic macular edema: 1-year results from the Japan subgroup of the phase 3 YOSEMITE trial

Masahiko Shimura et al. Jpn J Ophthalmol. 2023 May.

Abstract

Purpose: To evaluate efficacy, durability, and safety of faricimab in Japanese patients with diabetic macular edema (DME).

Study design: Subgroup analysis of 2 global, multicenter, randomized, double-masked, active-comparator-controlled, phase 3 trials (YOSEMITE, NCT03622580; RHINE, NCT03622593).

Methods: Patients with DME were randomized 1:1:1 to intravitreal faricimab 6.0 mg every 8 weeks (Q8W), faricimab 6.0 mg per personalized treatment interval (PTI), or aflibercept 2.0 mg Q8W through week 100. Primary endpoint was best-corrected visual acuity (BCVA) change from baseline at 1 year, averaged over weeks 48, 52, and 56. This is the first time 1-year outcomes between Japanese patients (only enrolled into YOSEMITE) and the pooled YOSEMITE/RHINE cohort (N = 1891) have been compared.

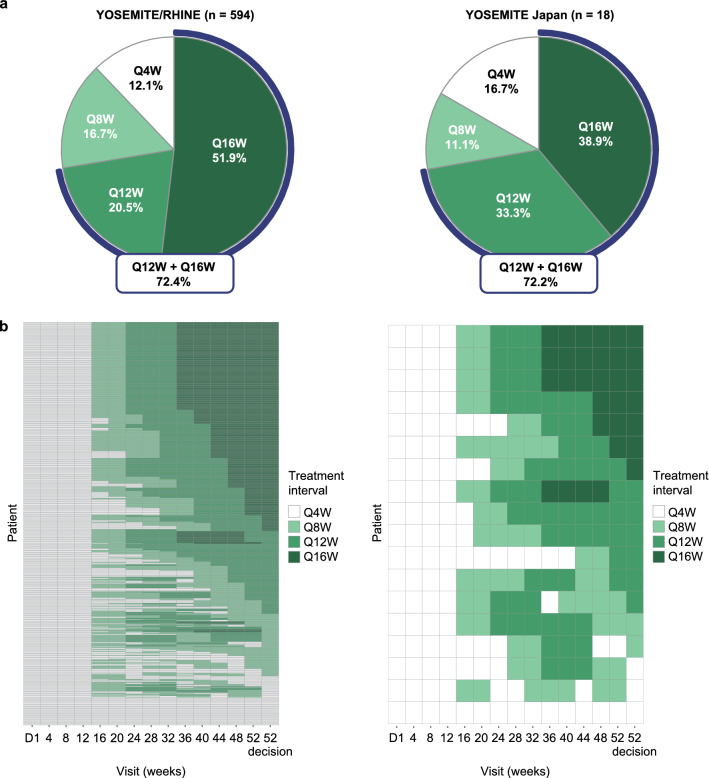
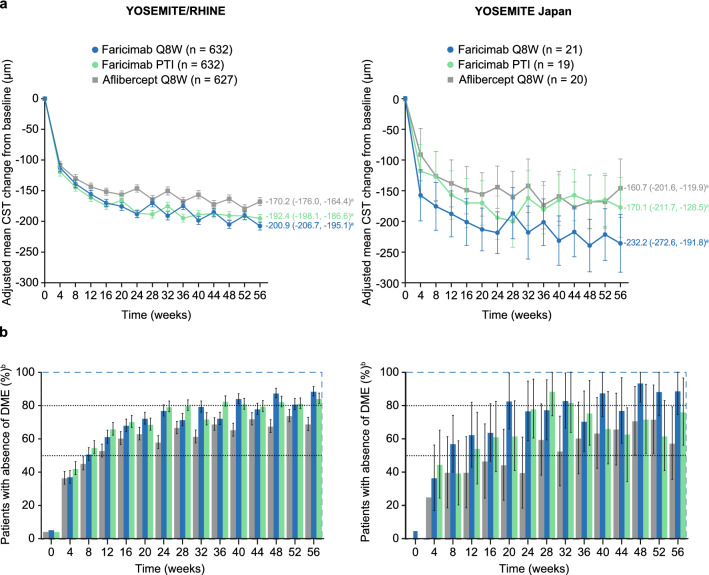
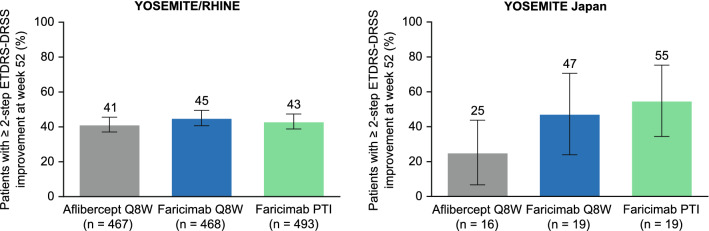
Results: The YOSEMITE Japan subgroup included 60 patients randomized to faricimab Q8W (n = 21), faricimab PTI (n = 19), or aflibercept Q8W (n = 20). Consistent with global results, the adjusted mean (95.04% confidence interval) BCVA change at 1 year in the Japan subgroup was comparable with faricimab Q8W (+11.1 [7.6-14.6] letters), faricimab PTI (+8.1 [4.4-11.7] letters), and aflibercept Q8W (+6.9 [3.3-10.5] letters). At week 52, 13 (72%) patients in the faricimab PTI arm achieved ≥ Q12W dosing, including 7 (39%) patients receiving Q16W dosing. Anatomic improvements with faricimab were generally consistent between the Japan subgroup and pooled YOSEMITE/RHINE cohort. Faricimab was well tolerated; no new or unexpected safety signals were identified.

Conclusion: Consistent with global results, faricimab up to Q16W offered durable vision gains and improved anatomic and disease-specific outcomes among Japanese patients with DME.

Keywords: Angiopoietin-2; Anti-VEGF therapy; Diabetic macular edema; Faricimab; Vascular stability.


Conflict of interest statement

M. Shimura, Consulting fees (Chugai, Roche), Lecture fees (Chugai); S. Kitano, Consulting fees (Chugai), Speaker fees (Bayer, Novartis); N. Ogata, None; Y. Mitamura, Grants (Santen), Speaker fee (Bayer, Chugai, Novartis, Santen); H. Oh, Grants (Chugai), Lecture fees (Alcon, Bayer, Kowa, Novartis, Santen); H. Ochi, Employee (Chugai); S. Ohsawa, Employee (Chugai); A. Hirakata, None.

Figures

Fig. 1
Fig. 1
Adjusted mean change in best-corrected visual acuity (BCVA) a from baseline through week 56 and b at 1 year in the pooled YOSEMITE/RHINE cohort and the YOSEMITE Japan subgroup. Results are based on a mixed model for repeated measures analysis; treatment policy strategy and hypothetical strategy were applied to non–COVID-19–related and COVID-19–related intercurrent events, respectively. Error bars represent 95% confidence intervals (CIs) for the pooled YOSEMITE/RHINE cohort and 95.04% CIs for the YOSEMITE Japan subgroup. aAdjusted mean BCVA change from baseline at 1 year, averaged over weeks 48, 52, and 56. ETDRS Early Treatment Diabetic Retinopathy Study, PTI personalized treatment interval, Q8W every 8 weeks
Fig. 2
Fig. 2
a Proportion of patients in the faricimab personalized treatment interval (PTI) arm who achieved every-4-week (Q4W), every-8-week (Q8W), every-12-week (Q12W), or every-16-week (Q16W) dosing at week 52 and b dosing intervals in the faricimab PTI arms over 1 year in the pooled YOSEMITE/RHINE cohort and the YOSEMITE Japan subgroup. Analyses included patients in the faricimab PTI arms who had not discontinued the study at the week 52 visit. In panel a, treatment interval at week 52 was defined as the treatment interval decision made at that visit. In panel b, treatment interval at a given visit is shown as the interval at the start of the visit. The week 52 decision (calculated/recorded at week 56) is shown in the last column. D day
Fig. 3
Fig. 3
a Adjusted mean change in central subfield thickness (CST) from baseline and b proportion of patients with absence of diabetic macular edema (DME) through week 56 in the pooled YOSEMITE/RHINE cohort and the YOSEMITE Japan subgroup. In panel a, results are based on a mixed model for repeated measures analysis. In panel b, weighted proportions were estimated using the Cochran-Mantel-Haenszel method; weighted proportions for the aflibercept every 8 weeks (Q8W) arms are presented for the faricimab Q8W versus aflibercept Q8W comparison. Baseline values (defined as the last available measurement obtained on or before randomization) are based on observed data. Treatment policy strategy and hypothetical strategy were applied to non–COVID-19–related and COVID-19–related intercurrent events, respectively. Error bars represent 95% confidence intervals (CIs) for the pooled YOSEMITE/RHINE cohort and 95.04% CIs for the YOSEMITE Japan subgroup; estimates < 0% or > 100% were imputed as 0% or 100%, respectively. aAdjusted mean CST change from baseline at 1 year, averaged over weeks 48, 52, and 56. bAbsence of DME was defined as CST < 325 μm on Spectralis spectral-domain optical coherence tomography (SD-OCT) or CST < 315 μm on Cirrus or Topcon SD-OCT, and measured as the average thickness between the internal limiting membrane and Bruch’s membrane in the central 1-mm diameter of the Early Treatment Diabetic Retinopathy Study grid. PTI personalized treatment interval
Fig. 4
Fig. 4
Proportion of patients with a absence of intraretinal fluid (IRF) and b absence of subretinal fluid (SRF) through week 56 in the pooled YOSEMITE/RHINE cohort and the YOSEMITE Japan subgroup. IRF and SRF were measured in the central 1-mm diameter of the Early Treatment Diabetic Retinopathy Study grid. Weighted proportions were estimated using the Cochran-Mantel-Haenszel method; weighted proportions for the aflibercept every 8 weeks (Q8W) arms are presented for the faricimab Q8W versus aflibercept Q8W comparison. Baseline values (defined as the last available measurement obtained on or before randomization) are based on observed data. Treatment policy strategy and hypothetical strategy were applied to non–COVID-19–related and COVID-19–related intercurrent events, respectively. Error bars represent 95% confidence intervals (CIs) for the pooled YOSEMITE/RHINE cohort and 95.04% CIs for the YOSEMITE Japan subgroup; estimates < 0% or > 100% were imputed as 0% or 100%, respectively. PTI personalized treatment interval
Fig. 5
Fig. 5
Proportion of patients with at ≥ 2-step Early Treatment Diabetic Retinopathy Study (ETDRS)–Diabetic Retinopathy Severity Scale (DRSS) improvement from baseline at week 52 in the pooled YOSEMITE/RHINE cohort and the YOSEMITE Japan subgroup. Analyses included patients with evaluable color fundus photographs at baseline and week 52. Weighted proportions were estimated using the Cochran-Mantel-Haenszel method; weighted proportions for the aflibercept every 8 weeks (Q8W) arms are presented for the faricimab Q8W versus aflibercept Q8W comparison. Treatment policy strategy and hypothetical strategy were applied to non–COVID-19–related and COVID-19–related intercurrent events, respectively. Error bars represent 95% confidence intervals (CIs) for the pooled YOSEMITE/RHINE cohort and 95.04% CIs for the YOSEMITE Japan subgroup. PTI personalized treatment interval

References

    1. Terasaki H, Ogura Y, Kitano S, Sakamoto T, Murata T, Hirakata A, et al. Management of diabetic macular edema in Japan: a review and expert opinion. Jpn J Ophthalmol. 2018;62:1–23. doi: 10.1007/s10384-017-0537-6. - DOI - PubMed
    1. Morizane Y, Morimoto N, Fujiwara A, Kawasaki R, Yamashita H, Ogura Y, et al. Incidence and causes of visual impairment in Japan: the first nation-wide complete enumeration survey of newly certified visually impaired individuals. Jpn J Ophthalmol. 2019;63:26–33. doi: 10.1007/s10384-018-0623-4. - DOI - PubMed
    1. Yoshida S, Murakami T, Nozaki M, Suzuma K, Baba T, Hirano T, et al. Review of clinical studies and recommendation for a therapeutic flow chart for diabetic macular edema. Graefes Arch Clin Exp Ophthalmol. 2021;259:815–836. doi: 10.1007/s00417-020-04936-w. - DOI - PubMed
    1. Daruich A, Matet A, Moulin A, Kowalczuk L, Nicolas M, Sellam A, et al. Mechanisms of macular edema: beyond the surface. Prog Retin Eye Res. 2018;63:20–68. doi: 10.1016/j.preteyeres.2017.10.006. - DOI - PubMed
    1. Saharinen P, Eklund L, Alitalo K. Therapeutic targeting of the angiopoietin–TIE pathway. Nat Rev Drug Discov. 2017;16:635–661. doi: 10.1038/nrd.2016.278. - DOI - PubMed

Publication types

MeSH terms

Substances

Associated data