. 2023 Mar 10;18(3):e0282166.
doi: 10.1371/journal.pone.0282166. eCollection 2023.

Investigation of the anti-tumor mechanism of tirabrutinib, a highly selective Bruton's tyrosine kinase inhibitor, by phosphoproteomics and transcriptomics

Affiliations

Investigation of the anti-tumor mechanism of tirabrutinib, a highly selective Bruton's tyrosine kinase inhibitor, by phosphoproteomics and transcriptomics

Ryohei Kozaki et al. PLoS One. .

Abstract

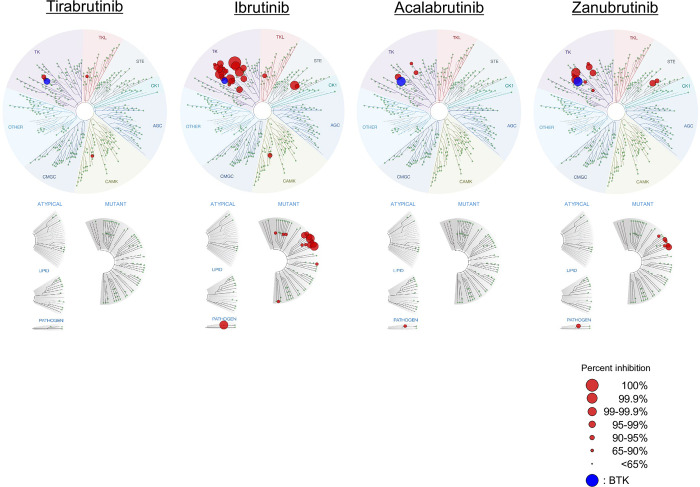
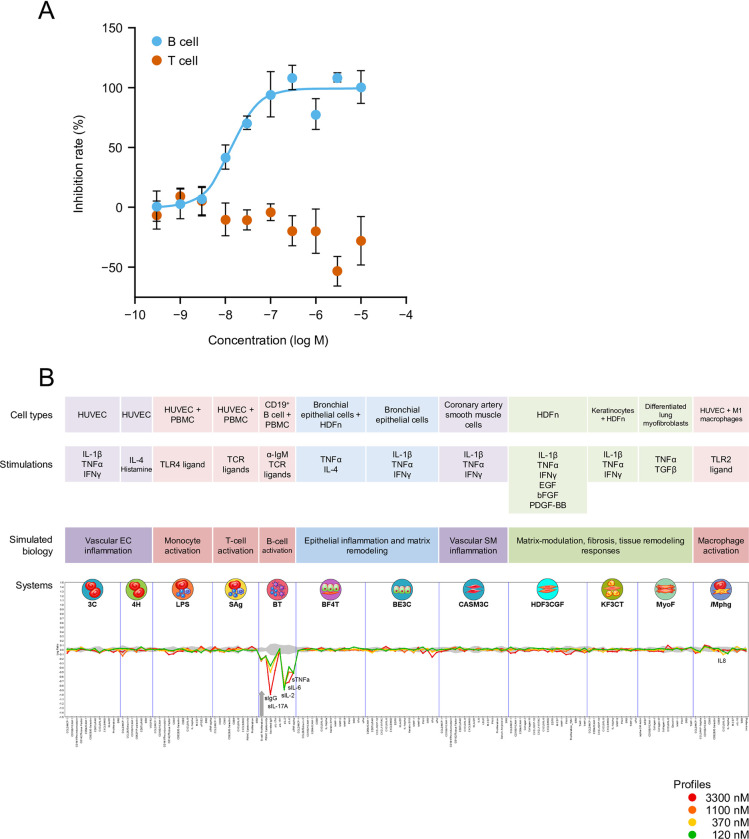
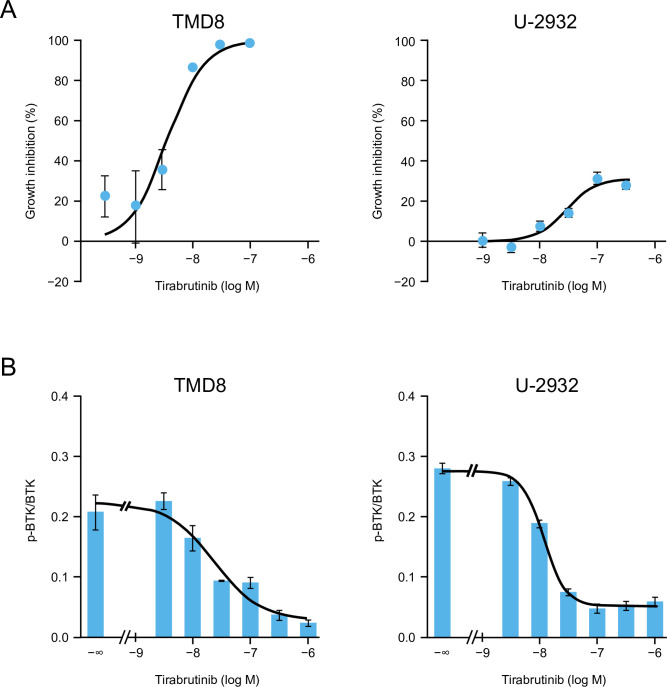
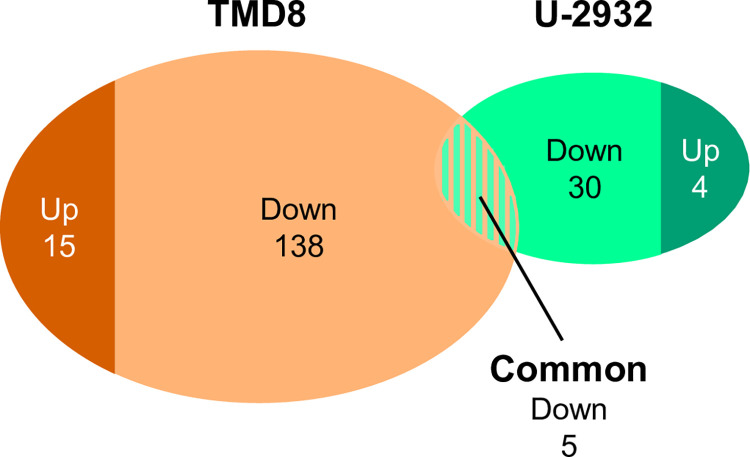
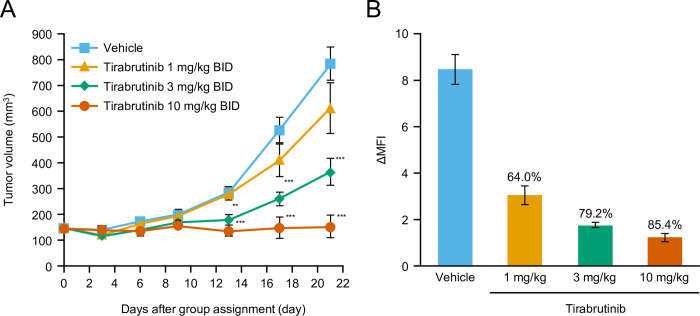
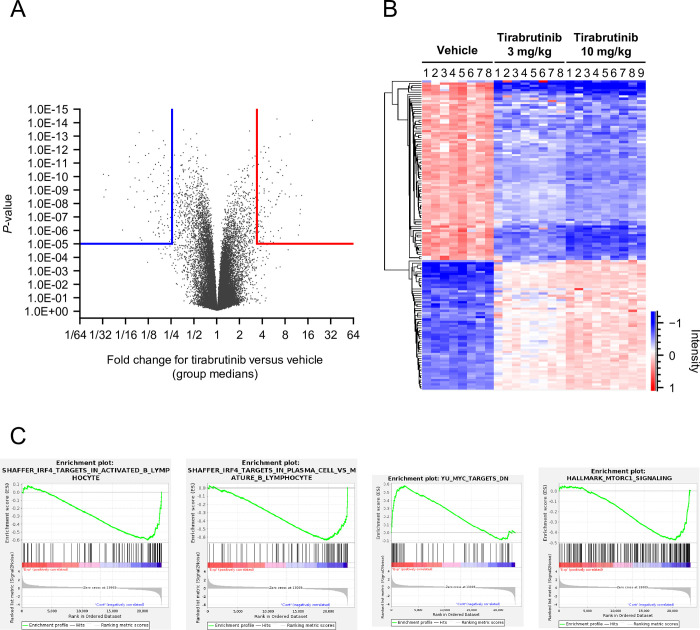
Tirabrutinib is a highly selective Bruton's tyrosine kinase (BTK) inhibitor used to treat hematological malignancies. We analyzed the anti-tumor mechanism of tirabrutinib using phosphoproteomic and transcriptomic methods. It is important to check the drug's selectivity against off-target proteins to understand the anti-tumor mechanism based on the on-target drug effect. Tirabrutinib's selectivity was evaluated by biochemical kinase profiling assays, peripheral blood mononuclear cell stimulation assays, and the BioMAP system. Next, in vitro and in vivo analyses of the anti-tumor mechanisms were conducted in activated B-cell-like diffuse large B-cell lymphoma (ABC-DLBCL) cells followed by phosphoproteomic and transcriptomic analyses. In vitro kinase assays showed that, compared with ibrutinib, tirabrutinib and other second-generation BTK inhibitors demonstrated a highly selective kinase profile. Data from in vitro cellular systems showed that tirabrutinib selectively affected B-cells. Tirabrutinib inhibited the cell growth of both TMD8 and U-2932 cells in correlation with the inhibition of BTK autophosphorylation. Phosphoproteomic analysis revealed the downregulation of ERK and AKT pathways in TMD8. In the TMD8 subcutaneous xenograft model, tirabrutinib showed a dose-dependent anti-tumor effect. Transcriptomic analysis indicated that IRF4 gene expression signatures had decreased in the tirabrutinib groups. In conclusion, tirabrutinib exerted an anti-tumor effect by regulating multiple BTK downstream signaling proteins, such as NF-κB, AKT, and ERK, in ABC-DLBCL.


Conflict of interest statement

This study was funded by Ono Pharmaceutical Co., Ltd. (Osaka, Japan). All authors are employees of Ono Pharmaceutical Co., Ltd. Some of the authors are inventors of patents filed by Ono Pharmaceutical Co., Ltd. in relation to this work: WO2015/067586 (“Combination therapy of an afucosylated CD20 antibody with a BTK inhibitor”, Tomoko Yasuhiro); WO2015/146159 (“Prophylactic agent and/or therapeutic agent for diffuse large B-cell lymphoma”, Ryohei Kozaki); WO2016/209961 (“Combination therapies for treating B cell malignancies”, Tomoko Yasuhiro and Ryohei Kozaki); WO2017/059224 (“Combination of a BTK inhibitor and a checkpoint inhibitor for treating cancers”, Tomoko Yasuhiro); and WO2019/208805 (“Preventive and/or therapeutic agent for autoimmune disease comprising compound having BTK inhibitory activity as active ingredient”, Yuko Ariza).

Figures

Fig 1
Fig 1. Kinome profiling using the KINOMEscan assay for the first- and second-generation BTK inhibitors.
KINOMEscan profile against 442 kinases at 300 nM are shown as a TreeSpot diagram, which depicts all test kinases on a circular dendrogram of the human kinome, with interacting kinases (percent inhibition; >65%) shown in blue (BTK) or red (kinases other than BTK); non-interacting kinases are represented as small green dots. The images were generated using TREEspot™ Software Tool and reprinted with permission from KINOMEscan™, a division of Eurofins Corporation (© DISCOVERX CORPORATION 2010). BTK, Bruton’s tyrosine kinase.
Fig 2
Fig 2. Selectivity of tirabrutinib in in vitro cellular systems.
(A) PBMC activation assays. (B) BioMAP evaluation. (A) Effect of tirabrutinib on B and T cells activation. Human peripheral blood mononuclear cells were treated with vehicle or tirabrutinib, stimulated with anti-IgM or anti-CD3/CD28 antibodies, and labelled with fluorescent anti-CD3, anti-CD20, and anti-CD69 antibodies. After separation by flow cytometry, mean fluorescence intensity of CD69 in each cell population was measured. Values are the mean inhibition rate of three samples ± standard error. (B) The X-axis lists the quantitative protein-based biomarker readouts measured in each system. The Y-axis represents a log-transformed ratio of the biomarker readouts for the tirabrutinib-treated sample (N = 1) over vehicle controls (N ≥ 6). The grey region around the Y-axis represents the 95% significance envelope generated from historical vehicle controls. Biomarker activities are annotated when two or more consecutive concentrations change in the same direction relative to vehicle controls, are outside the significance envelope, and have at least one concentration with an effect size >20% (|log10 ratio| > 0.1). The thick grey arrow denotes antiproliferative effects, which only require one concentration to meet the indicated threshold for profile annotation. bFGF, basic fibroblast growth factor; EGF, epidermal growth factor; HDFn, human neonatal dermal fibroblasts; HUVEC, human umbilical vein endothelial cells; IFN, interferon; Ig, immunoglobulin; IL, interleukin; PBMC, peripheral blood mononuclear cells; PDGF, platelet-derived growth factor; TCR, T-cell receptor; TGF, transforming growth factor; TLR, Toll-like receptor; TNF, tumor necrosis factor.
Fig 3
Fig 3
Antiproliferative activity (A) and BTK autophosphorylation inhibitory effects (B) of tirabrutinib. (A) TMD8 or U-2932 cells were treated with vehicle or different concentrations of tirabrutinib and incubated for 72 h at 37°C, 5% CO2/95% air. After culturing, the growth inhibition rate (%) was calculated by measuring a luminescent signal proportional to the amount of intracellular ATP using the CellTiter-Glo Luminescent Cell Viability Assay. The growth inhibition rate in the tirabrutinib group is plotted as the mean of 3 or 4 treated cultures from each treatment group ± standard error for TMD8 or U-2932, respectively. (B) TMD8 or U-2932 cells were treated with vehicle or different concentrations of tirabrutinib and incubated for 4 h at 37°C, 5% CO2/95% air. Autophosphorylated BTK (p-BTK) and total BTK (BTK) proteins were detected by western blot analysis. The intensity of each western blot band shown in S1 Fig was determined. The ratio of phosphorylated to total BTK is described as the mean of three cases ± standard error in the bar chart. The symbol -∞ indicates the vehicle group. The curve was estimated by nonlinear regression analysis using a four-parameter logistic model. BTK, Bruton’s tyrosine kinase.
Fig 4
Fig 4. Number of upregulated or downregulated phosphorylation sites in TMD8 and U-2932 cells.
Fig 5
Fig 5. In vivo analyses using mouse xenograft models.
(A) Anti-tumor effect of tirabrutinib in a mouse xenograft model. (B) Effect of tirabrutinib on BTK phosphorylation in the mouse xenograft model. A TMD8 cell suspension (0.1 mL, 1 × 10⁸ cells/mL) was subcutaneously implanted in SCID mice under pentobarbital anesthesia. Animals were randomized into groups based on tumor volume calculated from the measurement of tumor diameter on the day after implantation. Tirabrutinib or 0.5% methyl cellulose was orally administered twice daily for 21 days, starting on day 0 (the group assignment day). Tumor diameter was measured, and tumor volume was calculated every 3 or 4 days after group assignment. (A) Tumor volume in the figure is expressed as the mean ± standard error in the 10 animals in each group on each measurement day. Dunnett test was used to compare tumor volume in the vehicle- and tirabrutinib-treated groups. A P-value of less than 5% was considered statistically significant. **: P < 0.01, ***: P < 0.001. Results of linear regression analysis in the tirabrutinib-treated group on day 21: The P-value of the slope was 0.0001. (B) Tumors were collected 1 h after the final administration. The mean fluorescence intensity (MFI) of BTK phosphorylation in each tumor cell with or without stimulation with H2O2 was determined. The difference in MFI between the H2O2-stimulated and unstimulated samples was expressed as the mean ± standard error in 4–8 animals in each group. The BTK phosphorylation inhibition rate (%) in the tirabrutinib-treated groups versus the vehicle group was calculated. BID, twice daily; BTK, Bruton’s tyrosine kinase; MFI, mean fluorescent intensity.
Fig 6
Fig 6. Global gene expression analysis of response to tirabrutinib treatment in a TMD-8 xenograft model.
Microarray analysis was conducted in the TMD8 xenograft model after 21 days of tirabrutinib administration. (A) Volcano plot for differential gene expression between the vehicle and tirabrutinib 10 mg/kg group with Welch’s t test. (B) Heat map of top altered gene group including 59 upregulated probes and 87 downregulated probes (fold change, >4 or <0.25; P < 0.00001) in the vehicle, tirabrutinib 3 mg/kg, and 10 mg/kg groups. (C) Gene set enrichment analysis (GSEA) plots involved in IRF4, MYC, and mTORC1 signaling in the tirabrutinib 10 mg/kg group versus vehicle group.

References

    1. Tambaro FP, De Novellis D, Wierda WG. The role of BTK inhibition in the treatment of chronic lymphocytic leukemia: A clinical view. J Exp Pharmacol. 2021;13:923–35. doi: 10.2147/JEP.S265284 - DOI - PMC - PubMed
    1. Dunleavy K, Erdmann T, Lenz G. Targeting the B-cell receptor pathway in diffuse large B-cell lymphoma. Cancer Treat Rev. 2018;65:41–6. doi: 10.1016/j.ctrv.2018.01.002 - DOI - PubMed
    1. Merolle MI, Ahmed M, Nomie K, Wang ML. The B cell receptor signaling pathway in mantle cell lymphoma. Oncotarget. 2018;9:25332–41. doi: 10.18632/oncotarget.25011 - DOI - PMC - PubMed
    1. Valla K, Flowers CR, Koff JL. Targeting the B cell receptor pathway in non-Hodgkin lymphoma. Expert Opin Investig Drugs. 2018;27:513–22. doi: 10.1080/13543784.2018.1482273 - DOI - PMC - PubMed
    1. McDonald C, Xanthopoulos C, Kostareli E. The role of Bruton’s tyrosine kinase in the immune system and disease. Immunology. 2021;164:722–36. doi: 10.1111/imm.13416 - DOI - PMC - PubMed

Publication types

MeSH terms

Substances