. 2023 Mar 10;9(10):eade9948.
doi: 10.1126/sciadv.ade9948. Epub 2023 Mar 10.

Structure-guided engineering of a receptor-agonist pair for inducible activation of the ABA adaptive response to drought

Affiliations

Structure-guided engineering of a receptor-agonist pair for inducible activation of the ABA adaptive response to drought

Jorge Lozano-Juste et al. Sci Adv. .

Abstract

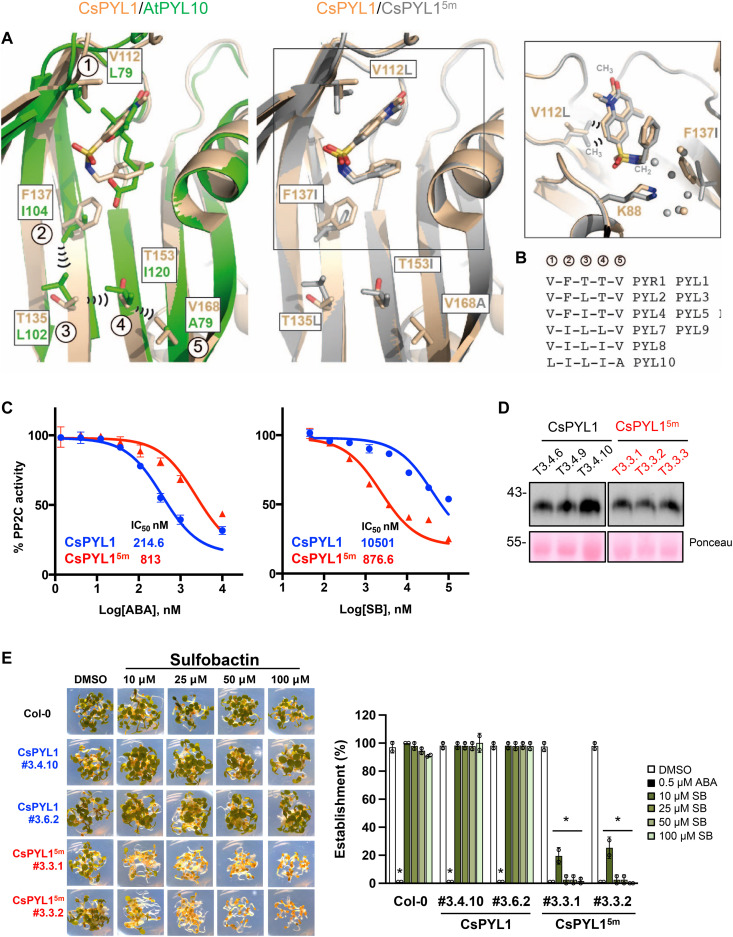
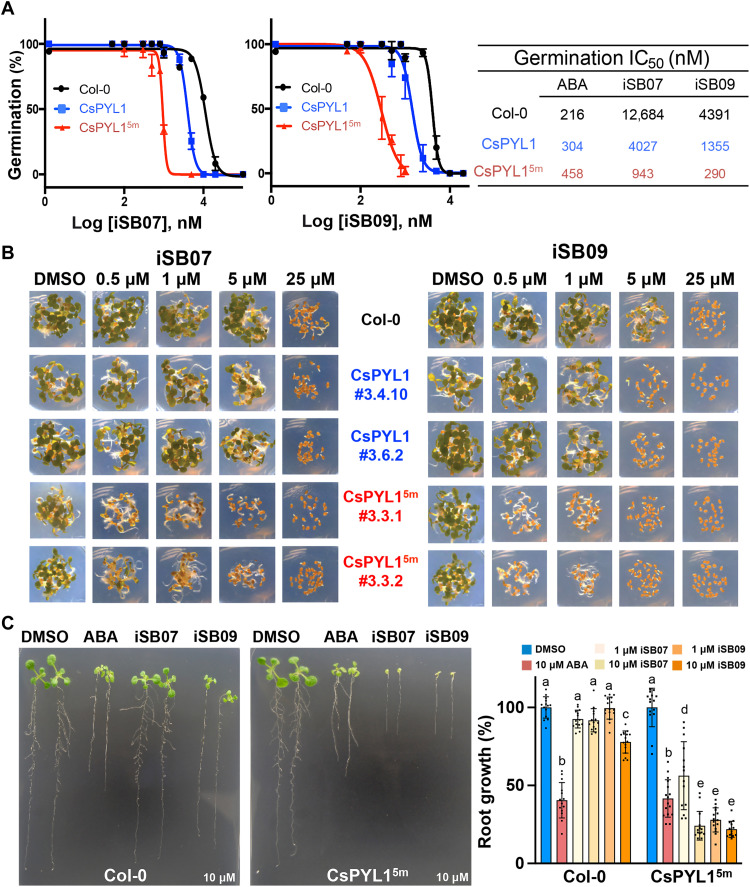
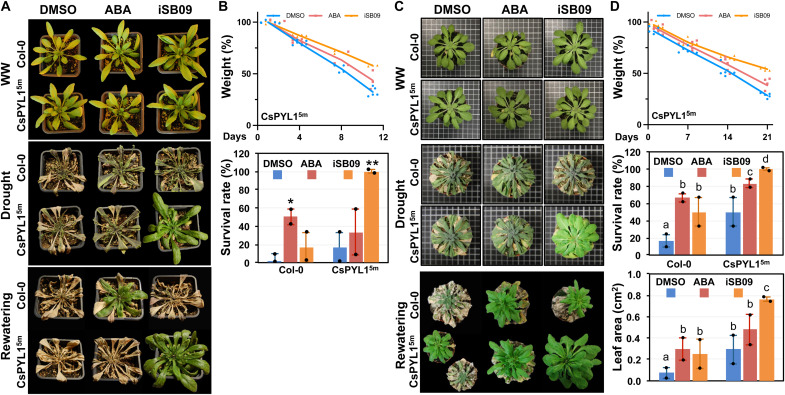
Strategies to activate abscisic acid (ABA) receptors and boost ABA signaling by small molecules that act as ABA receptor agonists are promising biotechnological tools to enhance plant drought tolerance. Protein structures of crop ABA receptors might require modifications to improve recognition of chemical ligands, which in turn can be optimized by structural information. Through structure-based targeted design, we have combined chemical and genetic approaches to generate an ABA receptor agonist molecule (iSB09) and engineer a CsPYL1 ABA receptor, named CsPYL15m, which efficiently binds iSB09. This optimized receptor-agonist pair leads to activation of ABA signaling and marked drought tolerance. No constitutive activation of ABA signaling and hence growth penalty was observed in transformed Arabidopsis thaliana plants. Therefore, conditional and efficient activation of ABA signaling was achieved through a chemical-genetic orthogonal approach based on iterative cycles of ligand and receptor optimization driven by the structure of ternary receptor-ligand-phosphatase complexes.


Figures

Fig. 1.
Fig. 1.. Identification of SB as a selective ABA receptor agonist and structural analysis of the CsPYL1-SB-AtHAB1ΔN complex.
(A) PP2C inhibition assay in the presence of 100 μM SB and the indicated ABA receptors. Values represent means ± SD of two assays. (B) Chemical structure of SB and half-maximal inhibitory concentrations (IC50) values for ABA- or SB-dependent inhibition of ΔNHAB1 by AtPYL1, AtPYL5, and AtPYL10. (C) Inhibition of seedling establishment by 1 μM ABA and 50 to 100 μM SB in WT Col-0 and either AtPYL5- or AtPYL10-overexpressing lines. Pictures were taken at day 4. (D) Quantification of ABA- or SB-mediated inhibition of root growth in the indicated genotypes. Seedlings were grown in plates supplemented with 0.5% dimethyl sulfoxide (DMSO) (mock), 50 μM SB, or 10 μM ABA. Values are means ± SD of three independent experiments (n = 13 to 16). Asterisks indicate statistical significance (*P < 0.05, **P < 0.01, and ***P < 0.001) in Student’s t test compared to its corresponding DMSO-treated line. (E) Ribbon representation of the overall CsPYL1-SB-AtHAB1ΔN ternary complex. Ligand (SB, QB, or ABA) binding in the ternary complex occurs in the closed conformation of the receptor that fits into the active site of the HAB1 phosphatase. (F) Superimposition of SB and QB in the ligand-binding site of CsPYL1. The steric hinderance between the oxygen of SB’s SO2 group and Val110 of CsPYL1 is represented as red arcs. (G) Detailed section of the SB (left) and QB (right) binding sites showing hydrogen bonding pattern of interactions between the ligand and CsPYL1:HAB1 complex.
Fig. 2.
Fig. 2.. Structure-guided design of a synthetic CsPYL15m receptor that shows enhanced sensitivity to SB.
(A) Superimposition of the ligand-binding pocket of CsPYL1-SB-AtHAB1ΔN (wheat) and either PYL10-ABA (green) (left) or CsPYL15m-SB-AtHAB1ΔN (gray) (middle and right). The concatenated interactions of the four PYL10 residues (labeled from 2 to 5) are indicated as black arcs. The right panel highlights the higher water network (gray spheres) and methyl contacts of Leu112 with SB (lacking in Val112 of CsPYL1) in the ligand-binding site of CsPYL15m. Residues changed in CsPYL15m are labeled in gray (middle and right). (B) The chain of interacting residues along the β sheet in PYR1 to PYL10 receptors is labeled from 2 to 5, according to the structural detail shown in (A). Number 1 corresponds to Leu79 of PYL10 and the equivalent position in other receptors. (C) Determination of the IC50 (nM) for inhibition of HAB1 by ABA and SB in the presence of CsPYL1 (blue circles) or CsPYL15m (red triangles). Dose-response curves are shown in the presence of the indicated concentrations of ABA or SB. (D) Immunoblot analysis of protein extracts obtained from CsPYL1 and CsPYL15m lines. The epitope-tagged receptor was detected using anti-HA antibodies. Ponceau staining serves as a protein loading control. (E) Inhibition of seedling establishment by SB in WT Col-0 and either CsPYL1- or CsPYL15m-overexpressing lines. Representative images are shown in the left panel, and quantification of the experiment is shown in the right panel. Values are means ± SD of two independent experiments (n = 20 each). *P < 0.05, Student’s t test, compared to Col-0.
Fig. 3.
Fig. 3.. iSB07 and iSBi09 are SB derivatives that show improved agonist activity.
(A) Chemical structure of iSB07 and iSB09 showing the swap of the SO2 group and CH2 of the benzyl group with respect to SB structure. The table shows the IC50 (nM) for inhibition of AtHAB1ΔN, PP2CA, and ABI1 by iSB07 and iSB09 in the presence of CsPYL1 or CsPYL15m using pNPP as substrate. (B) PP2C inhibition assay in the presence of 1 μM iSB07 or iSB09 and the indicated arabidopsis ABA receptors. For AtHAB1ΔN, pNPP was used as a substrate; for ABI1, phosphopeptide was used as a substrate. Values represent means ± SD of two assays. (C and D) The binding of ABA to CsPYL1 in the presence of ΔNHAB1 shows similar affinity to the binding of iSB09 to CsPYL15m. ITC data were obtained by repeated injections of ABA or iSB09 into a 1:1 mixture of receptor:ΔNHAB1. (E and F) Native red electrophoresis (NRE) analysis of ligand-induced ternary complexes. Dose-response NRE analysis of ABA-induced (E) or iSB09-induced (F) AtPYL5-ligand-ΔNHAB1 complex. The fraction of ligand bound in the ternary complex was represented against free ABA or free iSB09 concentration to calculate apparent Kd.
Fig. 4.
Fig. 4.. Structural insights into iSB receptor–phosphatase complexes.
(A and B) Superimposition of the ligand-binding pocket in CsPYL1-iSB07-AtHAB1ΔN, CsPYL15m-iSB07-AtHAB1ΔN, CsPYL1-iSB09-AtHAB1ΔN, and CsPYL15m-iSB09-AtHAB1ΔN complexes. (A) Interactions at the Trp lock (top) and the hydrogen bond network in the opposite part of the ligand (bottom). (B) Hydrophobic tunnel of the receptors and interactions of the alkyl group close to the carbonyl oxygen. (C) Two-dimensional schematic representation of the iSB09 interactions in the ligand-binding pocket of the CsPYL15m-ligand-AtHAB1ΔN ternary complex. (D) SB, iSB07, and iSB09 in complex with CsPYL15m relax to a more stable conformation than that observed in complex with CsPYL1. The α and β torsion angles along the sulfonamide linker of these ligands served to characterize their conformation. The bar diagram represents the differences between the mean value of torsion angles α and β observed for identical fragments recorded at CSD and those values in the pure compounds (Xtal) and in complex with CsPYL1 and CsPYL15m.
Fig. 5.
Fig. 5.. The iSB07 and iSB09 compounds show enhanced agonist potency in vivo combined with the synthetic CsPYL15m receptor.
(A) Determination of the IC50 for inhibition of seed germination by iSB07 and iSBi09 in WT Col-0 or in lines expressing CsPYL1 or CsPYL15m receptors. Values represent means ± SD of three assays. (B) Inhibition of seedling establishment by iSB07 and iSB09 in WT Col-0 or in lines expressing CsPYL1 or CsPYL15m receptors. Pictures were taken at day 4. The experiment was repeated at least twice with similar results. (C) ABA- or iSB-mediated inhibition of root growth in the indicated genotypes. Representative images of the different treatments and genotypes are shown along with the quantification of root growth (right). Values are means ± SD (n = 13 to 16) of relative growth compared to Col-0 in control conditions (0.1% DMSO). Different letters indicate statistical significance by one-test analysis of variance (ANOVA).
Fig. 6.
Fig. 6.. Whole-plant gas exchange and thermal imaging analysis after chemical treatment.
(A) Stomatal conductance (Gs) values of WT Col-0 and two lines expressing CsPYL15m 56 min after spraying with 5 μM iSB07/iSB09 or 0.1% DMSO (control). Asterisk in (A) and (C) denotes significant differences with respect to the pretreatment value of stomatal conductance (repeated-measures ANOVA, Generalized Linear Model, GLM). Values show averages ± SE, n = 5 to 7. (B) Time courses of Gs after spraying with 5 μM iSB07/iSB09 or control solutions. Values show averages ± SE, n = 5 to 7. (C) Gs values of WT Col-0 and two transgenic lines before or 24 and 48 hours after spraying with 5 μM iSB07/iSB09 or control. Values show averages ± SE, n = 4 to 7. (D) Time courses of Gs in relative units for WT Col-0 after spraying with 5 or 20 μM iSB07/iSB09. Only treatment with 20 μM iSB09 led to a significant reduction of stomatal conductance (repeated-measures ANOVA, GLM). Values show averages ± SE, n = 5 to 7. (E) IR images of representative arabidopsis CsPYL15m plants 24 hours after being treated with 0.1% DMSO (control), 50 μM ABA, iSB07, or iSB09. (F) Quantification of the temperature difference for the experiment described in (E). The temperature of 15 different sectors corresponding to four to six leaves per plant was quantified as described in Materials and Methods. The values represent the temperature increase versus control. Statistical analysis (one-way ANOVA) was performed using GraphPad Prism 9. Different letters indicate statistical significance. At least six plants per genotype and treatment were analyzed. The experiment was repeated twice. (G) IR images of representative N. benthamiana WT plants treated with 0.1% DMSO (control), 50 μM ABA, or 100 μM iSB07/iSB09. IR images were obtained 24 hours after the treatment. (H) Quantification of the experiment described in (G). The values represent the temperature increase versus control.
Fig. 7.
Fig. 7.. Drought resistance assays under long-day or short-day conditions.
(A) WT Col-0 and CsPYL15m plants grown under long-day conditions were submitted to water deprivation and treated with 0.1% DMSO (mock), 50 μM ABA, or iSB09 as described in Materials and Methods. Photographs show representative plants (at least 50% of the total cases) in well-watered (WW) conditions, submitted to drought and after rewatering. (B) Gravimetric analysis (top) of water loss in pots containing CsPYL15m plants reveals reduced water consumption in plants treated with ABA and iSB09 compared to mock-treated plants. The percentage (%) of weight relative to day 1 is shown and reflects water remaining in soil along the drought experiment. Six plants per genotype and treatment were analyzed. The experiment was performed twice. Bottom: Survival rate of Col-0 and CsPYL15m plants 6 days after rewatering. Values indicate means ± SD. Asterisks indicate statistical significance (*P < 0.05 and **P < 0.01) in Student’s t test compared to their corresponding DMSO-treated genotype. (C) WT Col-0 and CsPYL15m plants grown under short-day conditions were submitted to water deprivation and treated with 0.1% DMSO (mock), 50 μM ABA, or iSB09 as described in Materials and Methods. (D) Gravimetric analysis (top) was performed as described above. Middle: Survival rate of Col-0 and CsPYL15m plants 12 days after rewatering. Bottom: Enhanced growth of leaves in CsPYL15m plants treated with iSB09 compared to mock- or ABA-treated plants. Values indicate means ± SD. Different letters indicate statistical significance by one-way ANOVA.
Fig. 8.
Fig. 8.. The iSB09-CsPYL15m combination strongly induces an ABA-like transcriptional response in transgenic plants.
(A) iSB compounds induce the pMAPKKK18-LUC reporter line. Seedlings of the reporter line were treated with the indicated concentrations of iSB07, iSB09, or ABA in 24-well plates and imaged with a charge-coupled device camera to detect luminescence 6 hours later (left). Luciferase luminescence was quantified as indicated in Materials and Methods. (B) Volcano plots of RNA-seq data obtained in WT or CsPYL15m transgenic plants that were 5 μM iSB09 or mock-treated for 3 hours. Genes up-regulated (log2FC > 1) or down-regulated (log2FC < −1) with Padj < 0.05 were plotted against the negative log10 P value. Higher values of the y axis indicate the stronger effect of the chemical treatment. (C) Induction of ABA-responsive genes by iSB09 treatment is markedly higher in CsPYL15m plants than in WT. Transcripts per million (TPMs) of the RNA-seq data were plotted for some selected ABA-responsive markers. As mock treatment, we used 0.1% DMSO in both WT and CsPYL15m plants, which was compared to 5 μM iSB09 treatment. (D) Scatter plots represent the genome-wide gene expression (Log2TPM) of mock-treated WT versus CsPYL15m plants. (E) Scatter plot of differentially expressed genes with Padj < 0.05 of CsPYL15m treated with iSB09 versus control compared to WT Col-0 plants treated with ABA versus control from an independent experiment (54). The correlation coefficient (r) is indicated.

References

    1. P. J. Franks, M. A. Adams, J. S. Amthor, M. M. Barbour, J. A. Berry, D. S. Ellsworth, G. D. Farquhar, O. Ghannoum, J. Lloyd, N. McDowell, R. J. Norby, D. T. Tissue, S. von Caemmerer, Sensitivity of plants to changing atmospheric CO2 concentration: From the geological past to the next century. New Phytol. 197, 1077–1094 (2013). - PubMed
    1. A. M. Hetherington, F. I. Woodward, The role of stomata in sensing and driving environmental change. Nature 424, 901–908 (2003). - PubMed
    1. M. Dittrich, H. M. Mueller, H. Bauer, M. Peirats-Llobet, P. L. Rodriguez, C. M. Geilfus, S. C. Carpentier, K. A. S. Al Rasheid, H. Kollist, E. Merilo, J. Herrmann, T. Muller, P. Ache, A. M. Hetherington, R. Hedrich, The role of Arabidopsis ABA receptors from the PYR/PYL/RCAR family in stomatal acclimation and closure signal integration. Nat. Plants 5, 1002–1011 (2019). - PubMed
    1. D. Dietrich, L. Pang, A. Kobayashi, J. A. Fozard, V. Boudolf, R. Bhosale, R. Antoni, T. Nguyen, S. Hiratsuka, N. Fujii, Y. Miyazawa, T. W. Bae, D. M. Wells, M. R. Owen, L. R. Band, R. J. Dyson, O. E. Jensen, J. R. King, S. R. Tracy, C. J. Sturrock, S. J. Mooney, J. A. Roberts, R. P. Bhalerao, J. R. Dinneny, P. L. Rodriguez, A. Nagatani, Y. Hosokawa, T. I. Baskin, T. P. Pridmore, L. De Veylder, H. Takahashi, M. J. Bennett, Root hydrotropism is controlled via a cortex-specific growth mechanism. Nat. Plants 3, 17057 (2017). - PubMed
    1. R. Miao, W. Yuan, Y. Wang, I. Garcia-Maquilon, X. Dang, Y. Li, J. Zhang, Y. Zhu, P. L. Rodriguez, W. Xu, Low ABA concentration promotes root growth and hydrotropism through relief of ABA INSENSITIVE 1-mediated inhibition of plasma membrane H+-ATPase 2. Sci. Adv. 7, eabd4113 (2021). - PMC - PubMed