. 2023 Mar 10;9(10):eade5420.
doi: 10.1126/sciadv.ade5420. Epub 2023 Mar 10.

Dopamine error signal to actively cope with lack of expected reward

Affiliations

Dopamine error signal to actively cope with lack of expected reward

Seiya Ishino et al. Sci Adv. .

Abstract

To obtain more of a particular uncertain reward, animals must learn to actively overcome the lack of reward and adjust behavior to obtain it again. The neural mechanisms underlying such coping with reward omission remain unclear. Here, we developed a task in rats to monitor active behavioral switch toward the next reward after no reward. We found that some dopamine neurons in the ventral tegmental area exhibited increased responses to unexpected reward omission and decreased responses to unexpected reward, following the opposite responses of the well-known dopamine neurons that signal reward prediction error (RPE). The dopamine increase reflected in the nucleus accumbens correlated with behavioral adjustment to actively overcome unexpected no reward. We propose that these responses signal error to actively cope with lack of expected reward. The dopamine error signal thus cooperates with the RPE signal, enabling adaptive and robust pursuit of uncertain reward to ultimately obtain more reward.


Figures

Fig. 1.
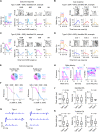
Fig. 1.. Monitoring of active behavioral switching toward the next opportunity to obtain reward and opto-tagging recording from DA neurons in the VTA.
(A) Top: Sequence of the behavioral events in the task. “50R,” reward after cue 2 (light blue); “50N,” NR after cue 2 (magenta). Bottom: Trajectory of the lever tip. Reward or NR (R/NR) onset was 0.4 s after “Pull”. a.u., arbitrary unit. (B) Relationship between cue and reward probability (left) and outcomes (right). (C) Average latency from odor cue offset to pull the lever closer than lever-position(−1) (“Cue-Pull”). n = 101 sessions across seven rats. Center lines, median; box limits, 25th and 75th percentiles; whiskers, range. Significant difference between conditions, ***P < 0.001, two-sided Wilcoxon signed-rank test with Bonferroni correction. (D) Average latency from NR onset to push the lever beyond the lever-position(−1) [“NR-Push(−1)”]. “0N,” NR after cue 3. ***P < 0.001, two-sided Wilcoxon signed-rank test. (E) Average latency from Push(−1) to push forward more than the position(1) [“Push(−1)-Push(1)”] after NR (left) or the last shot of reward presentation (right). ***P < 0.001, two-sided Wilcoxon signed-rank test. (F) Left: Schematic of extracellular recording from DA neurons. Right: Example track of an optrode. Green, ChR2-eYFP. Blue, DAPI (4′,6-diamidino-2-phenylindole). Arrowhead, the tip of the tetrode. Scale bars, 500 μm. (G) Optrode tracks in the left VTA (n = 7 rats) shown on top of the atlas image. Each red line indicates the range of recording locations in each rat projected onto the slice of AP: −5.2 mm. Scale bars, 500 μm. fr, fasciculus retroflexus; mp, mammillary peduncle. (H) Example average waveforms of an identified DA neuron recorded from a tetrode (black, waveforms during behavior; blue, light-evoked waveforms). (I) Example light-evoked spikes (black tick) to 5-Hz blue-light stimulation (blue tick, top) of an identified DA neuron. (J) Histogram of the light-evoked spike latency of the neuron [as in (I)]. Mean = 3.88, SD = 0.34.
Fig. 2.
Fig. 2.. A subset of DA neurons responds to unexpected reward and NR in the opposite direction to RPE neurons.
(A) Left: Average spiking rates of an example optogenetically identified type 1 DA neuron aligned to outcome onset. Mean across trials. Right: raster plot (top) and average response across all trials (bottom). (B) Same as (A) but for cue responses. Dotted line, cue offset. (C and D) Same as (A) and (B), respectively, but for type 2 DA neuron. (E) Number of each type of neuron among identified (left, n = 36) or putative (right, n = 150) neurons. (F) Distribution of d′ comparisons of activity to 50R versus 50N of identified (left) or putative (right) neurons. (G) Average waveforms of identified type 1 (left, n = 16) or type 2 (right, n = 15) DA neurons (black, waveforms during behavior; blue, light-evoked waveforms). (H) Histogram of mean (left) and SD (right) of spike latency of identified DA neurons in response to the light stimulation (blue: type 1, n = 16; magenta: type 2, n = 15). No significant difference between the groups. P = 0.26 or 0.77, respectively, two-sided Mann-Whitney U test. (I) Probability of the induction of spikes as a function of stimulation frequency for each neuron (line) and the median across neurons (dot). No significant difference between the groups. P = 0.69, two-sided Mann-Whitney U test. (J) Average peak width (left), spiking rate (middle), or amplitude (right) of identified DA neurons (n = 16 or 15 of type 1 or type 2 neurons, respectively). Significant difference between the types, *P = 0.044, two-sided Mann-Whitney U test (left). P = 0.42 (middle); P = 0.62 (right). (K) Same as (J) but for putative neurons (n = 65 or 63 of type 1 or type 2 neurons, respectively). Significant difference between conditions, ***P = 7.4 × 10−9, two-sided Mann-Whitney U test (left). P = 0.12 (middle); P = 0.43 (right).
Fig. 3.
Fig. 3.. Responses of type 2 DA neurons are opposite to those of RPE neurons, consistent with type 2 error signal.
(A) Average z-scored (z) spiking rates of all identified DA neurons during the outcome periods (type 1, n = 16; type 2, n = 15 neurons). Means ± SEM. across neurons. Blue bar, time window to compare responses to 50R versus 100R (0 to 0.5 s for type 1; 0.4 to 0.9 s for type 2) [as in (B)]. Red bar, time window to compare responses to 50N versus 0N (0.2 to 0.7 s for type 1; 0.3 to 0.8 s for type 2) [as in (B)]. (B) Comparisons of average activity (z-scored) of the type 1 (top) or type 2 (bottom) neurons during the outcome periods [time windows as in (A)]. Bar graph, mean ± SEM. Gray dot and line, each neuron. Left: In response to 100R versus 50R. Right: In response to 50N versus 0N. Significant difference from baseline, **P < 0.01; ***P < 0.001, two-sided Wilcoxon signed-rank test. Significant difference between conditions, †P < 0.05, ††P < 0.01, and †††P < 0.001, two-sided Wilcoxon signed-rank test. (C and D) Same as (A and B) but for putative DA neurons (type 1, n = 65; type 2, n = 63 neurons). (E) Number of neurons most activated in response to each cue among all type 1 (top, n = 81 in total) or type 2 (bottom, n = 78 in total) DA neurons. (F) Average responses of DA neurons aligned to onset of cues (presented 0 to 0.3 s) that were most activated by cue 1 among type 1 neurons (top, n = 58) or by cue 3 among type 2 neurons (bottom, n = 37). Mean ± SEM.
Fig. 4.
Fig. 4.. Type 2 DA error responses are slower than RPE-type DA responses.
(A) Average response to 50R delivery (top, type 1, n = 81; bottom, type 2, n = 78). Means ± SEM. Black bar, duration of reward delivery. Blue and gray bars, time window to analyze activity in (B) (see Materials and Methods for detail). (B) Average activity of type 1 (top) or type 2 (bottom) neurons during the early or late responses to 50R delivery. ***P < 0.001 (versus baseline), †P < 0.05, and †††P < 0.001, two-sided Wilcoxon signed-rank test. (C) Average response of an example type 1 (top) or type 2 (bottom) neuron around the reward end. Arrowhead, the last reward shot. (D) Histogram of d′ comparisons of the activity of type 1 (top) or type 2 (bottom) neurons before versus after 50R termination. Red line, median. Arrowhead, d′ of each example neuron as in (C). Significant shift from zero, type 1: ***P = 7.2 × 10−10; type 2: ***P = 2.0 × 10−7, two-sided Wilcoxon signed-rank test. (E) Spiking activity of each type 1 neuron (top, n = 81) or each type 2 neuron (bottom, n = 78) to 50N. (F) Histograms of the peak latencies of the neurons [as in (E)]. Black line, median. (G) Cumulative probability of the peak latencies of type 1 versus type 2 responses to 50N [as in (E and F)]. ***P = 1.3 × 10−4, Kolmogorov-Smirnov test. (H to J) Same as (E to G) but for responses to 50R (type 1, n = 81; type 2, n = 78). ***P = 3.2 × 10−7, Kolmogorov-Smirnov test. (K) Trial-by-trial variability of spiking activity [as in (E and H)]. ***P < 0.001, two-sided Mann-Whitney U test with Bonferroni correction.
Fig. 5.
Fig. 5.. Type 2 DA error responses in calcium imaging.
(A) Schematic of calcium imaging from DA neurons. (B) Locations of the tip of the GRIN lenses (blue ovals) in two rats shown on top of the atlas image. Scale bar, 500 μm. (C) Field of view of a DAT-iCre rat expressing GCaMP8f in the VTA (left) and locations of type 1 (blue) or type 2 (magenta) neurons (right). Scale bar, 100 μm. (D) Number of type 1, type 2, or other neurons among all recorded DA neurons (n = 23 neurons from two rats). (E) Distribution of d′ comparisons of activity in response to 50R versus 50N of all recorded DA neurons. (F) Example calcium responses of four type 1 (top) and type 2 (bottom) DA neurons during the outcome periods. Means ± SEM.
Fig. 6.
Fig. 6.. Type 2 DA neurons primarily signal error to actively process reward omission and provide a mechanism to switch toward future reward.
(A) Average spiking activity of type 2 neurons (top, mean ± SEM across neurons, n = 73 neurons) and an example lever trajectory in a trial (bottom), aligned to NR (NR) onset after 50N or 0N. (B) Average spiking activity of an example type 2 neuron aligned to NR onset after 50N (top) and trial-by-trial correlation between the spiking activities of the example neuron (as in top) and NR-Push(1) latencies in the session (bottom, n = 44 trials, ρ = −0.34 and P = 0.022, Spearman’s rank correlation test). (C) Left: Histogram of the correlation coefficients (ρ) between the spiking activities after 50N and NR-Push(1) latencies [as in (B), bottom, for an example neuron] across type 2 neurons (n = 73). Red line, median. Black box, neurons with significant correlation coefficient (P < 0.05). Gray box, not significant. Significant shift from zero, *P = 0.025, two-sided Wilcoxon signed-rank test. Right: Same as left but for activity after 0N. P = 0.88. (D) Same as in (A) but those aligned to the time crossing the lever-position(−1) after 0N. Shown above is a box plot for average cue offsets in the recording sessions (top). Vertical line, median. (E) Same as in (B) but for an example activity aligned to time crossing the lever-position(−1) (top) and trial-by-trial correlation between the activity and Push(−1)-Push(1) latencies (bottom, n = 46 trials, ρ = −0.32 and P = 0.029). (F) Same as (C) but the correlation coefficients between the spiking activities after 0N and Push(−1)-Push(1) latencies. Significant shift from zero, *P = 0.035. (G) Average responses of type 2 neurons aligned to cue 3 onset that were most activated by cue 3 (top, n = 37). Mean ± SEM. Histograms of trial-by-trial correlation coefficients between each neuron’s activity and Cue-Pull latency after cue 3 (bottom). *P = 0.017.
Fig. 7.
Fig. 7.. Type 2 DA error signal reflected in the NAc provides a mechanism for learning to efficiently overcome unexpected NR.
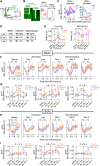
(A) Measurement of DA levels in NAc using fiber photometry. (B) Left: Example expression of GRABDA2m (green) and optic fiber (white rectangle) in dNAc and vlNAc. Scale bar, 1 mm. Right: Fiber tip location in dNAc (left, n = 7, AP: +1.7 mm) and vlNAc (right, n = 8, AP: +1.0 mm). (C) Example average DA response recorded in a relatively late session recorded in dNAc (left) or vlNAc (right). Means ± SEM across trials. (D) Schematic of the 50R extinction and reintroduction task. (E) Cue-Pull (left) and NR-Push(1) (right) latency after cue 2 or cue 3 across the task. Means ± SEM. Before, 1 day before the 50R extinction. “Ext. last,” the last day of the extinction. “Re. day1,” day 1 of reintroduction of 50R. Significant difference of latency as compared to that before extinction. *P < 0.05 and **P < 0.01, two-sided Wilcoxon signed-rank test with Bonferroni correction, n = 11 rats. (F and G) Average DA responses after NR following cue 2 in dNAc with fast (25% of all trials, orange), medium (50%, gray), or slow (25%, purple) NR-Push(1) latencies across the task. Changes of DA levels aligned to NR onset (F) and average DA levels during 0 to 1.2 s (left), 0.6 to 1.2 s (middle), or 0 to 0.6 s (right) in each session (G). Significant effect of NR-Push(1) latency, *P < 0.05, **P < 0.01, and *** P < 0.001, Kruskal-Wallis test. NS, not significant (F). Significant difference of DA levels as compared to that before extinction. *P < 0.05, **P < 0.01, and *** P < 0.001, two-sided Wilcoxon signed-rank test with Bonferroni correction (G). (H and I) Same as (F and G) but for DA levels in vlNAc.
Fig. 8.
Fig. 8.. Type 2 DA error signals are prominent initially but become weaker in the transition from the operant task to a Pavlovian task where reward outcomes can be passively processed.
(A) Left: Transition from the operant task to the Pavlovian task. Right: Structure of a trial. ITI was 35 s on average. (B) Number of licks during the cue and trace period in the task. Means ± SEM. Last or “Last −1” indicates last or the day before the last day in the Pavlovian task. (C) Average DA responses to reward in dNAc (top) or vlNAc (bottom) in the task. Means ± SEM across trials. n = 7 (top) or 8 (bottom) rats. See Materials and Methods for the total number of trials. Black bar, duration of reward (2.8 s). Light blue or gray bar, time window used for analysis in (D) or (E), respectively. (D) Left: Average DA levels in dNAc (top) or vlNAc (bottom) across all trials in response to 100R or 50R. Means ± SEM. Right: DA levels on day 1 or the last day. Means ± SEM. See fig. S8A for box plots. *P < 0.05, **P < 0.01, and ***P < 0.001, two-sided Wilcoxon signed-rank test; †P < 0.05 and †††P < 0.001, two-sided Mann-Whitney U test. (E) Same as (D) but for response after reward. (F) Average DA responses to NR in dNAc (top) or vlNAc (bottom). Means ± SEM. Magenta bar, time window of a response to NR as in (G). (G) Same as in (D) but for response to 50N or 100N.
Fig. 9.
Fig. 9.. Type 2 DA responses provide a mechanism for learning to adjust behavior toward the pursuit of the next reward early in the Pavlovian task.
(A) DA transients in dNAc (left, n = 105 trials across seven rats) or vlNAc (right, n = 121 trials across eight rats) in response to 50R on day 1. (B) Cumulative probability of the peak latencies in response to 50R [as in (A)]. ***P = 2.1 × 10−19, Kolmogorov-Smirnov test. (C and D) Same as (A and B), but for responses after 50R termination. **P = 0.0040 (D). (E) Example average DA response in dNAc (top) and number of licks (bottom) after 100R end in the day 1. Black bar, reward delivery (the last shot at 2.8 s). (F) DA transients in dNAc in the first 2 days (left, n = 432 trials across seven rats) and in the last 2 days (right, n = 416 trials). (G) Trial-by-trial correlation between latency to stop licking and DA level in dNAc in the first 2 days (left, n = 432 trials, ρ = −0.24 and ***P = 3.6 × 10−7, Spearman’s rank correlation test) or the last 2 days (right, n = 416 trials, ρ = −0.076, and P = 0.12). (H to J) Same as (E to G), but for vlNAc. n = 504 trials, ρ = 0.17, and ***P = 8.9 × 10−5 [(J), left]; n = 485 trials, ρ = 0.24, and ***P = 8.8 × 10−8 [(J), right]. (K and L) Same as (G and J) but for DA levels in response to 50N. n = 110 trials, ρ = −0.37, and ***P = 6.5 × 10−5 [(K), left]; n = 139 trials, ρ = −0.12, and P = 0.18 [(K), right]; n = 134 trials, ρ = −0.023, and P = 0.79, [(L), left]; n = 129 trials, ρ = 0.014 and P = 0.87 [(L), right].

References

    1. M. Ogawa, M. A. A. van der Meer, G. R. Esber, D. H. Cerri, T. A. Stalnaker, G. Schoenbaum, Risk-responsive orbitofrontal neurons track acquired salience. Neuron 77, 251–258 (2013). - PMC - PubMed
    1. M. E. Bouton, Learning and Behavior: A Contemporary Synthesis (SinauerAssociates Inc., 2007), pp. 346–353.
    1. J. M. Pearce, Animal Learning and Cognition: An Introduction, 3rd ed. (Psychology Press, 2008), pp. 130–134.
    1. V. F. Sheffield, Extinction as a function of partial reinforcement and distribution of practice. J. Exp. Psychol. 39, 511–526 (1949). - PubMed
    1. A. Amsel, Frustration theory: An analysis of dispositional learning and memory (Cambridge University Press, 2010).