. 2023 Mar 14;120(11):e2210480120.
doi: 10.1073/pnas.2210480120. Epub 2023 Mar 10.

Transcription shapes 3D chromatin organization by interacting with loop extrusion

Affiliations

Transcription shapes 3D chromatin organization by interacting with loop extrusion

Edward J Banigan et al. Proc Natl Acad Sci U S A. .

Abstract

Cohesin folds mammalian interphase chromosomes by extruding the chromatin fiber into numerous loops. "Loop extrusion" can be impeded by chromatin-bound factors, such as CTCF, which generates characteristic and functional chromatin organization patterns. It has been proposed that transcription relocalizes or interferes with cohesin and that active promoters are cohesin loading sites. However, the effects of transcription on cohesin have not been reconciled with observations of active extrusion by cohesin. To determine how transcription modulates extrusion, we studied mouse cells in which we could alter cohesin abundance, dynamics, and localization by genetic "knockouts" of the cohesin regulators CTCF and Wapl. Through Hi-C experiments, we discovered intricate, cohesin-dependent contact patterns near active genes. Chromatin organization around active genes exhibited hallmarks of interactions between transcribing RNA polymerases (RNAPs) and extruding cohesins. These observations could be reproduced by polymer simulations in which RNAPs were moving barriers to extrusion that obstructed, slowed, and pushed cohesins. The simulations predicted that preferential loading of cohesin at promoters is inconsistent with our experimental data. Additional ChIP-seq experiments showed that the putative cohesin loader Nipbl is not predominantly enriched at promoters. Therefore, we propose that cohesin is not preferentially loaded at promoters and that the barrier function of RNAP accounts for cohesin accumulation at active promoters. Altogether, we find that RNAP is an extrusion barrier that is not stationary, but rather, translocates and relocalizes cohesin. Loop extrusion and transcription might interact to dynamically generate and maintain gene interactions with regulatory elements and shape functional genomic organization.

Keywords: chromatin organization; cohesin; genome organization; loop extrusion; transcription.


Conflict of interest statement

The authors declare no competing interest.

Figures
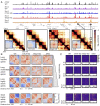
Fig. 1.
Fig. 1.
Transcription and cohesin generate characteristic patterns of contacts and cohesin accumulation near active genes. (ATop, ChIP-seq tracks for CTCF in WT (black) and Scc1 (cohesin) in WT, CTCF KO, Wapl KO, and DKO cells (purple, blue, red, and orange, respectively) for a 5-Mb region of chromosome 1, with the corresponding gene track below. Bottom, Hi-C contact maps for the corresponding region. Boxes in DKO identify examples of island–island dots, with arrows pointing to the corresponding cohesin islands in the ChIP-seq tracks. Insets, Averages of observed-over-expected contacts (Materials and Methods) centered on island–island dots separated by genomic distances 50 kb < s < 350 kb (n = 1314) and plotted with a log10 color scale. Numbers indicate dot strengths (Materials and Methods). (B) Average observed-over-expected Hi-C contact maps centered and oriented on the TSS for long genes (80 kb < L < 120 kb) and stratified by GRO-seq transcripts per million (TPM; top three rows; TPM < 0.6, 0.6 ≤ TPM < 3.6, and 3.6 ≤ TPM, respectively) and short active genes (bottom row; length 10 kb < L < 30 kb; TPM > 3.6). n = 184, 139, and 176, respectively, for long genes except for DKO, where n = 123, 233, and 143; n = 407 for short genes except for DKO, where n = 592. (C) Cohesin (Scc1) ChIP-seq heat maps and average tracks near long genes stratified by TPM (top three rows) or short active genes (bottom row) oriented and aligned at their TSSs. Heat maps depict the longest 50% of genes in the group sorted by decreasing length from top to bottom. Dotted lines in average plots indicate the length of the longest gene in the respective set.
Fig. 2.
Fig. 2.
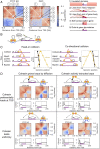
Transcription as a moving barrier for loop extrusion recapitulates the major features of genome organization and cohesin accumulation around active genes. (A) Observed-over-expected contact maps around long active genes for CTCF KO and DKO with five major features identified and illustrated. (B) Schematics of the moving barrier model. Cohesins (yellow and pink) bind to chromatin and extrude loops until unbinding. RNAPs (open ellipses) are loaded at the promoter, translocate through the gene (purple), and are unloaded at the 3′ end. (C) Arch diagrams and schematic trajectories illustrating time series of two types of collisions between extruding cohesins and translocating RNAP that may occur in genes in the model. Yellow circles depict the two genomic positions at the base of the extruded loop bridged by a cohesin. During head-on collisions, RNAP pushes cohesin until the cohesin bypasses the RNAP, the RNAP stops translocating (beyond the 3′ end), or either the RNAP or cohesin unbinds. During codirectional collisions, extrusion by cohesin translocation is slowed by the RNAP barrier moving toward 3′. In both cases, interactions between RNAP and cohesin only alter extrusion on one side of cohesin; collisions do not affect growth of the other side of the extruded loop or RNAP translocation. The trajectory plots show genomic position versus time for RNAP (black) and cohesin’s two sides (yellow). The filled circles indicate the time points and positions corresponding to the illustrations. (D) Average observed-over-expected maps and cohesin accumulation tracks near active genes in CTCF KO and DKO simulations. Results shown for simulations with either active extrusion or passive, diffusive loop extrusion, each with either uniform cohesin loading or preferential loading at TSSs. Gene positions are indicated by purple bars on the x-axes. The illustrations depict cohesin loading and translocation.
Fig. 3.
Fig. 3.
Predictions of the moving barrier model. (A) Top, Drawing showing contacts between ends of nearby genes in four pairs of orientations. Bottom, average observed-over-expected maps centered on contacts between the nearest ends of pairs of active (TPM > 2) genes separated by 50 kb < s < 350 kb. At least one gene in each pair of genes is not near a CTCF site (Materials and Methods). (B) Zoomed-in views of average observed-over-expected maps for CTCF KO and DKO in experiments and simulations with active, directed loop extrusion with and without preferential cohesin loading at TSSs. Arrows indicate the presence or lack of an extra line of enriched genomic contacts characteristic of cohesin loading at the TSS. Gene positions are shown by purple bars on the axes.
Fig. 4.
Fig. 4.
NIPBL and MAU2 colocalize predominantly with cohesin but not the TSS throughout the genome. (A) ChIP-seq profiles of HA–NIPBL (−/+dTAG), MAU2–HA (−/+dTAG), HA–WAPL (−/+dTAG), GFP–WAPL, SCC1–GFP, and CTCF–GFP along an exemplary 581-kb region of chromosome 2, illustrating the typical distribution and colocalization of sequencing read pileups. Genes within this region are depicted above. The red rectangle on the Left indicates one region of interest, and a zoom-in view is shown on the Right. (B) Heat maps of HA–NIPBL (−/+dTAG) and SCC1 ChIP-seq at TSSs with cohesin, TSSs without cohesin, and cohesin sites not at TSSs. (C) Area-proportional threefold eulerAPE Venn diagram illustrating overlap between NIPBL–MAU2 cosites, SCC1, and TSS. (D) Enrichment profiles of HA–NIPBL (−/+ SCC1 RNAi) and MAU2–HA (−/+ SCC1 RNAi) along an exemplary 185-kb region of chromosome 9, illustrating typical distribution and colocalization of sequencing read pileups. Genes within this region are depicted above. (E) Average signal profiles of HA–NIPBL (−/+ SCC1 RNAi) or MAU2 (−/+ SCC1 RNAi) around NIPBL–MAU2 cosites.

References

    1. Banigan E. J., Mirny L. A., Loop extrusion: Theory meets single-molecule experiments. Curr. Opin. Cell Biol. 64, 124–138 (2020). - PubMed
    1. Yatskevich S., Rhodes J., Nasmyth K., Organization of chromosomal DNA by SMC complexes. Annu. Rev. Genet. 53, 445–482 (2019). - PubMed
    1. Davidson I. F., et al. , DNA loop extrusion by human cohesin. Science 366, 1338–1345 (2019). - PubMed
    1. Kim Y., Shi Z., Zhang H., Finkelstein I. J., Yu H., Human cohesin compacts DNA by loop extrusion. Science 366, 1345–1349 (2019). - PMC - PubMed
    1. Golfier S., Quail T., Kimura H., Brugués J., Cohesin and condensin extrude DNA loops in a cell cycle-dependent manner. Elife 9, e53885 (2020). - PMC - PubMed

Publication types