. 2023 Mar 14;120(11):e2215376120.
doi: 10.1073/pnas.2215376120. Epub 2023 Mar 10.

MYC-driven synthesis of Siglec ligands is a glycoimmune checkpoint

Affiliations

MYC-driven synthesis of Siglec ligands is a glycoimmune checkpoint

Benjamin A H Smith et al. Proc Natl Acad Sci U S A. .

Abstract

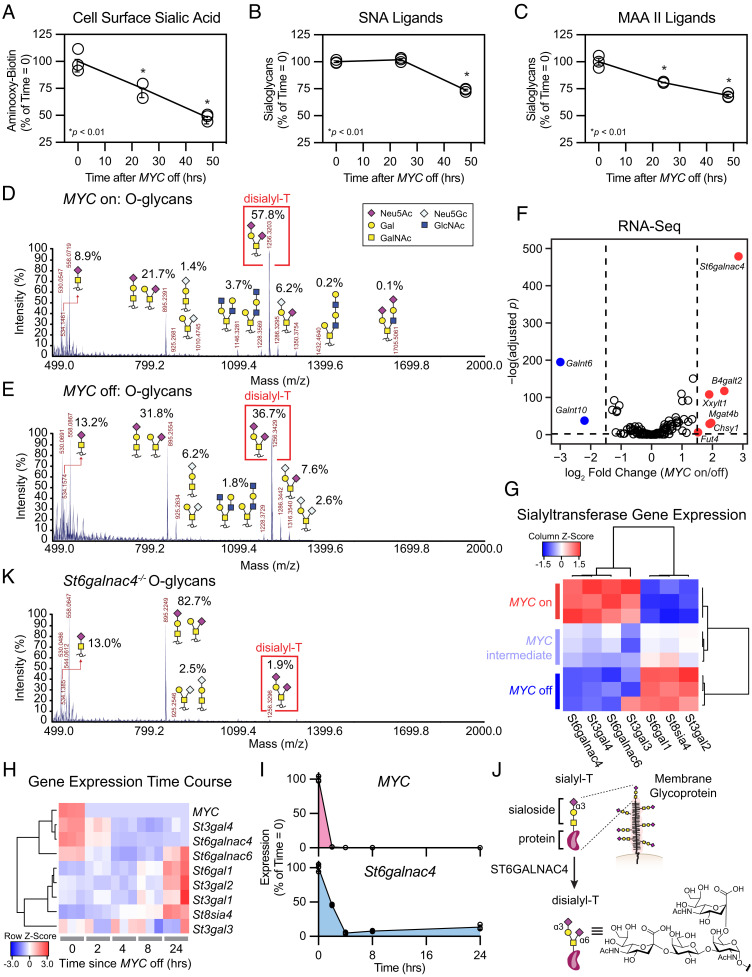
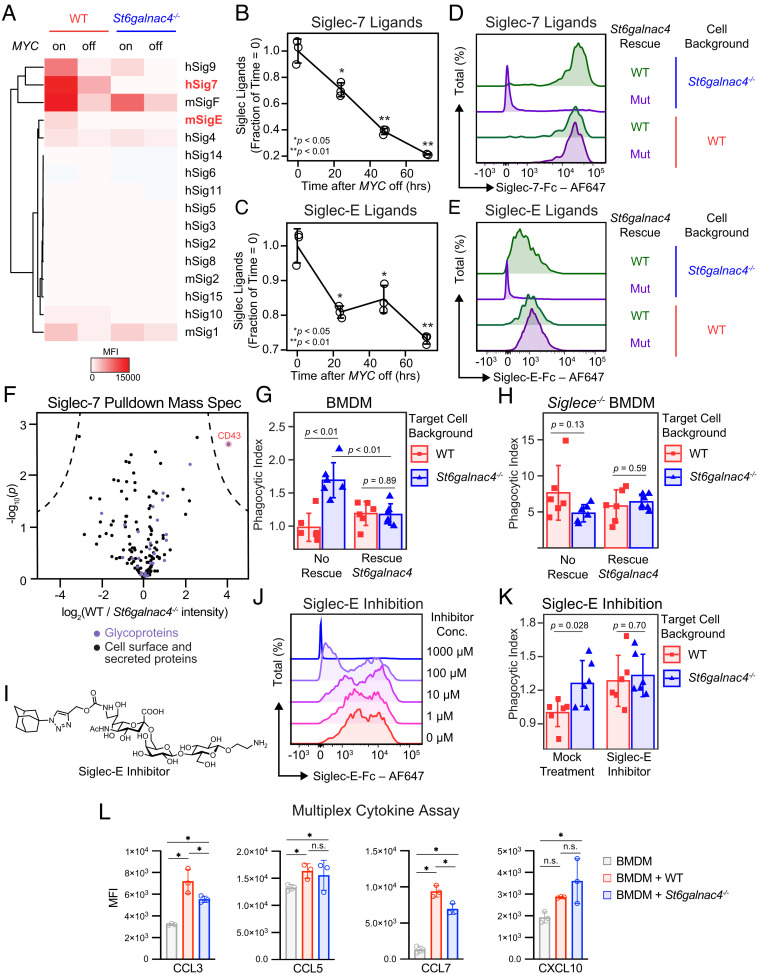
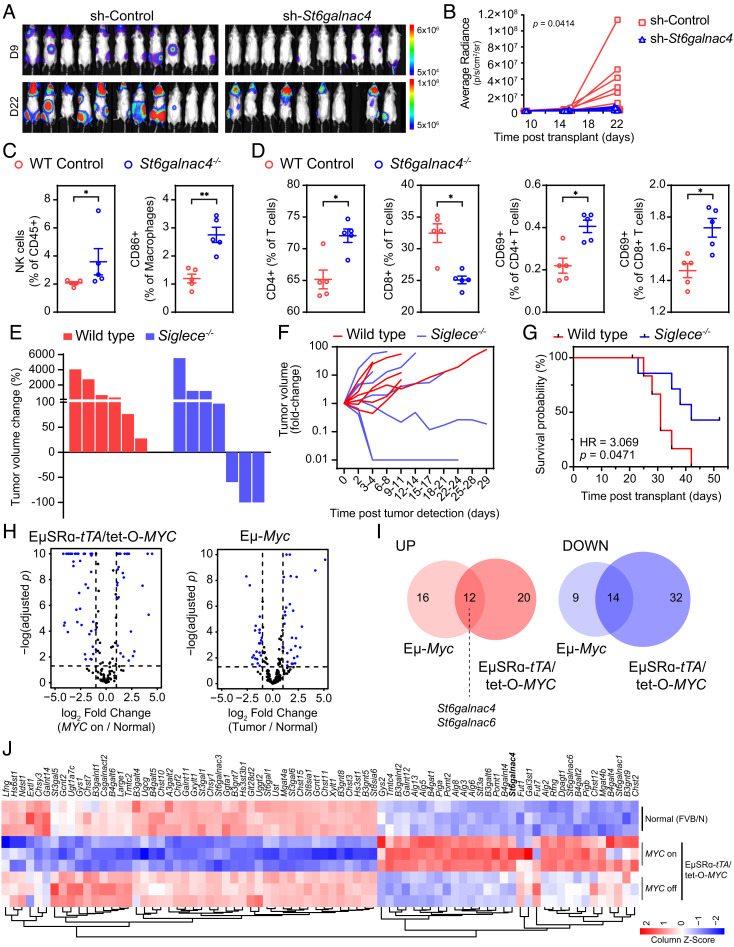
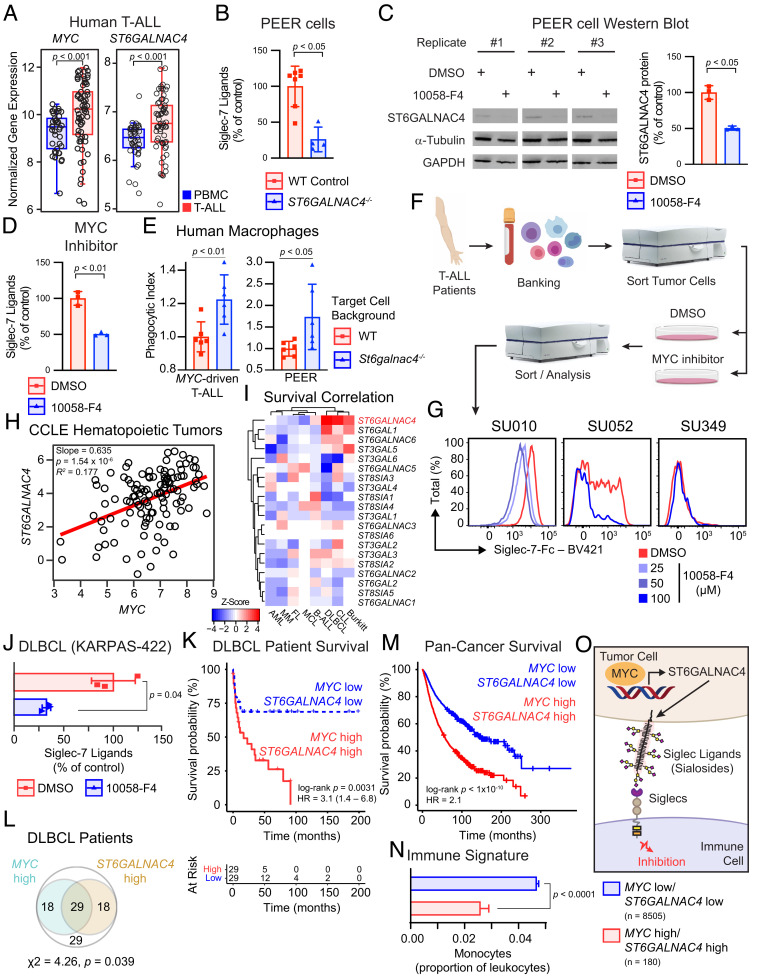
The Siglecs (sialic acid-binding immunoglobulin-like lectins) are glycoimmune checkpoint receptors that suppress immune cell activation upon engagement of cognate sialoglycan ligands. The cellular drivers underlying Siglec ligand production on cancer cells are poorly understood. We find the MYC oncogene causally regulates Siglec ligand production to enable tumor immune evasion. A combination of glycomics and RNA-sequencing of mouse tumors revealed the MYC oncogene controls expression of the sialyltransferase St6galnac4 and induces a glycan known as disialyl-T. Using in vivo models and primary human leukemias, we find that disialyl-T functions as a "don't eat me" signal by engaging macrophage Siglec-E in mice or the human ortholog Siglec-7, thereby preventing cancer cell clearance. Combined high expression of MYC and ST6GALNAC4 identifies patients with high-risk cancers and reduced tumor myeloid infiltration. MYC therefore regulates glycosylation to enable tumor immune evasion. We conclude that disialyl-T is a glycoimmune checkpoint ligand. Thus, disialyl-T is a candidate for antibody-based checkpoint blockade, and the disialyl-T synthase ST6GALNAC4 is a potential enzyme target for small molecule-mediated immune therapy.

Keywords: MYC; Siglec; glycosylation; oncogene.


Conflict of interest statement

The authors have organizational affiliations to disclose: C.R.B. is a cofounder of Redwood Biosciences (a subsidiary of Catalent), Enable Biosciences, Palleon Pharmaceuticals, InterVenn Bio, Lycia Therapeutics, and OliLux Biosciences, and a member of the Board of Directors of Eli Lilly. R.M. is on the Board of Directors of CircBio, the Advisory Boards of Kodikaz Therapeutic Solutions, Syros Pharmaceuticals, and TenSixteen Bio. The authors have stock ownership to disclose: R.M. is a cofounder and equity holder of CircBio, Pheast Therapeutics, MyeloGene, and RNAC Therapeutics. The authors have patent filings to disclose: B.A.H.S., A.D., S.W., C.R.B., and D.W.F. are coinventors on a patent application related to this work held by Stanford University. R.M. is an inventor on a number of patents related to CD47 cancer immunotherapy licensed to Gilead Sciences. The authors have research support to disclose: R.M. receives research support from Gilead Sciences and CircBio.

Figures

Fig. 1.
Fig. 1.
MYC regulated St6galnac4 promotes display of the glycan disialyl-T. (A) Murine T-ALL cell surface sialic acids were quantified at various time points after doxycycline administration to turn off expression of the MYC transgene. Sialic acids were detected via oxidation with mild periodate treatment and subsequent labeling with an aminooxy-biotin probe (n = 3 per time point, two-tailed Student’s t test comparing each time point to t = 0 h, *P < 0.05, **P < 0.01). Data are normalized to control, mean ± SEM. (B and C) Sialoglycans were measured at various time points using the lectins SNA and MAA II after turning MYC off (n = 3 per time point, two-tailed Student’s t test comparing each time point to t = 0 h, *P < 0.05, **P < 0.01). Data are normalized to control, mean ± SD. (D and E) The O-glycome of MYC on (D) and off (E) cells was profiled by MALDI-TOF mass spectrometry following β-elimination. The relative abundance of recognizable glycan species within the spectrum is indicated. (F) RNA-sequencing of cells in the MYC on and off states. Volcano plot shows differential expression of annotated glycogenes. Genes exhibiting log2 fold changes greater than 1.5 and meeting a significance threshold of < 0.01 at an FDR = 0.01 are highlighted (n = 3 per treatment group). (G) Heatmap of sialyltransferases meeting an expression threshold >2 transcripts per million (TPM). Data are displayed as a Z-score from column-normalized TPMs. (H) Heatmap of MYC transgene and relevant sialyltransferase expression generated by RNA-seq of T-ALL at the indicated time after doxycycline administration to turn MYC off. Data are displayed as a Z-score from row normalized TPMs (n = 3 per group). (I) Expression of the MYC transgene and St6galnac4 were profiled by RNA-seq in T-ALL at the indicated time after turning off MYC. Data are normalized to t = 0 h, mean ± SD (n = 3 per group). (J) Schematic for elaboration of sialyl-T into disialyl-T by ST6GALNAC4. (K) The O-glycome of St6galnac4−/− cells was profiled by MALDI-TOF mass spectrometry following β-elimination.
Fig. 2.
Fig. 2.
ST6GALNAC4 synthesizes Siglec-E/-7 ligands. (A) Heatmap of Siglec binding capacity displayed by control or St6galnac4−/− T-ALL as measured by flow cytometry following staining with the indicated Siglec-Fc reagent. Cells were treated with either PBS or doxycycline for 48 h to turn off the MYC transgene. Siglec-Fc reagents are indicated on the right side of the plot, where “m” indicates murine and “h” indicates human. Bold/red font highlights substantial reductions in the presentation of ligands for human Siglec-7 and murine Siglec-E on St6galnac4−/− and MYC off cells. Plot is representative of two independent experiments. (B and C) Display of ligands for Siglec-7 (B) and Siglec-E (C) on murine T-ALL at the indicated time points after turning MYC off as quantified by flow cytometry following staining with a Siglec-Fc reagent (n = 3 per time point, two-tailed Student’s t test comparing each time point to t = 0 h. *P < 0.05, **P < 0.01, data are representative of two independent experiments). Data are normalized to control, mean ± SD. (D and E) Representative flow cytometry plots of Siglec-7 (D) and Siglec-E (E) ligands displayed by WT and St6galnac4−/− cells reexpressing wild type (WT) or mutant (Mut) St6galnac4. Plots are representative of three independent experiments. (F) Proteins enriched by immunoprecipitation of T-ALL lysate with Siglec-7-Fc were identified by shotgun proteomics. Annotated cell surface or secreted proteins are displayed on the plot in black, with purple denoting the subset of glycoproteins. The intensity of spectra from WT relative to St6galnac4−/− T-ALL is displayed [n = 3 per group, significance cutoff by Student’s t test with a false discovery rate of 0.0001 and minimum enrichment (S0) of 5]. (G) Phagocytosis by BMDMs of WT and St6galnac4−/− T-ALL rescued by transfection with empty vector or St6galnac4 (n = 6 per group, two-tailed Student’s t test). Data are normalized to control (WT, no rescue) and presented as mean ± SD. (H) Phagocytosis by Siglece−/− BMDMs of WT and St6galnac4−/− T-ALL rescued by transfection with empty vector or St6galnac4 (n = 6 per group, two-tailed Student’s t test). Data are normalized to control (WT target cells, WT BMDMs, no rescue) and presented as mean ± SD. (I) Structure of the Siglec-E inhibitor. (J) Inhibition of Siglec-E-Fc binding to murine T-ALL by the Siglec-E inhibitor. Plot representative of three independent experiments. (K) Phagocytosis by BMDMs of control and St6galnac4−/− T-ALL in the presence of Siglec-E inhibitor or mock DMSO treatment (n = 6 per group, two-tailed Student’s t test). Data are normalized to control (mock-treated WT target cells) and presented as mean ± SD. (L) Cytokines released by BMDMs after incubation with anti-Thy1.1 antibody plus WT or St6galnac4−/− target cells (n = 3 per group, two-way ANOVA using a single family and Tukey’s test for multiple comparisons, * is significant with adjusted < 0.0001). Full multiplex cytokine panel in supplement.
Fig. 3.
Fig. 3.
St6galnac4 promotes tumor growth in vivo. (A) Bioluminescence imaging of syngeneic WT FVB/N mice transplanted IV with luciferase-labeled MYC-driven T-ALL cells expressing either a St6galnac4-specific or control shRNA. Images show tumor burden on day 9 and 22 posttransplantation. (B) Tumor growth in mice described in (A) was assessed by bioluminescence imaging over time and quantified [n(sh-Control) = 11, n(sh-St6galnac4−/−) = 9, mixed effects analysis]. (C and D) Flow cytometric analysis of splenocytes (C) and peripheral blood mononuclear cells (D) isolated from FVB/N mice 23 d after IV-transplantation of MYC-driven T-ALL expressing either wild type (WT) St6galnac4 (WT Control, n = 5) or lacking St6galnac4 expression (St6galnac4−/−, n = 5). Frequencies of indicated immune cell subsets are shown per mouse (two-tailed Mann–Whitney test, *P < 0.05, **< 0.01). (E and F) MYC-driven T-ALL was transplanted subcutaneously into either WT or Siglece−/− mice. Tumor growth was monitored by caliper measurement. (G) Survival of T-ALL bearing WT and Siglece−/− mice after undergoing subcutaneous T-ALL transplantation. HR, hazard ratio from the Mantel-Cox test. (H) Volcano plots displaying glycogenes in MYC-driven mouse models of Burkitt lymphoma (Eμ-Myc) and T-ALL (EμSRα-tTA/tet-O-MYC). (I) Overlap analysis of differentially expressed glycogenes (at least twofold change with FDR < 0.05) from (H) (glycogenes up and down: OR = 4.91, = 9.04 × 10⁻⁷) in mouse models of Burkitt lymphoma (Eμ-Myc) and T-ALL (EμSRα-tTA/tet-O-MYC). (J) Heat map representation of glycogenes that are differentially expressed in splenocytes isolated from EμSRα-tTA/tet-O-MYC (MYC on/off) and normal (FVB/N) mice. Expression in normal tissue, in MYC on tumor tissue, and upon MYC inactivation-induced tumor regression (MYC off) is shown (n = 3 per treatment group).
Fig. 4.
Fig. 4.
MYC promotes Siglec-7 ligand display on human cancer. (A) Summarized gene expression of MYC and ST6GALNAC4 in human T-ALL and peripheral blood mononuclear cells (PBMCs). Data from GSE62156, GSE27562, and GSE49515 were collated, and absolute expression was determined with Gene Expression Commons [n(tumor) = 65, n(control) = 45, two-tailed Mann–Whitney U test]. Boxplot shows data quartiles. (B) Siglec-7 ligands on PEER cells following knockout of ST6GALNAC4 [n(control) = 7, n(KO) = 4, two-tailed Mann–Whitney U test]. Data presented as mean ± SD. (C) Representative Western blot for ST6GALNAC4 in PEER cells following MYC inhibition with 100 μM 10058-F4 for 48 h. Quantification of ST6GALNAC4 band intensity normalized to α-tubulin and WT control (n = 3 per group, two-tailed Student’s t test). Data presented as mean ± SD. (D) Siglec-7 ligands on PEER cells following pharmacologic MYC inhibition for 48 h by incubation with 100 μM 10058-F4 (n = 3 per group, two-tailed Student’s t test). Data presented as mean ± SD. (E) Phagocytosis of WT and St6galnac4−/− murine MYC-driven T-ALL and human PEER cells by human monocyte derived macrophages (n = 6 per group, two-tailed Student’s t test). Data are normalized to WT control and presented as mean ± SD. (F) Workflow to collect primary T-ALL from patients, treat with a MYC inhibitor (10058-F4), and quantify Siglec-7 ligands. (G) Siglec-7 ligands on patient T-ALL liquid biopsies treated with the indicated concentration of 10058-F4 for 48 h. Data represent three donors. (H) Correlation of ST6GALNAC4 and MYC mRNA (RNA-seq) gene expression across all hematopoietic tumor samples (n = 106) in the CCLE with MYC expression > 3. Correlation determined by least-squares regression. (I) Survival Z-score heatmap for each sialyltransferase across each hematopoietic tumor within the PRECOG database. Larger positive Z-Scores (red) indicate that patients with higher expression of the indicated gene exhibit reduced survival. AML, acute myeloid leukemia; MM, multiple myeloma; FL, follicular lymphoma; MCL, mantle cell lymphoma; B-ALL, B cell acute lymphoblastic leukemia; DLBCL, diffuse large B cell lymphoma; CLL, chronic lymphocytic leukemia. (J) Siglec-7 ligand display by KARPAS-422 DLBCL cells following treatment with 100 μM 10058-F4 for 48 h (n = 3 per group, two-tailed Student’s t test). Data presented as mean ± SD. (K) Survival stratified by median MYC and ST6GALNAC4 expression in a cohort of DLBCL patients (GSE4475). HR, hazard ratio from Cox Proportional Hazards model. (L) Venn diagram of patients in the same DLBCL cohort, showing individuals that fall into MYC high and ST6GALNAC4 high (greater than median expression) groups (χ2-test for independence). (M) Pan-cancer overall survival analysis of TCGA data stratifying patients by median MYC and ST6GALNAC4 expression (n = 2,376 per group). HR, hazard ratio from Cox Proportional Hazards model. (N) Pan-cancer immune phenotype of TCGA tumors stratified by k-means clustering based on MYC and ST6GALNAC4 expression. Monocyte prevalence was calculated as a fraction of all leukocytes. Data presented as mean ± SEM. (O) Model for MYC-driven display of disialyl-T and regulation of the immune response via Siglec engagement.

References

    1. Bärenwaldt A., Läubli H., The sialoglycan-Siglec glyco-immune checkpoint - a target for improving innate and adaptive anti-cancer immunity. Expert Opin. Ther. Targets 23, 839–853 (2019). - PubMed
    1. Macauley M. S., Crocker P. R., Paulson J. C., Siglec-mediated regulation of immune cell function in disease. Nat. Rev. Immunol. 14, 653–666 (2014). - PMC - PubMed
    1. Duan S., Paulson J. C., Siglecs as immune cell checkpoints in disease. Annu. Rev. Immunol. 38, 365–395 (2020), 10.1146/annurev-immunol-102419-035900. - DOI - PubMed
    1. Smith B. A. H., Bertozzi C. R., The clinical impact of glycobiology: Targeting selectins, Siglecs and mammalian glycans. Nat. Rev. Drug Discov. 20, 217–243 (2021), 10.1038/s41573-020-00093-1. - DOI - PMC - PubMed
    1. Barkal A. A., et al. , CD24 signalling through macrophage Siglec-10 is a target for cancer immunotherapy. Nature 572, 392–396 (2019). - PMC - PubMed

Publication types

LinkOut - more resources