

Microneurography as a minimally invasive method to assess target engagement during neuromodulation
- PMID: 36898148
- PMCID: PMC10587909
- DOI: 10.1088/1741-2552/acc35c
Microneurography as a minimally invasive method to assess target engagement during neuromodulation
Abstract
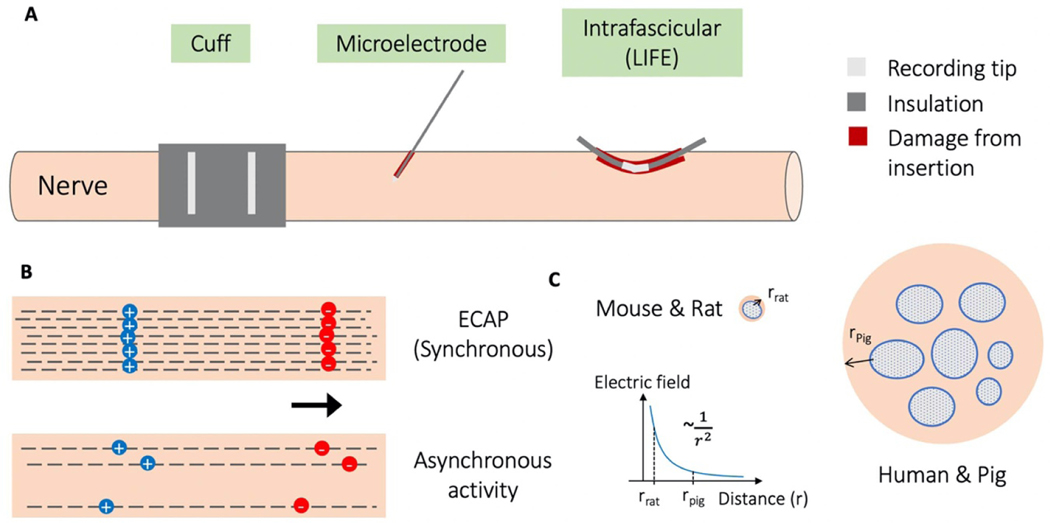
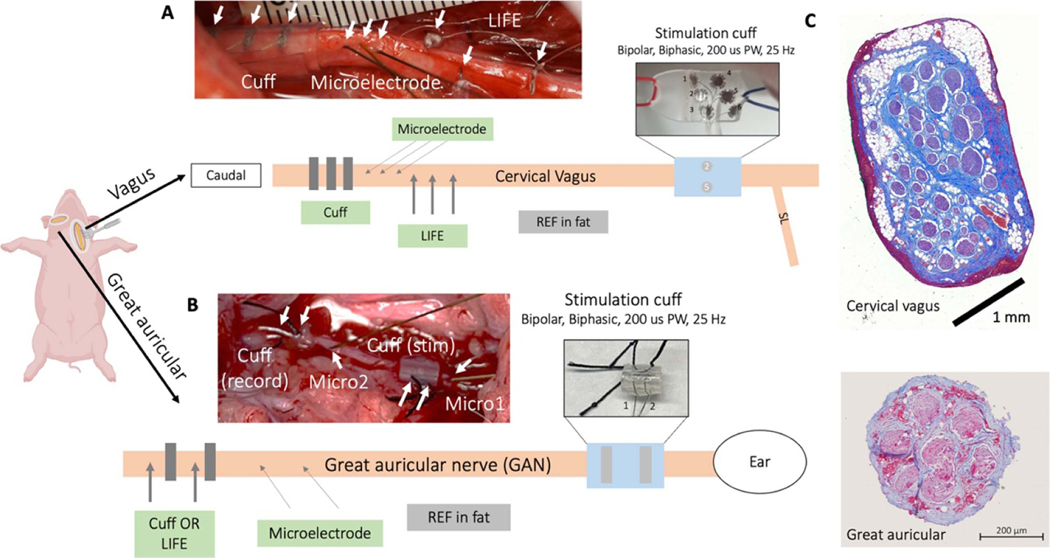
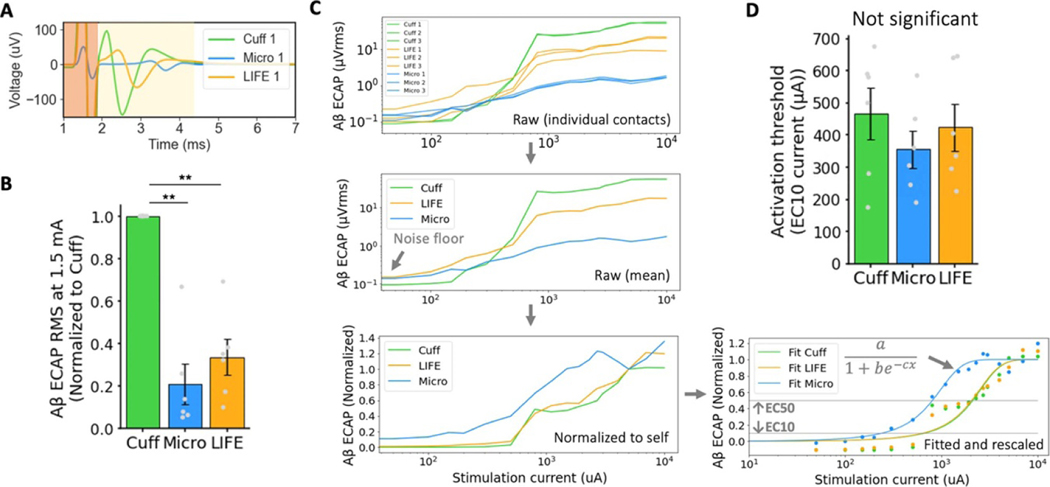
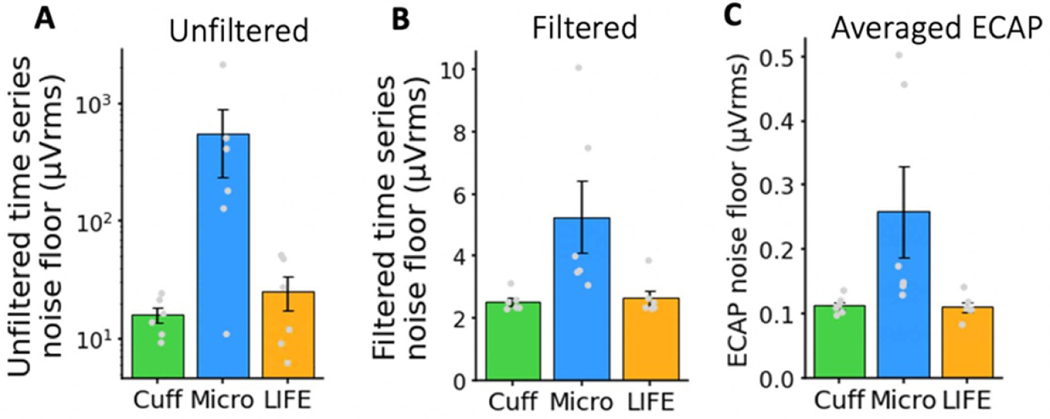
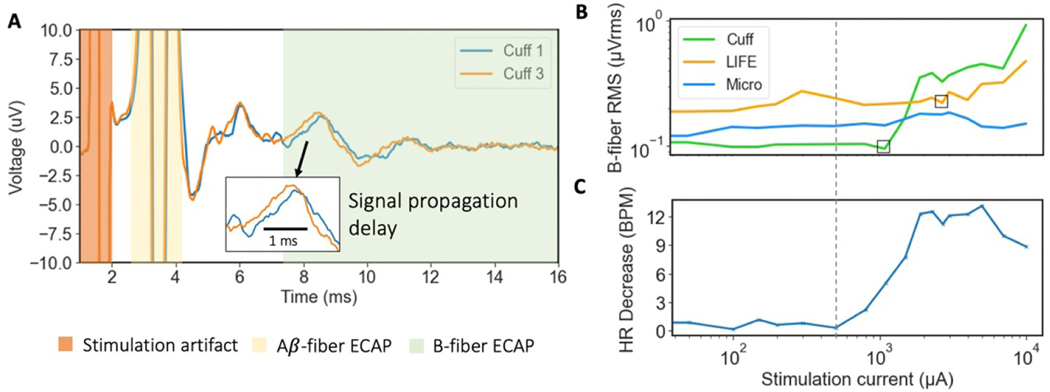
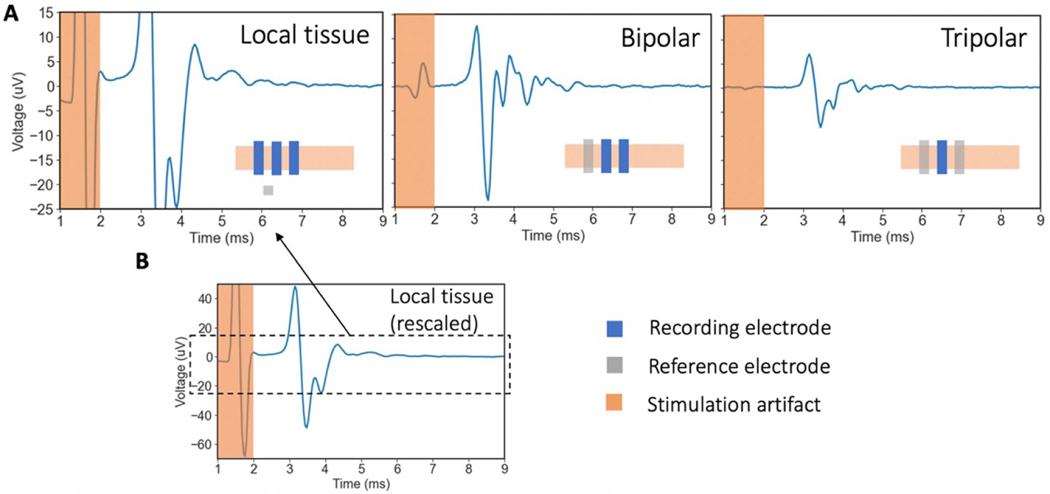
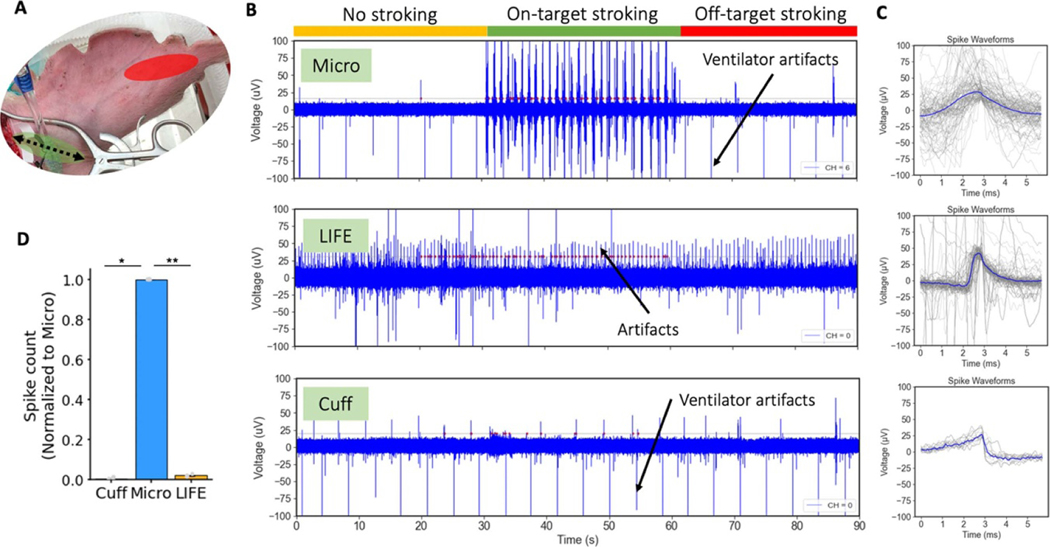
Objective.Peripheral neural signals recorded during neuromodulation therapies provide insights into local neural target engagement and serve as a sensitive biomarker of physiological effect. Although these applications make peripheral recordings important for furthering neuromodulation therapies, the invasive nature of conventional nerve cuffs and longitudinal intrafascicular electrodes (LIFEs) limit their clinical utility. Furthermore, cuff electrodes typically record clear asynchronous neural activity in small animal models but not in large animal models. Microneurography, a minimally invasive technique, is already used routinely in humans to record asynchronous neural activity in the periphery. However, the relative performance of microneurography microelectrodes compared to cuff and LIFE electrodes in measuring neural signals relevant to neuromodulation therapies is not well understood.Approach.To address this gap, we recorded cervical vagus nerve electrically evoked compound action potentials (ECAPs) and spontaneous activity in a human-scaled large animal model-the pig. Additionally, we recorded sensory evoked activity and both invasively and non-invasively evoked CAPs from the great auricular nerve. In aggregate, this study assesses the potential of microneurography electrodes to measure neural activity during neuromodulation therapies with statistically powered and pre-registered outcomes (https://osf.io/y9k6j).Main results.The cuff recorded the largest ECAP signal (p< 0.01) and had the lowest noise floor amongst the evaluated electrodes. Despite the lower signal to noise ratio, microneurography electrodes were able to detect the threshold for neural activation with similar sensitivity to cuff and LIFE electrodes once a dose-response curve was constructed. Furthermore, the microneurography electrodes recorded distinct sensory evoked neural activity.Significance.The results show that microneurography electrodes can measure neural signals relevant to neuromodulation therapies. Microneurography could further neuromodulation therapies by providing a real-time biomarker to guide electrode placement and stimulation parameter selection to optimize local neural fiber engagement and study mechanisms of action.
Keywords: ECAP; microneurography; minimally invasive; neuromodulation; peripheral neural recordings; target engagement; vagus nerve.
Creative Commons Attribution license.
Conflict of interest statement
Conflict of interest
NV was an employee of Abbott Neuromodulation and BioCircuit Technologies during the completion of this work. KAL is a scientific board member and has stock interests in NeuroOne Medical Inc. KAL is also a paid member of the scientific advisory board of Cala Health, Blackfynn, Abbott Neuromodulation, Presidio Medical, and Battelle. KAL also is a paid consultant for CVRx, Galvani, and the Alfred Mann Foundation. KAL is a co-founder of NeuronOff Inc. and NeuraWorx.
The remaining authors declare that the research was conducted in the absence of any commercial or financial relationships that could be construed as a potential conflict of interest.
Figures
Similar articles
-
Microneurography in rats: a minimally invasive method to record single C-fiber action potentials from peripheral nerves in vivo.Neurosci Lett. 2010 Feb 19;470(3):168-74. doi: 10.1016/j.neulet.2009.09.061. Epub 2009 Oct 2. Neurosci Lett. 2010. PMID: 19800936 Review.
-
Classification of naturally evoked compound action potentials in peripheral nerve spatiotemporal recordings.Sci Rep. 2019 Jul 31;9(1):11145. doi: 10.1038/s41598-019-47450-8. Sci Rep. 2019. PMID: 31366940 Free PMC article.
-
Fascicle specific targeting for selective peripheral nerve stimulation.J Neural Eng. 2019 Nov 11;16(6):066040. doi: 10.1088/1741-2552/ab4370. J Neural Eng. 2019. PMID: 31509815 Clinical Trial.
-
Selectivity of afferent microstimulation at the DRG using epineural and penetrating electrode arrays.J Neural Eng. 2019 Dec 13;17(1):016011. doi: 10.1088/1741-2552/ab4a24. J Neural Eng. 2019. PMID: 31577993 Free PMC article.
-
[Microneurography (author's transl)].No To Shinkei. 1982 Mar;34(3):205-15. No To Shinkei. 1982. PMID: 6284186 Review. Japanese. No abstract available.
Cited by
-
Biophysical characterization of the recording of unmyelinated and myelinated fiber activity with peripheral interfaces.iScience. 2025 Apr 22;28(5):112495. doi: 10.1016/j.isci.2025.112495. eCollection 2025 May 16. iScience. 2025. PMID: 40458190 Free PMC article.
-
Accelerating neurotechnology development using an Agile methodology.Front Neurosci. 2024 Feb 16;18:1328540. doi: 10.3389/fnins.2024.1328540. eCollection 2024. Front Neurosci. 2024. PMID: 38435056 Free PMC article. Review.
-
Spatially selective stimulation of the pig vagus nerve to modulate target effect versus side effect.J Neural Eng. 2023 Feb 22;20(1):10.1088/1741-2552/acb3fd. doi: 10.1088/1741-2552/acb3fd. J Neural Eng. 2023. PMID: 36649655 Free PMC article.
-
A flexible adhesive surface electrode array capable of cervical electroneurography during a sequential autonomic stress challenge.Sci Rep. 2022 Nov 14;12(1):19467. doi: 10.1038/s41598-022-21817-w. Sci Rep. 2022. PMID: 36376365 Free PMC article.
-
Using neural biomarkers to personalize dosing of vagus nerve stimulation.Bioelectron Med. 2024 Jun 17;10(1):15. doi: 10.1186/s42234-024-00147-4. Bioelectron Med. 2024. PMID: 38880906 Free PMC article.
References
-
- Andreasen LNS and Struijk JJ 2002. Signal strength versus cuff length in nerve cuff electrode recordings IEEE Trans. Biomed. Eng 49 1045–50 - PubMed
-
- Ardell JL, Nier H, Hammer M, Southerland EM, Ardell CL, Beaumont E, KenKnight BH and Armour JA 2017. Defining the neural fulcrum for chronic vagus nerve stimulation: implications for integrated cardiac control: vagus nerve stimulation neural fulcrum for cardiac control J. Physiol 595 6887–903 - PMC - PubMed
-
- Boretius T, Badia J, Pascual-Font A, Schuettler M, Navarro X, Yoshida K and Stieglitz T 2010. A transverse intrafascicular multichannel electrode (TIME) to interface with the peripheral nerve Biosens. Bioelectron 26 62–69 - PubMed
-
- Bovik AC and Acton ST 2005. Handbook of Image and Video Processing 2nd edn (New York: Academic; ) pp 99–108
Publication types
MeSH terms
Grants and funding
LinkOut - more resources
Full Text Sources
Miscellaneous