. 2023 Apr 10;41(4):726-739.e11.
doi: 10.1016/j.ccell.2023.02.010. Epub 2023 Mar 9.

Dual IKZF2 and CK1α degrader targets acute myeloid leukemia cells

Affiliations

Dual IKZF2 and CK1α degrader targets acute myeloid leukemia cells

Sun-Mi Park et al. Cancer Cell. .

Abstract

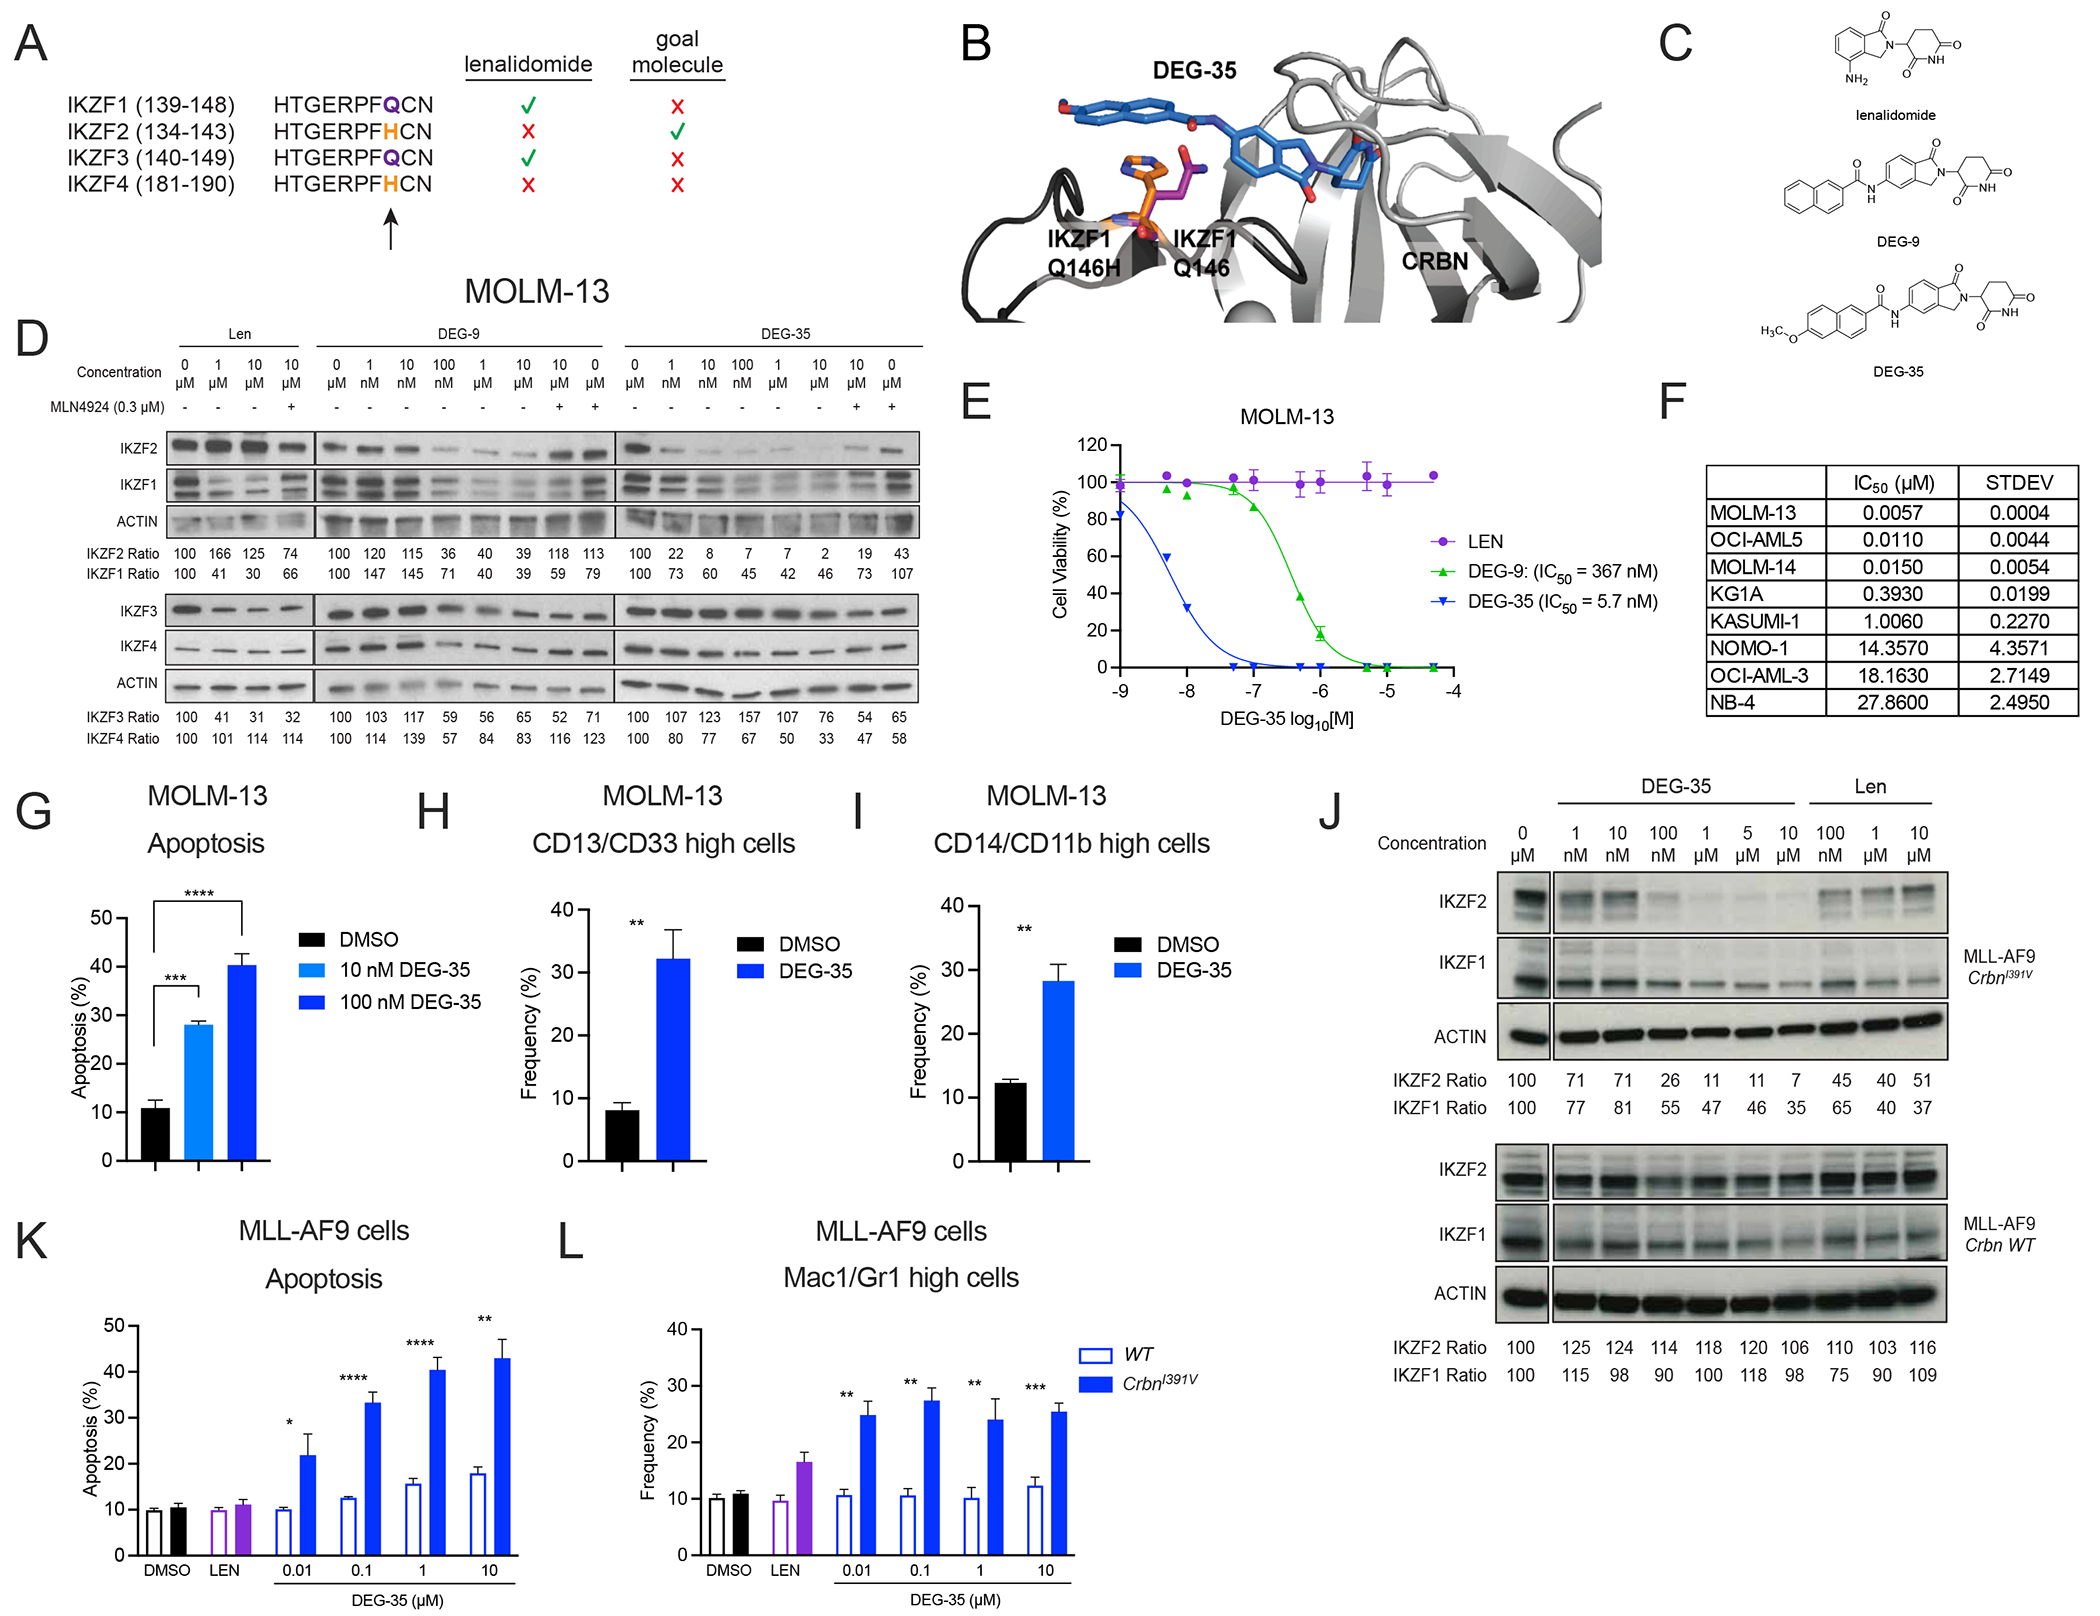
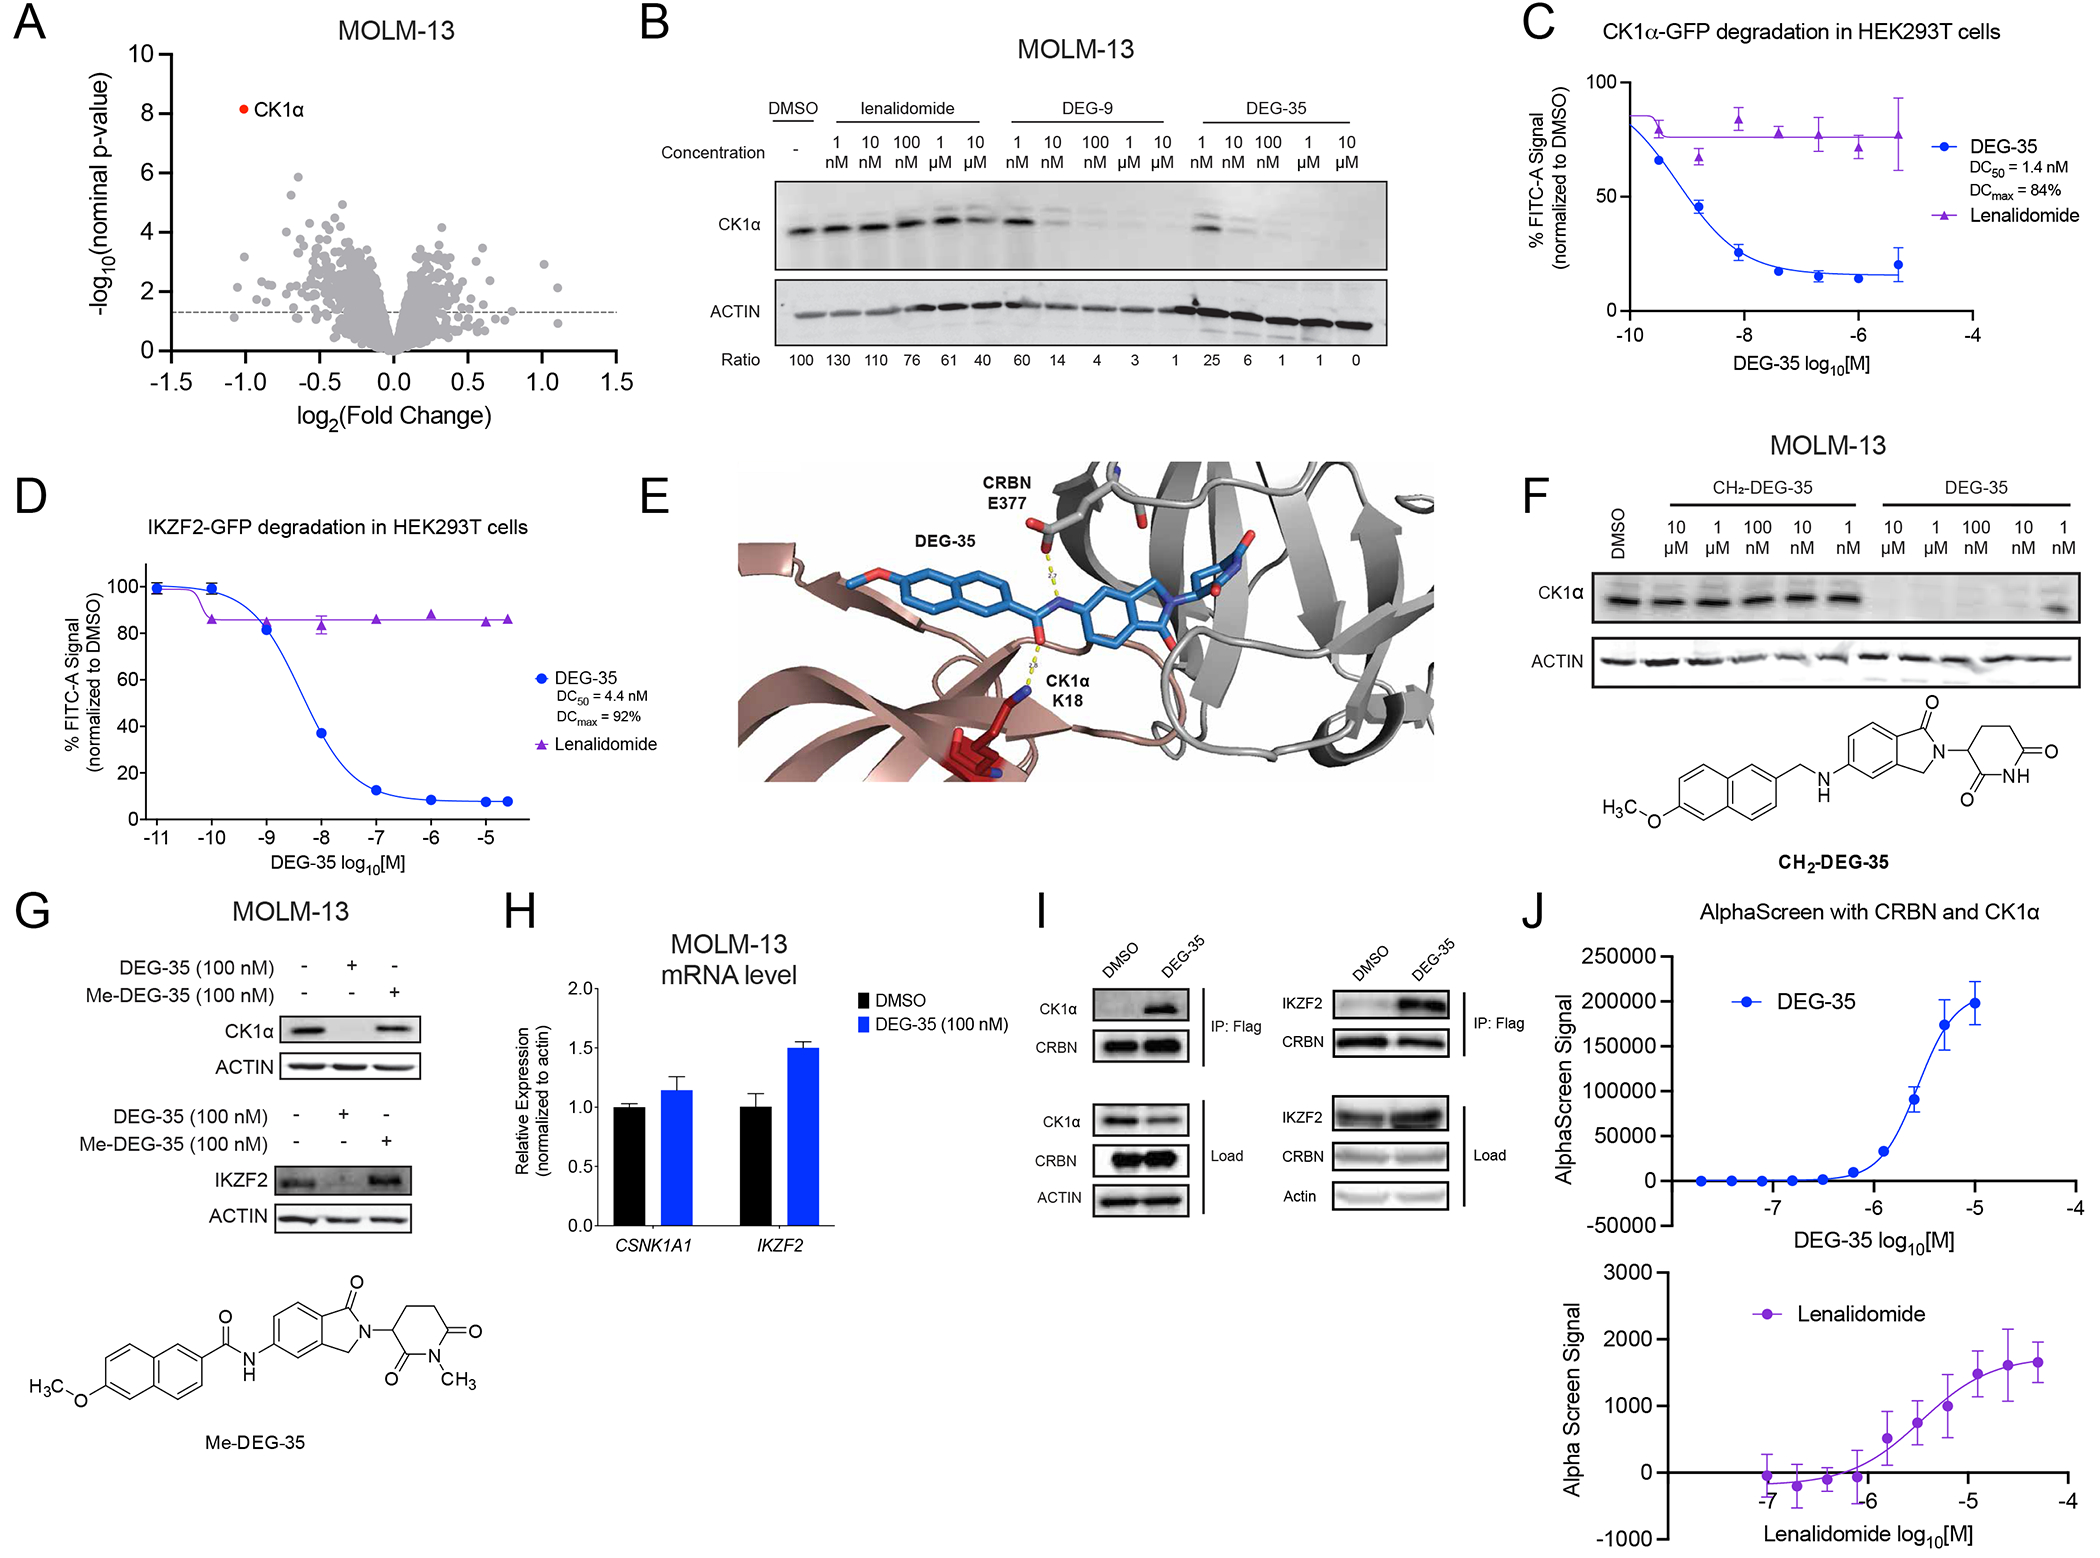
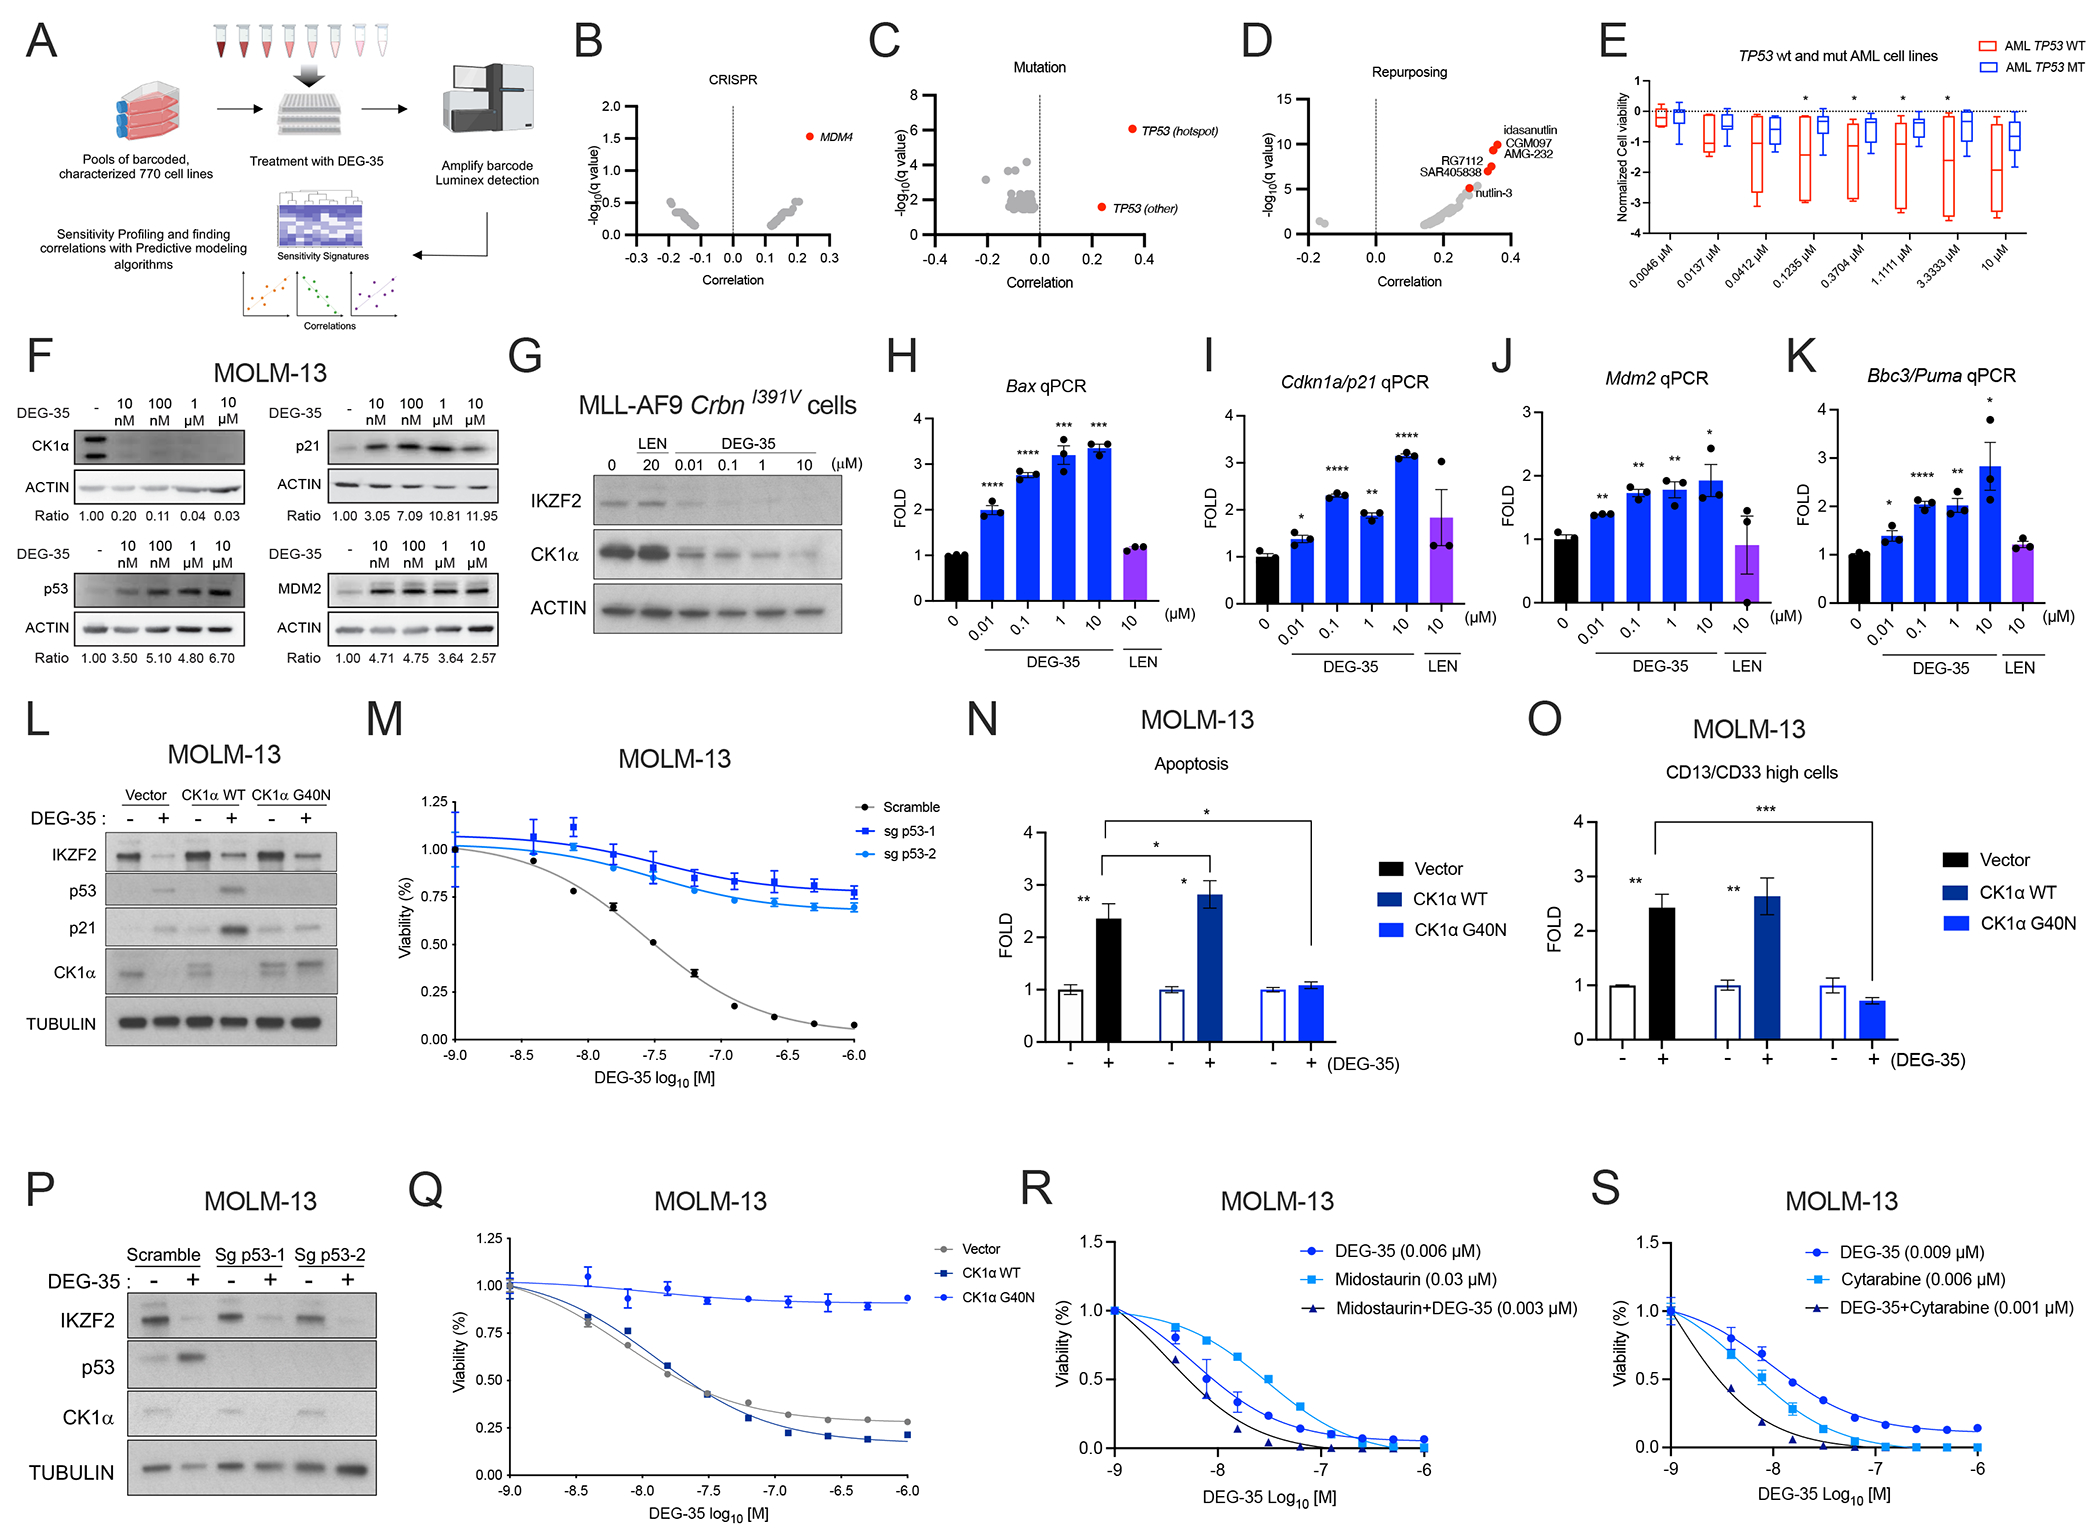
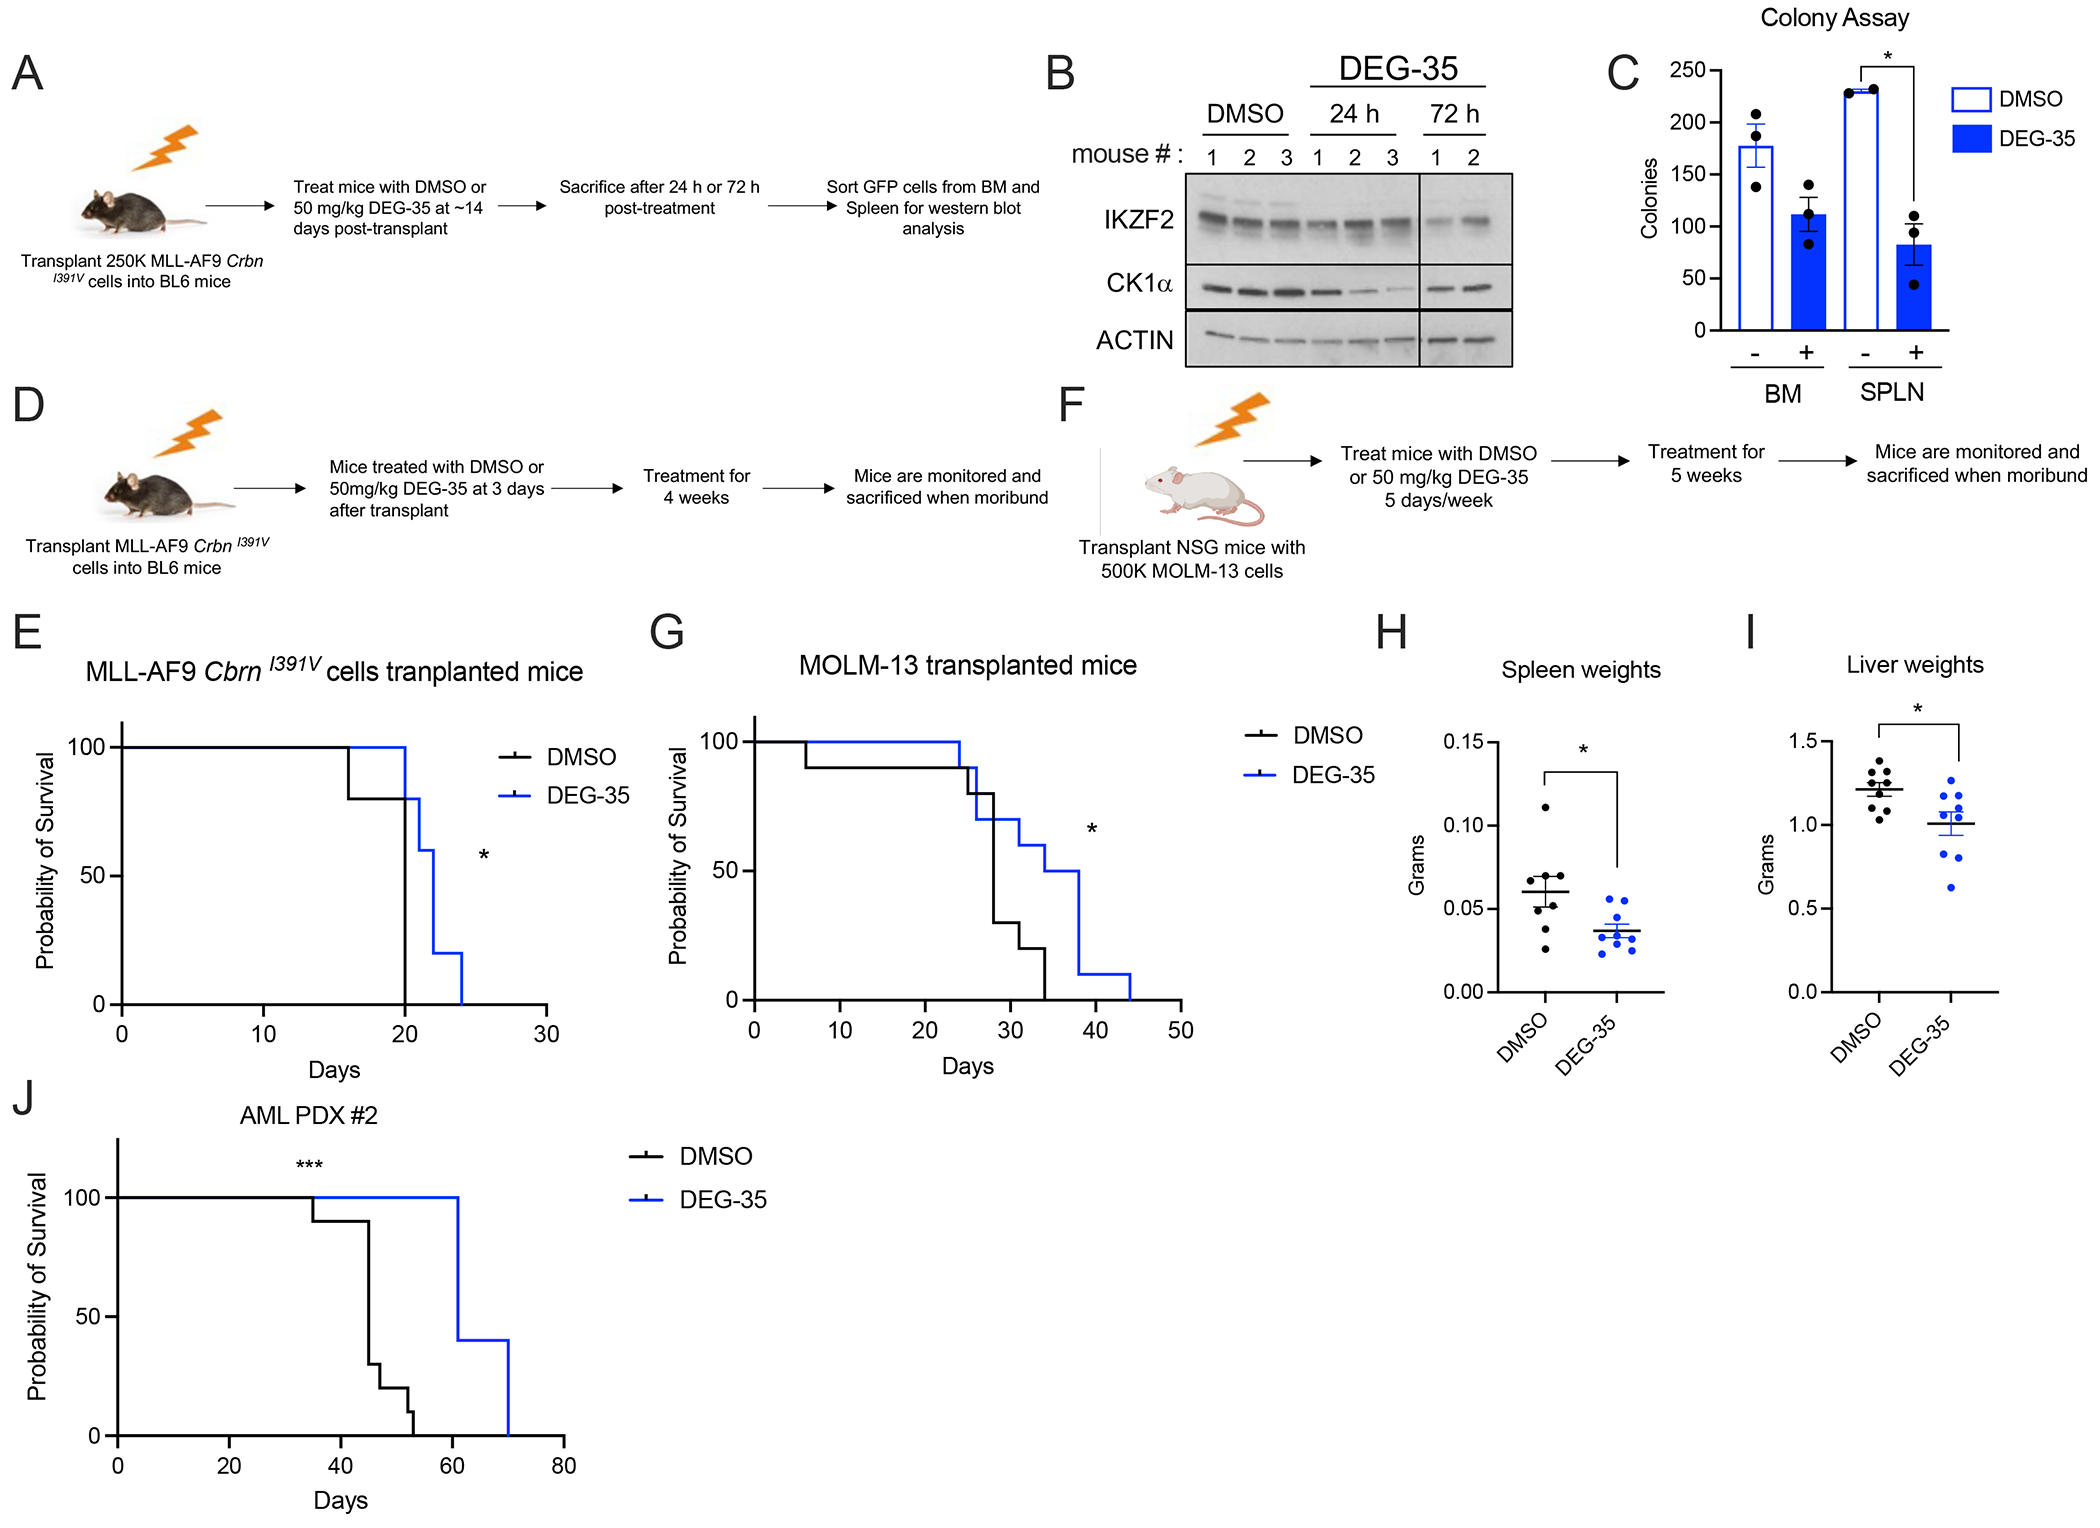
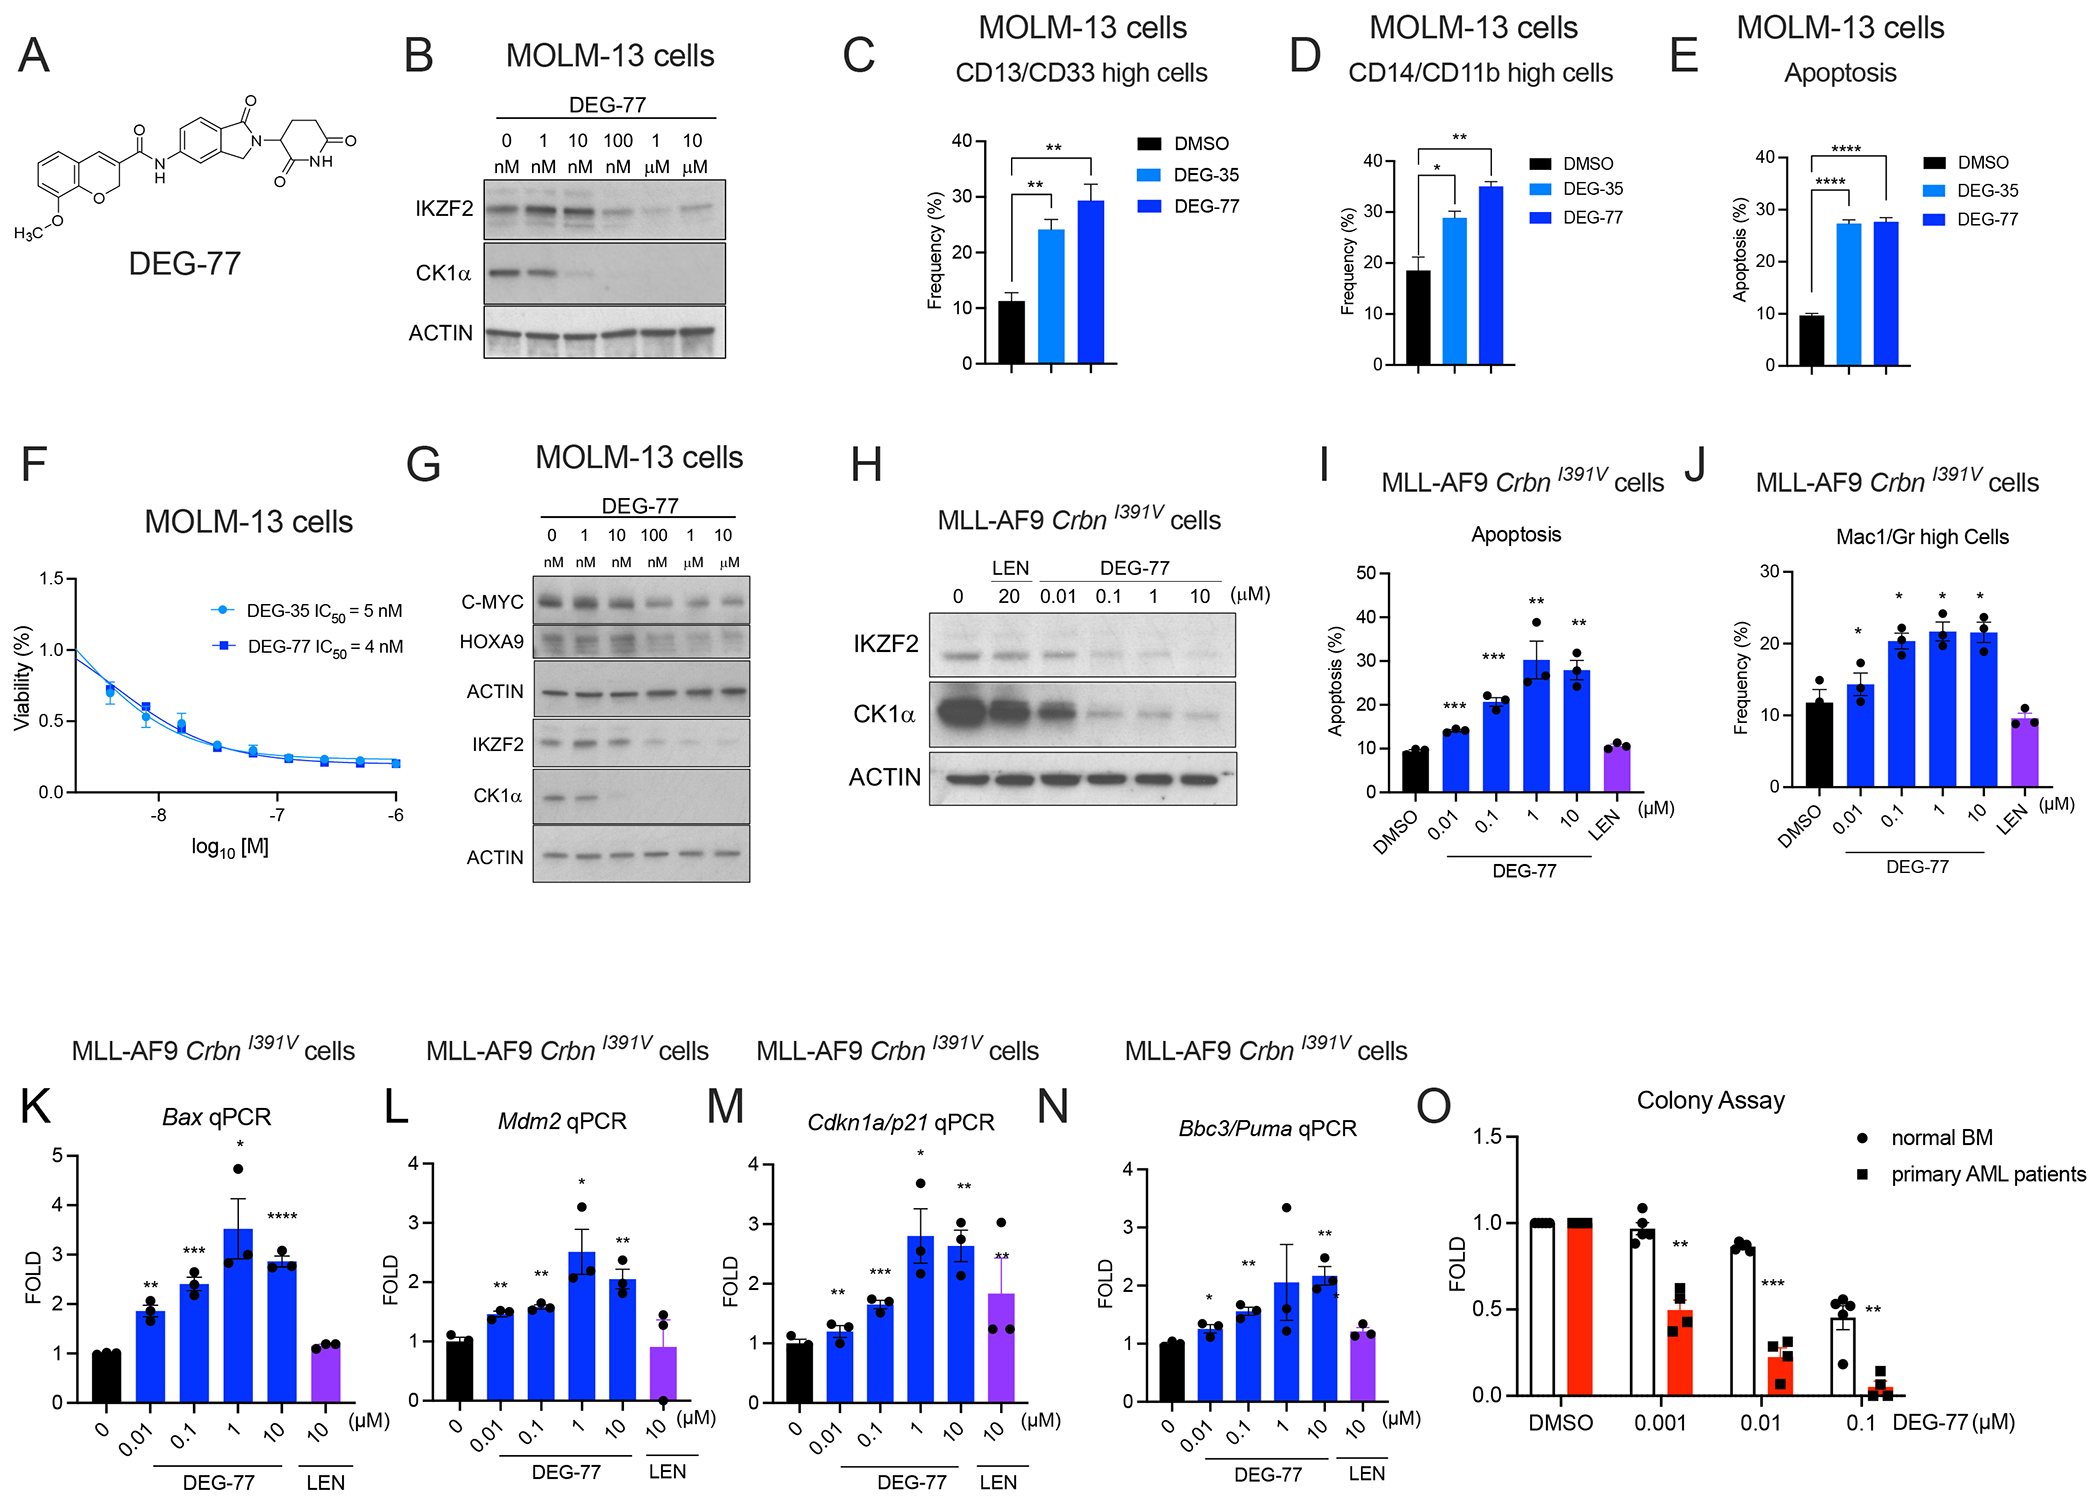
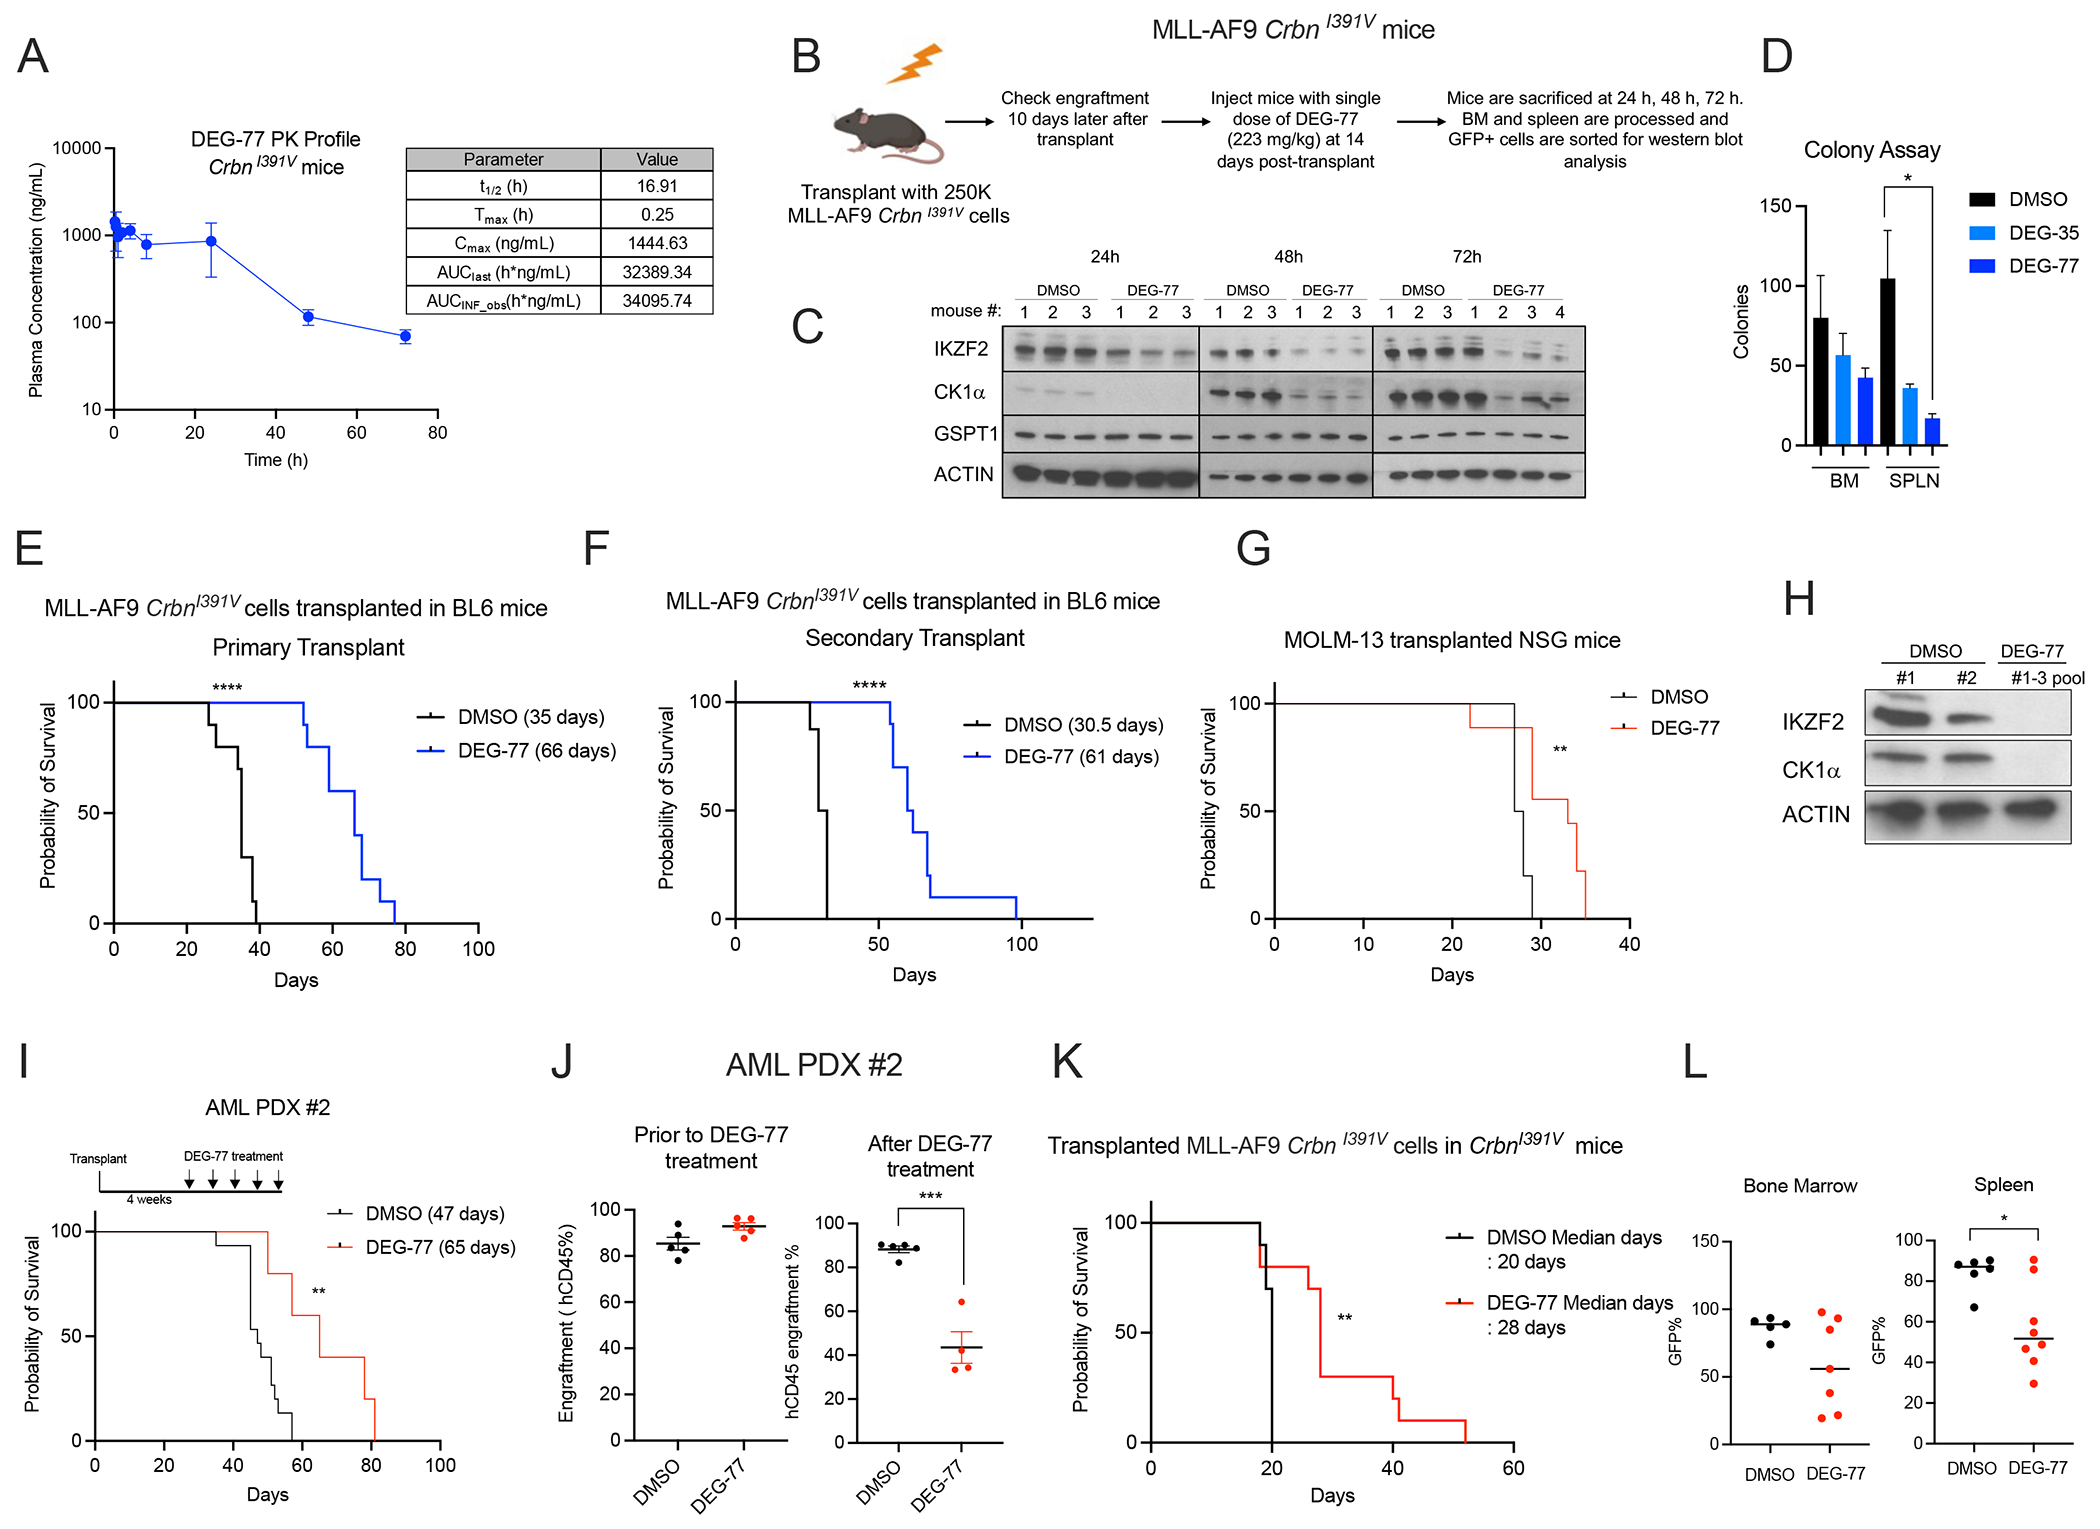
Acute myeloid leukemia (AML) is a hematologic malignancy for which several epigenetic regulators have been identified as therapeutic targets. Here we report the development of cereblon-dependent degraders of IKZF2 and casein kinase 1α (CK1α), termed DEG-35 and DEG-77. We utilized a structure-guided approach to develop DEG-35 as a nanomolar degrader of IKZF2, a hematopoietic-specific transcription factor that contributes to myeloid leukemogenesis. DEG-35 possesses additional substrate specificity for the therapeutically relevant target CK1α, which was identified through unbiased proteomics and a PRISM screen assay. Degradation of IKZF2 and CK1α blocks cell growth and induces myeloid differentiation in AML cells through CK1α-p53- and IKZF2-dependent pathways. Target degradation by DEG-35 or a more soluble analog, DEG-77, delays leukemia progression in murine and human AML mouse models. Overall, we provide a strategy for multitargeted degradation of IKZF2 and CK1α to enhance efficacy against AML that may be expanded to additional targets and indications.

Keywords: IKZF2; acute myeloid leukemia; casein kinase 1 alpha; cereblon; targeted protein degradation.


Conflict of interest statement

Declaration of interests Harvard University filed PCT patent applications on April 29, 2021, and September 14, 2022, covering the chemical structures described in this article and their use. C.M.W., D.K.M., S.-M.P., and M.G.K. are listed as inventors on these patents. The Woo laboratory receives support from Ono Pharmaceuticals and Merck. M.G.K. is on the scientific advisory board of 858 Therapeutics and has received honoraria from Kumquat Biosciences and AstraZeneca.

Figures

Figure 1.
Figure 1.. DEG-35 is a potent degrader of IKZF2 with leukemic cell killing activity.
(A) Schematic diagram showing the sequence of critical amino acids required for binding of the IKAROS family members to IMiDs. (B) Docking model of DEG-35 binding to IKZF2 and CRBN. (C) Chemical structures of lenalidomide, DEG-9, and DEG-35. (D) Western blot analysis of IKAROS family members in MOLM-13 cells treated with the indicated drugs for 24 h with or without MLN4924 1 h pretreatment. (E) Viability assay performed in MOLM-13 cells treated with indicated drugs for 72 h to obtain IC50 values. Data shown is the representative graph of three independent experiments. Mean ± SEM of triplicates. (F) IC50 values of DEG-35 in different AML cell lines treated for 72 h. Mean ± SEM of three independent experiments are shown. (G) Apoptosis was measured by flow cytometry using Annexin V as a marker. (H) CD13/CD33 and (I) CD14/CD11b were stained on MOLM-13 cells and measured by flow cytometry for differentiation at day 2 post-treatment with 100 nM DEG-35. (J) Western blot analysis for indicated proteins in MLL-AF9 CrbnI391V or WT cells treated with DEG-35 or lenalidomide for 24 h. (K,L) (K) Apoptosis and (L) differentiation were measured by flow cytometry of cells stained with Annexin V and myeloid markers, Mac1/Gr1 respectively. Flow cytometry was performed 24 h post-treatment with DEG-35 or 10 μM lenalidomide. Mean ± SEM of three independent experiments for results in (G-I, K and L). Student’s t test, *p < 0.05, **p < 0.01, ***p < 0.001, ****p < 0.0001. See also Figure S1 and Table S1.
Figure 2.
Figure 2.. DEG-35 degrades dual targets IKZF2 and CK1α via Cullin-CRBN dependent pathway.
(A) Quantitative global proteomics analysis of MOLM-13 cells treated for 2 h with 50 nM DEG-35. (B) Western blot analysis of CK1α in MOLM-13 cells treated for 24 h with indicated drugs. (C,D) Flow cytometry analysis of HEK293T cells expressing (C) GFP-CK1α or (D) GFP-IKZF2 zinc finger 2 treated with DEG-35 for 5 h or 24 h respectively. Data shown is the mean ± SEM of three biological replicates and is representative of two independent experiments. (E) Docking model of DEG-35 with CK1α and CRBN. (F) Structure of CH2-DEG-35 and Western blot analysis of CK1α and IKZF2 in MOLM-13 cells treated with DEG-35 or CH2-DEG-35. (G) Structure of Me-DEG-35 and western blot analysis of CK1α and IKZF2 in MOLM-13 cells treated with DEG-35 or Me-DEG-35. (H) qRT-PCR analysis of CK1α and IKZF2 mRNA levels in MOLM-13 cells treated 24 h with 100 nM DEG-35. Data shown is the mean ± SEM of three biological replicates. (I) Western blot analysis of co-immunoprecipitation of endogenous CK1α and transiently expressed IKZF2 with Flag-CRBN in HEK293T. (J) In vitro analysis for lenalidomide or DEG-35 between His-CULT and streptactin-CK1α by AlphaScreen. Data shown is the mean ± SEM of three biological replicates and is representative of two independent experiments. See also Figure S2 and Table S2.
Figure 3.
Figure 3.. DEG-35 leads to activation of the p53 pathway via CK1α degradation.
(A) Scheme showing the layout of the PRISM platform. (B-D) Correlation results showing the sensitivity signature of 770 human cell lines to DEG-35 to (B) genes knocked out by CRISPR screens (C) mutations harbored in cell lines and (D) repurposed drugs from PRISM data. (E) Normalized cell viability of AML cell lines with wildtype and p53 mutation shown as box and whiskers plot presenting maximum and minimum values with median as the midline. Student’s t test was used, *p < 0.05. (F) Western blot analysis of p53 targets p21 and MDM2 in MOLM-13 cells treated with different doses of DEG-35 for 24 h. (G) Western blot analysis of CK1α and IKZF2 in MLL-AF9 CrbnI391V cells treated with different doses of DEG-35 for 24 h. (H-K) qPCR analysis of p53 targets (H) Bax, (I) Cdkn1a/p21, (J) Mdm2 and (K) Bbc3/Puma in MLL-AF9 CrbnI391V cells treated with different doses of DEG-35 for 24 h. (L) Western blot analysis of CK1α, IKZF2, p53, and p21 in MOLM-13 cells overexpressing CK1α WT, CK1α G40N, or vector control. (M) MOLM-13 cells overexpressing CK1α WT, CK1α G40N, or vector control were treated with DEG-35. 3 days post treatment cell viability was measured by Cell titer Glo assay. Data shown is a representative result of three independent experiments. Mean ± SEM of triplicates. (N,O) (N) Apoptosis and (O) differentiation were examined in MOLM-13 cells treated with DEG-35 for 2 days. (P) Western blot analysis showing protein levels of IKZF2, p53, and CK1α in MOLM-13 cas9 cells expressing sgRNA for TP53 and treated with DMSO or DEG-35. (Q) Cell viability was measured in MOLM-13 cells knocked out for p53 which were treated with DEG-35 for 3 days. Data shown is a representative result of three independent experiments. Mean ± SEM of triplicates. (R,S) Combination treatment of DEG-35 with (R) Midostaurin or (S) Cytarabine in MOLM-13 cells for 72 h, measured by Cell-titer glo assay. Representative data is shown from 3 independent experiments mean ± SEM of triplicates for (Q–S). Statistics for (H–K, N–O) are mean ± SEM of three independent experiments: Student’s t test, *p < 0.05, **p < 0.01, ***p < 0.001 and ****p < 0.0001. See also Figure S3 and Table S3 and S4.
Figure 4.
Figure 4.. DEG-35 treated cells exhibit IKZF2 knockout leukemia signature and can be rescued by IKZF2 mutants.
(A) Heatmap of differentially expressed genes from RNA-seq result obtained from MOLM-13 cells treated with DMSO or DEG-35 at 50 nM for 24 h. Heatmap shows 637 up and 615 down regulated genes in DEG-35 treated cells compared to DMSO control, with log 2-fold change >1 with p adjusted <0.05. P53 targets are marked in black and genes overlapping with MLL-AF9 Ikzf2 knockout LSCs are marked in red. (B-D) GSEA analysis showing enrichment of upregulated and downregulated genes in MOLM-13 cells treated with DEG-35 with signatures of (B) genes altered in IKZF2 knockout leukemic stem cells, (C) myeloid differentiation, (D) genes regulated by HOXA9-MEIS1 and MYC. (E) Western blot analysis showing reduction of HOXA9 and MYC by DEG-35 treatment at 24 h post-treatment in MOLM-13 cells. (F) Western blot analysis showing MOLM-13 cells expressing WT or mutant IKZF2 treated with DEG-35 for 24h. (G-H) Differentiation myeloid markers (G) CD33/CD13 and (H) CD14/CD11b were measured in MOLM-13 cells expressing WT or mutant human IKZF2 treated with DEG-35 for 2 days. MOLM-13 cells were transduced with vectors expressing IKZF2 with IRES GFP. For measuring differentiation, cells were gated on GFP+ cells before gating on myeloid markers. For results in (G, H), mean ± SEM of three independent experiments; Student’s t test, *p < 0.05, **p < 0.01, ***p < 0.001, ****p < 0.0001. See also Figure S4 and Tables S4-S6.
Figure 5.
Figure 5.. DEG-35 has preferential cytotoxic activity in AML cells compared to normal cells.
(A) Normalized colony assay of wt LSK cells, CrbnI391V LSK cells, MLL-AF9 wt cells and MLL-AF9 CrbnI391V cells treated with different concentrations of DEG-35 plated in M3434 methylcellulose for 5 days. Cells from n=3 mice for wt LSK cells, CrbnI391V LSK cells, MLL-AF9 CrbnI391V and n=2 mice for MLL-AF9 wt cells. Data shown is the mean ± SEM of the different biological replicates tested from two different experiments. (B) Viability assay of wt LSK, CrbnI391V LSK, MLL-AF9 wt and MLL-AF9 CrbnI391V cells treated with DEG-35 for 3 days. Data shown is the mean ± SEM of three different biological replicates tested. (C) Normalized colony assay of eight primary AML patient cells and four normal bone marrow or CD34+ HSPC cord blood cells treated with DEG-35 plated in H443 methylcellulose for 7 days. The mean ± SEM of indicated samples tested from more than three different experiments is shown. (D) Viability assay of AML PDX cells and normal BM cells treated with DEG-35 for 2 days. Data shown is the combined result of two experiments using normal BM (n=2) and PDX cells (n=2). Mean ± SEM of triplicates. (E) Western blot analysis of AML PDX sample 1 treated with different concentration of DEG-35 for 24h. For results in (A, C), Student’s t test, *p < 0.05, **p < 0.01, ***p < 0.001. See also Figure S5.
Figure 6.
Figure 6.. DEG-35 can degrade targets in AML cells in vivo and delay leukemia progression.
(A) Scheme strategy for analyzing target pharmacodynamics of DEG-35 in the MLL-AF9 CrbnI391V mice model. (B) Western blot analysis of targets IKZF2 and CK1α of leukemic bone marrow cells from mice treated with DEG-35 at 50 mg/kg, 24 h and 72 h post-treatment. (C) Colony assay of leukemic cells from bone marrow and spleen from mice treated with DMSO or DEG-35 24 h post treatment. Data shown is the mean ± SEM of three different biological replicates tested. Student’s t test was used, *p < 0.05. (D) Scheme showing treatment strategy for DMSO or DEG-35 in BL6 mice transplanted with MLL-AF9 CrbnI391V cells. (E) Kaplan-Meier survival curve for MLL-AF9 CrbnI391V transplanted BL6 mice treated with DMSO or 50 mg/kg DEG-35. n=5 mice for each group. (F) Scheme showing treatment strategy for DMSO or DEG-35 in MOLM-13 cells transplanted in NSG mice. (G) Survival curve for MOLM-13 transplanted mice treated with DMSO or 50 mg/kg DEG-35. n=10 mice for each group. (H,I) (H) Spleen weight and (I) liver weights of mice from (G). Data shown is the means +/− SEM of the indicated samples tested. (J) Survival curve of NSG mice transplanted with PDX AML#2 and treated with DMSO (n=10) or DEG-35 (n=5). For statistics in (E, G, and J), log rank test was used *p < 0.05, ***p < 0.001 and for results in (H and I) Student’s t test was used, *p < 0.05. See also Figure S6.
Figure 7.
Figure 7.. DEG-77, an analog of DEG-35 has similar potency in killing AML cells.
(A) Chemical structure of DEG-77. (B) Western blot analysis of IKZF2 and CK1α in MOLM-13 cells treated with indicated concentrations of DEG-77 for 24 h. (C,D) MOLM-13 cells were stained with myeloid markers (C) CD13/CD33 and (D) CD14/CD11b and then measured by flow cytometry for differentiation at day 2 post-treatment with 100 nM DEG-35 or DEG-77. (E) Apoptosis was measured by flow cytometry using Annexin V and DAPI as apoptotic marker. (F) Cell viability assay was performed in MOLM-13 cells treated with DEG-35 and DEG-77 for 3 days to obtain IC50 values. Data shown is the representative result of three independent experiments. Mean ± SEM of triplicates. (G) Western blot analysis showing reduction of HOXA9 and MYC by DEG-77 treatment at 24 h post-treatment in MOLM-13 cells. (H) Western blot analysis showing degradation of CK1α and IKZF2 in MLL-AF9 CrbnI391V by different concentration of DEG-77 after 24 h. (I,J) (I) Apoptosis and (J) differentiation were measured by flow cytometry of cells stained with Annexin V and myeloid markers Mac1/Gr1 respectively. Flow cytometry was performed 24 h post-treatment with indicated concentrations of DEG-35 or 10 μM lenalidomide. (K-N) mRNA levels of p53 targets, (K) Bax, (L) Mdm2, (M) Cdkn1a/p21, (N) Bbc3/Puma measured by qPCR analysis in MLL-AF9 CrbnI391V cells treated with DEG-77 and lenalidomide for 24 h. (O) Normalized colony assay of four primary AML patient cells and five normal bone marrow/CD34+ HSPC cord blood cells treated with DEG-35 plated in H443 methylcellulose for 14 days. For statistics used in (C–E, I–J, K–N, O), results shown were combined from at least three independent experiments, Mean ± SEM. Student’s t test, *p < 0.05, **p < 0.01, ***p < 0.001, ****p < 0.0001. See also Figure S7.
Figure 8.
Figure 8.. DEG-77, an analog of DEG-35 has better efficacy and can block leukemic stem cell activity.
(A) Pharmacokinetic study showing plasma concentration of DEG-77 over a 72 h period in mice after a single intraperitoneal injection of DEG-35 at 223 mg/kg. The plasma concentrations represent the means +/− SEM from three mice per time point. (B) Scheme showing strategy for analyzing pharmacodynamics of targets of DEG-77 in the MLL-AF9 CrbnI391V mice model. (C) Western blot analysis of targets IKZF2, CK1α and GSPT1 of leukemic bone marrow cells from mice treated with DEG-77 at 223 mg/kg, at indicated time point. (D) Colony assay of leukemic cells from bone marrow and spleen of mice treated with DMSO or DEG-77 24 h post treatment. Data shown is the means +/− SEM of n=3 samples for each condition. Student’s t test, *p < 0.05. (E, F) Survival curves of BL/6 mice transplanted with (E) MLL-AF9 CrbnI391V cells treated with DMSO or DEG-77 at dose of 223mg/kg weekly or (F) secondarily transplanted. ****p < 0.0001 log-rank test. n=10 mice for each group. (G) Survival curve of NSG mice transplanted with MOLM-13 cells and treated with DMSO (n=10) or DEG-77 (n=9) treated at 223mg/kg weekly. **p < 0.01 log-rank test. (H) Western blot analysis of MOLM-13 cells sorted from bone marrow of NSG mice 24h after drug treatment. (I) Survival curve of NSG mice transplanted with AML PDX#2 treated with DMSO (n=15) or DEG-77 (n=5) at dose of 223mg/kg, weekly from 4 weeks post-transplant. **p < 0.01 log-rank test. (J) Engraftment frequency of AML PDX cells measured by flow cytometry by hCD45 using bone marrow aspirates at 4 weeks post-transplant (left panel) before and (right panel) one week after a single dose of DEG-77 treatment. Data shown is means +/− SEM of the indicated samples as shown. Student’s t test, ***p < 0.001. (K) Survival curve of non-irradiated CrbnI391V mice transplanted with MLL-AF9 CrbnI391V cells treated with DMSO or DEG-77 at dose of 223 mg/kg weekly. **p < 0.01 log-rank test. n=10 mice for each group. (L) Disease burden shown by frequency of GFP positive cells (MLL-AF9 CrbnI391V cells) in bone marrow or spleen at time of sacrifice. Data shown is means +/− SEM of the indicated samples as shown. Student’s t test, *p < 0.05. See also Figure S8.

References

    1. Estey E, and Dohner H (2006). Acute myeloid leukaemia. Lancet 368, 1894–1907. 10.1016/S0140-6736(06)69780-8. - DOI - PubMed
    1. Suva ML, Riggi N, and Bernstein BE (2013). Epigenetic reprogramming in cancer. Science 339, 1567–1570. 10.1126/science.1230184. - DOI - PMC - PubMed
    1. Dohner H, Wei AH, and Lowenberg B (2021). Towards precision medicine for AML. Nat Rev Clin Oncol 18, 577–590. 10.1038/s41571-021-00509-w. - DOI - PubMed
    1. Pirozzi CJ, and Yan H (2021). The implications of IDH mutations for cancer development and therapy. Nat Rev Clin Oncol 18, 645–661. 10.1038/s41571-021-00521-0. - DOI - PubMed
    1. Park SM, Cho H, Thornton AM, Barlowe TS, Chou T, Chhangawala S, Fairchild L, Taggart J, Chow A, Schurer A, et al. (2019). IKZF2 Drives Leukemia Stem Cell Self-Renewal and Inhibits Myeloid Differentiation. Cell stem cell 24, 153–165 e157. 10.1016/j.stem.2018.10.016. - DOI - PMC - PubMed

Publication types

LinkOut - more resources