. 2023 Mar 11;14(1):1332.
doi: 10.1038/s41467-023-36986-z.

Indoor air surveillance and factors associated with respiratory pathogen detection in community settings in Belgium

Affiliations

Indoor air surveillance and factors associated with respiratory pathogen detection in community settings in Belgium

Joren Raymenants et al. Nat Commun. .

Abstract

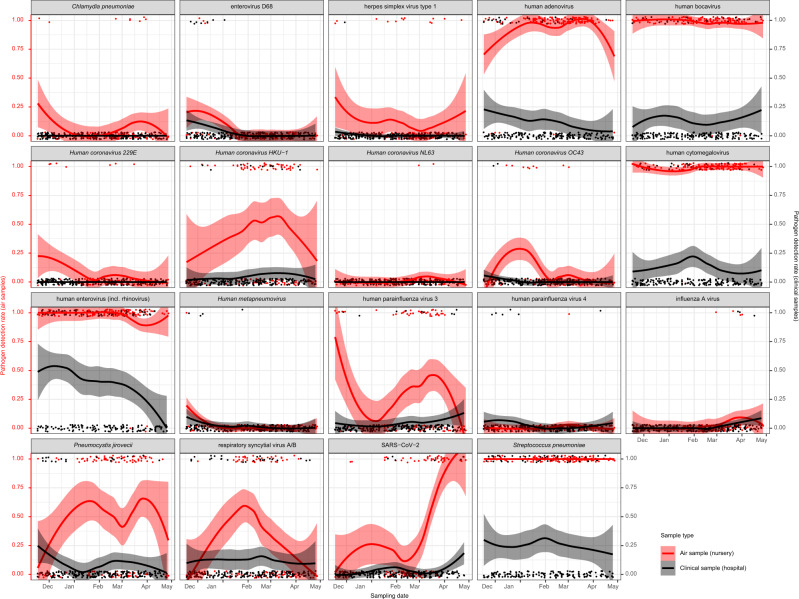
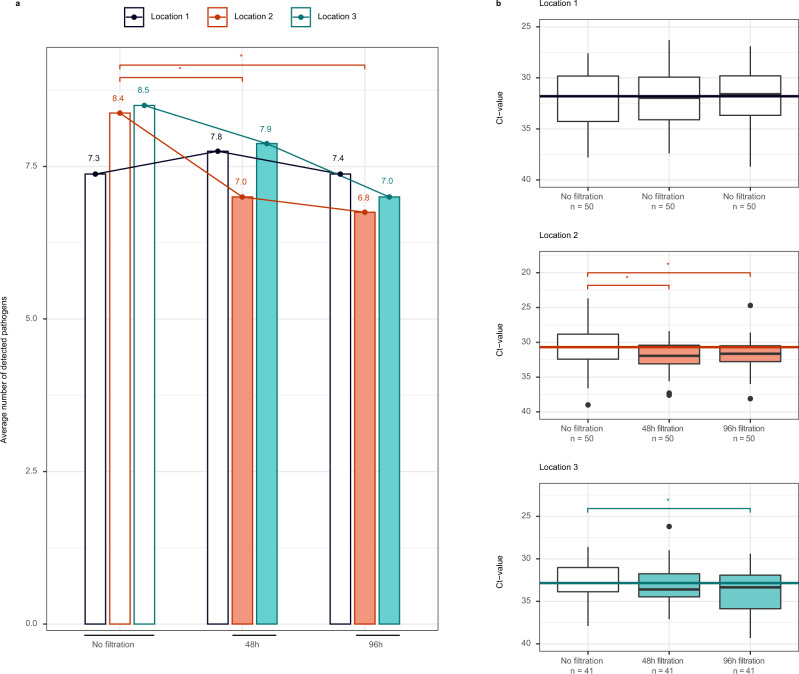
Currently, the real-life impact of indoor climate, human behaviour, ventilation and air filtration on respiratory pathogen detection and concentration are poorly understood. This hinders the interpretability of bioaerosol quantification in indoor air to surveil respiratory pathogens and transmission risk. We tested 341 indoor air samples from 21 community settings in Belgium for 29 respiratory pathogens using qPCR. On average, 3.9 pathogens were positive per sample and 85.3% of samples tested positive for at least one. Pathogen detection and concentration varied significantly by pathogen, month, and age group in generalised linear (mixed) models and generalised estimating equations. High CO2 and low natural ventilation were independent risk factors for detection. The odds ratio for detection was 1.09 (95% CI 1.03-1.15) per 100 parts per million (ppm) increase in CO2, and 0.88 (95% CI 0.80-0.97) per stepwise increase in natural ventilation (on a Likert scale). CO2 concentration and portable air filtration were independently associated with pathogen concentration. Each 100ppm increase in CO2 was associated with a qPCR Ct value decrease of 0.08 (95% CI -0.12 to -0.04), and portable air filtration with a 0.58 (95% CI 0.25-0.91) increase. The effects of occupancy, sampling duration, mask wearing, vocalisation, temperature, humidity and mechanical ventilation were not significant. Our results support the importance of ventilation and air filtration to reduce transmission.


Conflict of interest statement

The authors declare no competing interests.

Figures

Fig. 1
Fig. 1. Positivity rates of respiratory pathogens in ambient air in nursery locations (red) compared to clinical samples from a local hospital (black/grey).
Each panel represents qPCR test results of one of the 29 targeted pathogens, plotted by sampling date. Each pathogen which was positive in at least one air sample is shown. For SARS-CoV-2, the TaqPath results are shown. The individual red datapoints represent the positive and negative ambient air samples taken in a nursery (0 = negative, 1 = positive). This was the most stable age group regarding sampling frequency, occupancy and the continued presence of the same group of individuals (Supplementary Fig. 1). Red lines and shaded areas show a corresponding LOcally weEighted Scatterplot Smoothing (LOESS) regression of the positivity rate for each pathogen with 95% confidence intervals. We included 121 air samples. For comparison, we retrieved the 206 results of the same 29 pathogen multiplex qPCR respiratory panel, performed in 0–3 year old children with respiratory infections at University Hospitals Leuven between October 2021 and May 2022. This hospital is adjacent to the nursery. Individual black datapoints represent the respiratory samples (0 = negative, 1 = positive). Black lines and shaded areas show a corresponding LOESS regression of the positivity rate for each pathogen with 95% confidence intervals. An association between results from both sample types can be observed for SARS-CoV-2 (N positive air samples = 46) and, with much less positive samples, for enterovirus D68 and influenza A virus (N positive air samples = 4 for each). Supplementary Fig. 2 shows the corresponding results for all sites.
Fig. 2
Fig. 2. The influence of portable air filtration on respiratory pathogen detection and concentration in ambient air.
For 8 consecutive weeks, samples were taken in three nursery locations on Mondays (n = 8), Wednesdays (n = 8), and Fridays (n = 8). Location 1 = control group (no air filtration); Location 2 = air filtration at 10.7 air changes per hour (ACH) starting Mondays (after sampling) and ending Fridays (after sampling); Location 3 = air filtration at 6.1 ACH starting Mondays (after sampling) and ending Fridays (after sampling). No one was present over the weekends. Panel (a) shows the mean number of pathogens detected in each of the nursery locations in the absence of filtration (not shaded), after 48 h of filtration (Locations 2 and 3, shaded) and after 96 h of filtration (Locations 2 and 3, shaded). * indicates a significant difference. We used a Cochran’s Q to compare the three filtration phases in each location separately, followed by pairwise Cochran’s Q tests when a significant difference (two-sided P-value < 0.05) was found, with Holm correction for multiple testing. In location 1, there was no significant difference between Mondays, Wednesdays, and Fridays (p = 0.6762). In location 2, a significant difference was present across days (0.0006), between Mondays and Wednesdays (pairwise comparison: p = 0.0229), and between Mondays and Fridays (pairwise comparison: p = 0.0009), but not between Wednesdays and Fridays (pairwise comparison: p = 1). In location 3, the difference between days did not reach significance, but there was a trend (p = 0.0701). Panel (b) shows the evolution of Ct values of n positive pathogens (throughout the 8 weeks) in each of the nursery locations in the absence of filtration (not shaded), after 48 h of filtration (shaded) and after 96 h of filtration (shaded). Ct values for a particular pathogen were included only if the pathogen was detected in samples from all three filtration phases during the same week in one location. The horizontal line corresponds to the mean Ct value on Mondays. The central boxplot line corresponds to the median, and the lower and upper boxplot bounds to the 25th and 75th percentiles. The upper/lower whisker extend from the upper/lower boxplot bound to the largest/lowest value no further than 1.5 * IQR. Data beyond the whiskers are outliers, plotted individually. * indicates a significant difference in a linear mixed effects regression model, including week and pathogen as random effects. 95% CI were calculated using the confint command in R, and p-values with the Kenward–Roger approximation of the t-distribution. Ct values did not differ significantly in location 1 (p = 0.9506 between Mondays and Wednesdays; 0.7101 between Mondays and Fridays). In location 2, they were significantly different between Mondays and Wednesdays (p < 0.0001), and Mondays and Fridays (p = 0.0002). In location 3, they were not significantly different between Mondays and Wednesdays (p = 0.3146), but were between Mondays and Fridays (p = 0.0026).

References

    1. Ehrenkranz NJ, Kicklighter JL. Tuberculosis outbreak in a general hospital: evidence for airborne spread of infection. Ann. Intern. Med. 1972;77:377–382. doi: 10.7326/0003-4819-77-3-377. - DOI - PubMed
    1. Kim SH, et al. Extensive viable Middle East Respiratory Syndrome (MERS) coronavirus contamination in air and surrounding environment in mers isolation wards. Clin. Infect. Dis. 2016;63:363–369. doi: 10.1093/cid/ciw239. - DOI - PMC - PubMed
    1. Wang CC, et al. Airborne transmission of respiratory viruses. Science. 2021;373:eabd9149. doi: 10.1126/science.abd9149. - DOI - PMC - PubMed
    1. Hoge CW, et al. An epidemic of pneumococcal disease in an overcrowded, inadequately ventilated jail. N. Engl. J. Med. 1994;331:643–648. doi: 10.1056/NEJM199409083311004. - DOI - PubMed
    1. Yu ITS, et al. Evidence of airborne transmission of the severe acute respiratory syndrome virus. N. Engl. J. Med. 2004;350:1731–1739. doi: 10.1056/NEJMoa032867. - DOI - PubMed

Publication types