. 2023 Mar 10;14(1):1217.
doi: 10.1038/s41467-023-36682-y.

Biomechanics and neural circuits for vestibular-induced fine postural control in larval zebrafish

Affiliations

Biomechanics and neural circuits for vestibular-induced fine postural control in larval zebrafish

Takumi Sugioka et al. Nat Commun. .

Abstract

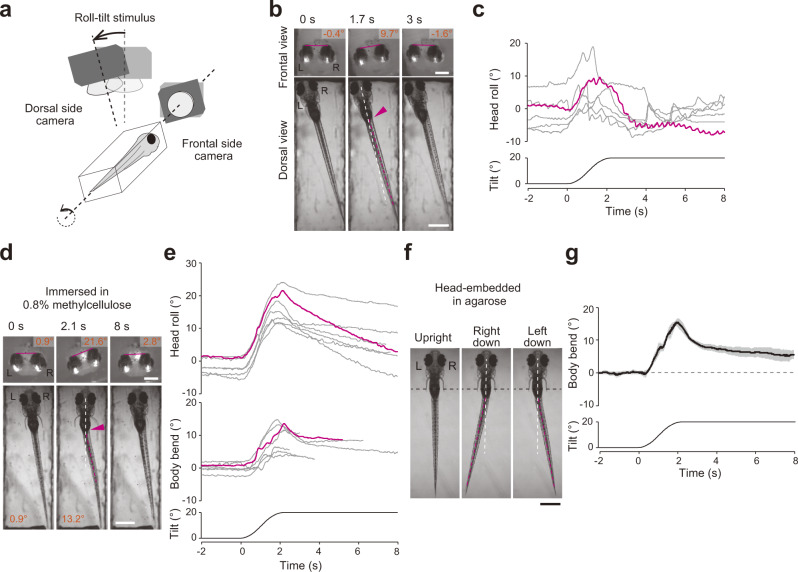
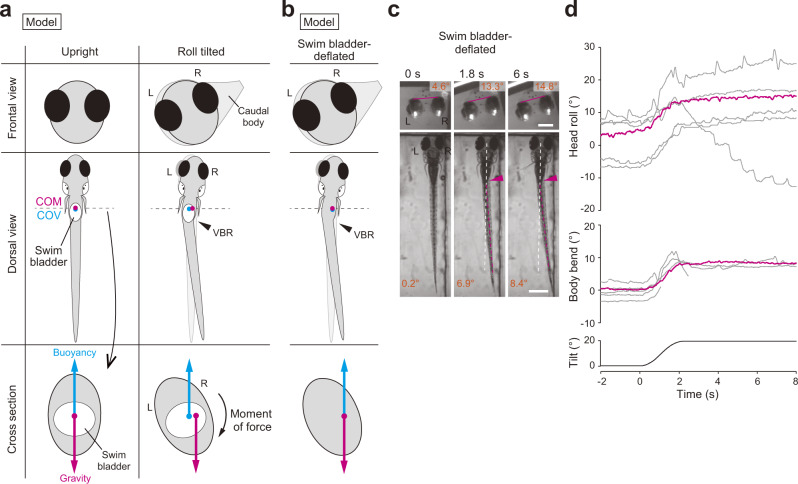
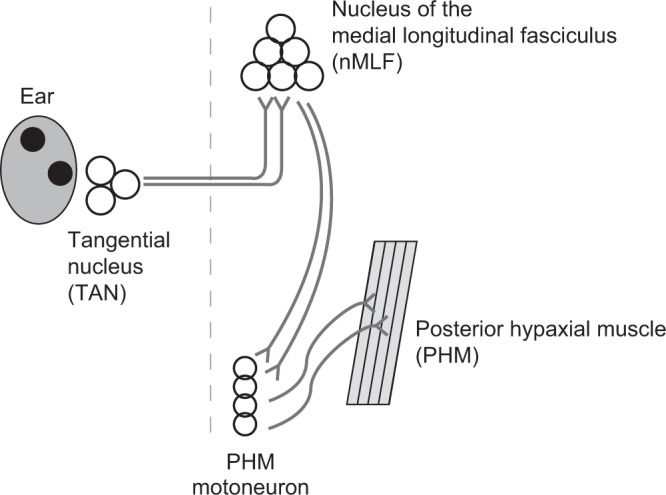
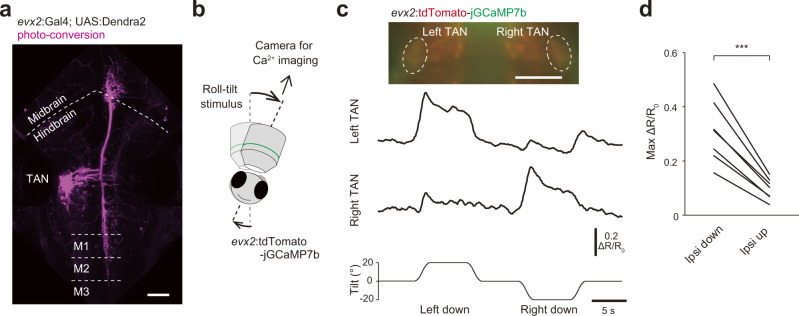
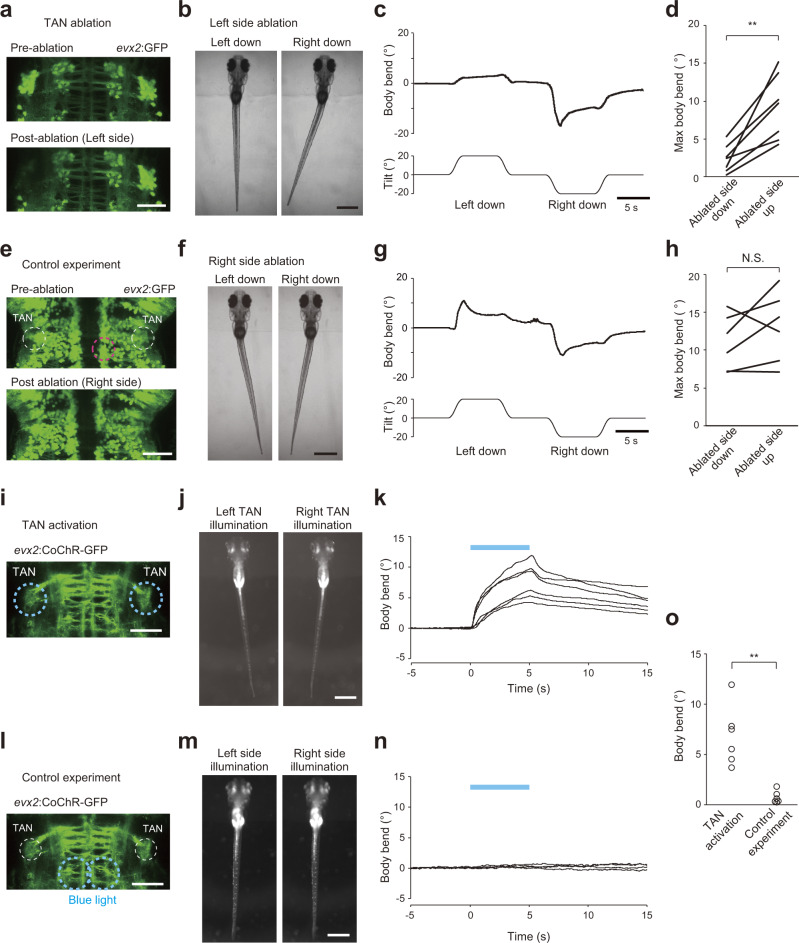
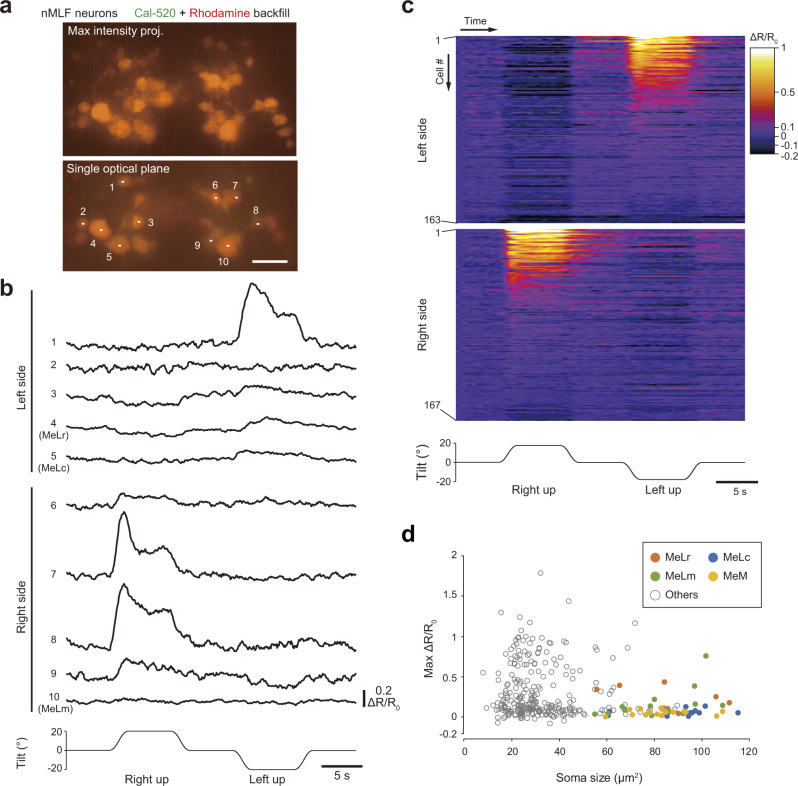
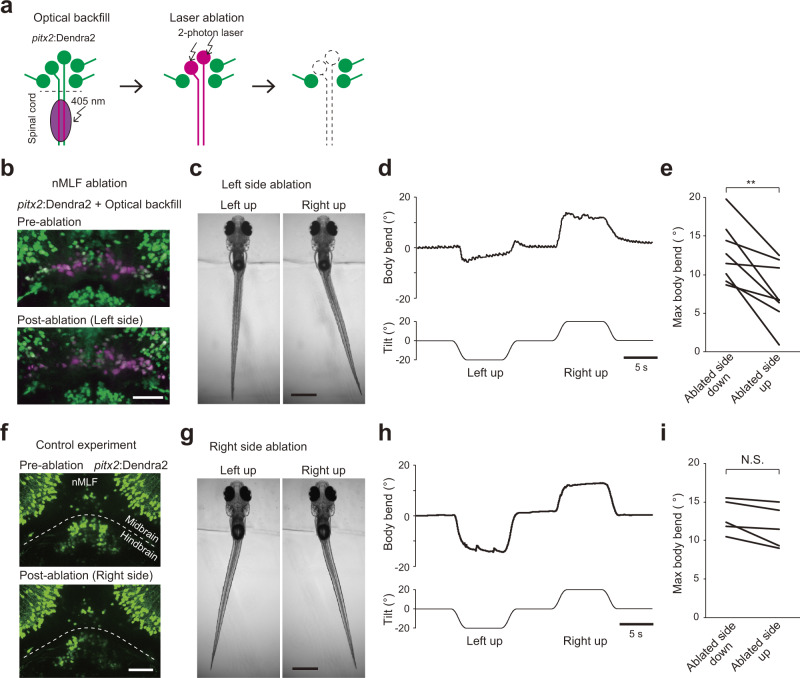
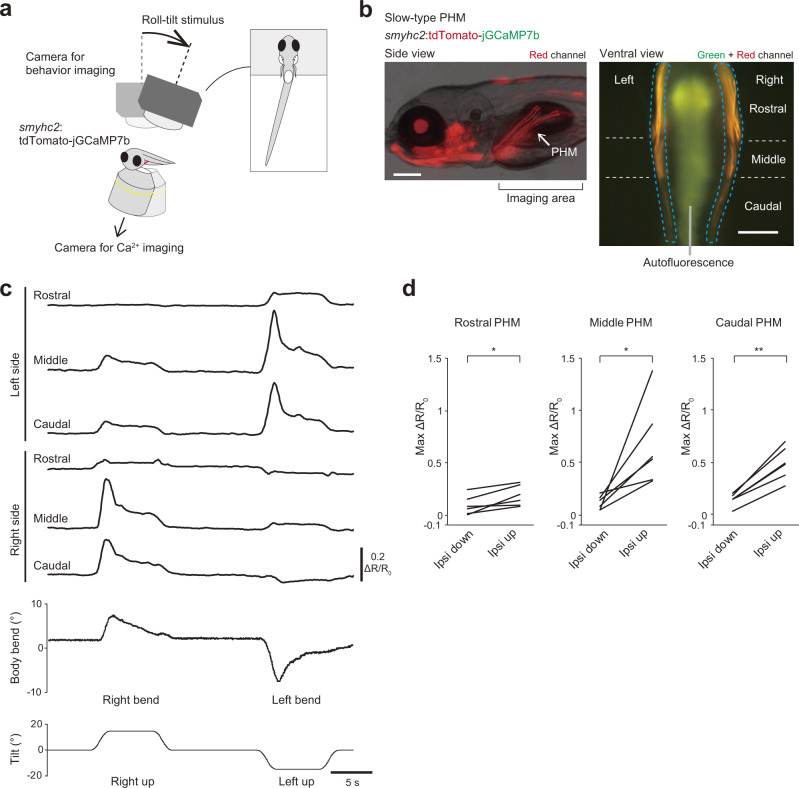
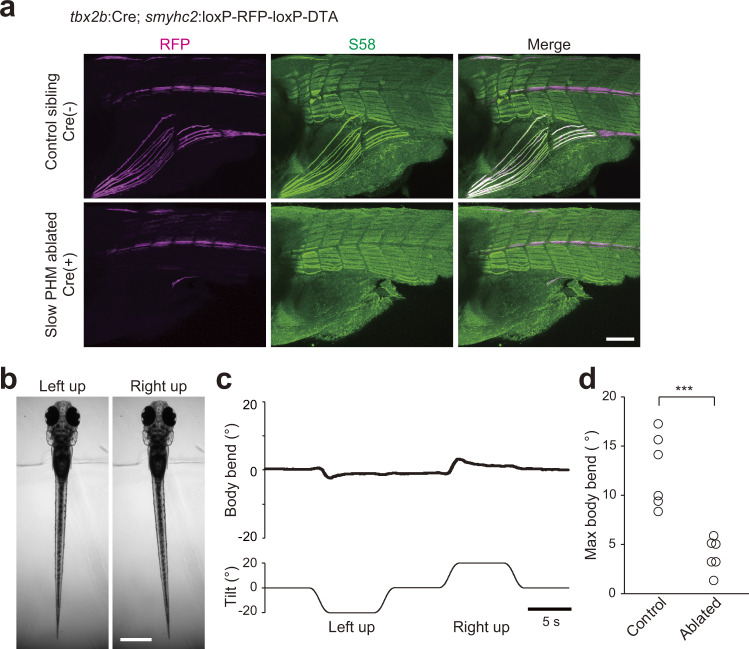
Land-walking vertebrates maintain a desirable posture by finely controlling muscles. It is unclear whether fish also finely control posture in the water. Here, we showed that larval zebrafish have fine posture control. When roll-tilted, fish recovered their upright posture using a reflex behavior, which was a slight body bend near the swim bladder. The vestibular-induced body bend produces a misalignment between gravity and buoyancy, generating a moment of force that recovers the upright posture. We identified the neural circuits for the reflex, including the vestibular nucleus (tangential nucleus) through reticulospinal neurons (neurons in the nucleus of the medial longitudinal fasciculus) to the spinal cord, and finally to the posterior hypaxial muscles, a special class of muscles near the swim bladder. These results suggest that fish maintain a dorsal-up posture by frequently performing the body bend reflex and demonstrate that the reticulospinal pathway plays a critical role in fine postural control.


Conflict of interest statement

The authors declare no competing interests.

Figures

Fig. 1
Fig. 1. Larval fish perform the vestibular-induced bend reflex (VBR) during roll tilt.
a Schematic illustration of the behavioral imaging. b Snapshots of the fish during a left-down tilt. The frontal images are horizontally flipped (mirror-imaged) such that the left–right relationship matches with that of the dorsal images. The bars in the frontal images show the lines connecting the tops of the eyes. Head-roll angles are indicated at the top. The white dashed line denotes the midline of the rostral region of the fish. The magenta dashed line denotes the line connecting the caudal end of the swim bladder and the tail end. The magenta arrowhead indicates a body bend. The dorsal view of the fish became oblique when the fish recovered the posture (3 s) due to rotation of the dorsal side camera. c Time course of the head roll angles in response to tilt stimuli. Six trials in a fish are shown. The magenta trace corresponds to the trial shown in b. d, e Same as b and c, except fish were in water containing 0.8% methylcellulose. The body bend angles are shown in the bottom panels in d. In the middle panel in e, traces of the body bend angles are shown. Traces are terminated when the difference in the tilt angles between the chamber (bottom) and the head (top) exceeded 10° (see Methods). Seven trials from five fish are shown. The magenta traces correspond to the trial shown in d. f Snapshots of the head-embedded fish imaged from the dorsal side. In the middle and right panels, images of the fish with the maximum bends are shown. The black dashed lines indicate the edge of the agarose. g Time course of the body bend angles of a fish in response to tilt stimuli. The average and standard deviation of five trials from one fish are shown using the black line and gray shade, respectively. Scale bars, frontal images in b, d 200 μm; dorsal images in b, d, f 500 μm. Source data are provided as a Source Data file.
Fig. 2
Fig. 2. Biomechanics for the VBR-mediated postural recovery.
a A model of postural recovery from roll tilt by the VBR. Frontal and dorsal views and cross-section around the swim bladder. Gravity and buoyancy act at the center of mass (COM) and center of volume (COV), respectively. The COM and COV are located near the swim bladder, and the COM is located slightly rostral to the COV. In the dorso-ventral axis, the model assumes that the COM and COV are located in the same position. Left: the COM and COV are on the midline. Right: in the fish performing the VBR upon a roll tilt, the head and caudal body move toward the ear-up side, while the body around the swim bladder moves toward the ear-down side (top and middle). The COM and COV move toward the ear-up direction in the cross-section (bottom). The COM moves more laterally than the COV (see main text). This results in misalignment between gravity and buoyancy, generating a moment of force that counter-rotates the body. b A fish model with a deflated swim bladder. Positions of the COM and COV are the same even when fish perform the VBR (middle and bottom). Gravity and buoyancy are antiparallel on the same vertical axis (bottom). This does not generate a moment of force. c, d Behavioral experiments on fish with the swim bladder deflated. c Snapshots of the frontal and dorsal images of a fish during a left-down tilt. d Traces of the head roll and body bend angles of a fish in response to roll tilt. Six trials in one fish are shown. The magenta traces correspond to the trial shown in c. Scale bars, frontal images 200 μm; dorsal images 500 μm. Source data are provided as a Source Data file.
Fig. 3
Fig. 3. A hypothesis of the neuronal circuits that produce the VBR.
Vestibular inputs activate neurons in the tangential nucleus (TAN). TAN neurons project to neurons in the nucleus of the medial longitudinal fasciculus (nMLF) on the contralateral side. The axons of the nMLF neurons descend to the spinal cord and project to motoneurons that innervate posterior hypaxial muscles (PHMs). Rostral is toward the top. The dashed line shows the midline.
Fig. 4
Fig. 4. Ca2+ imaging of TAN neurons during roll tilts.
a TAN neurons photo-converted from green to red in Tg(evx2:Gal4; UAS:Dendra2) at 5 dpf. Confocal stacked image (maximum intensity projection). M1, M2, and M3 indicate the first, second, and third muscle segments, respectively. b Schematic of Ca2+ imaging experiments. A fish embedded in agarose is imaged using a tiltable objective microscope. c Top: image of a Tg(evx2:tdTomato-jGCaMP7b) fish. Middle and bottom: time course of ΔR/R0 in the TAN neurons in response to a roll tilt. d Pairwise comparison of the maximum ΔR/R0 in TAN neurons between ipsi-down and ipsi-up tilts (seven fish). Four to six trials were performed in a fish, and the average values are shown for each fish. p = 0.0003 (two-sided paired samples t test). Scale bars, 50 μm. Source data are provided as a Source Data file.
Fig. 5
Fig. 5. Ablation of TAN neurons impairs the VBR, while optogenetic activation of TAN neurons induces the VBR.
ad Ablation of TAN neurons. a Confocal stacked images of Tg(evx2:GFP) fish before and after laser ablation of left TAN neurons. b Behaviors of head-embedded fish during roll tilts. c Time course of the body bend angle upon roll tilt. The same trial shown in b. d Pairwise comparison of the maximum body bend angles between ablated-side-down and ablated-side-up tilts (three fish for left side ablation and four fish for right side ablation). Average values of two to four trials are shown for each fish. p = 0.003 (two-sided paired samples t-test). eh Control experiment. e Confocal stacked images of Tg(evx2:GFP) fish before and after laser ablation of non-TAN neurons on the right side (magenta circle). f Same as b upon a control experiment. g Same as c upon a control experiment. The same trial shown in f. h Same as d upon a control experiment (two fish for left side ablation and four fish for right side ablation). Average values of four to six trials are shown for each fish. p = 0.23 (two-sided paired samples t test). ik Optogenetic activation of TAN neurons. i Confocal stacked image of Tg(evx2:CoChR-GFP). The blue dotted circles are areas illuminated with blue light. j Behaviors of head-embedded fish upon blue light illumination. k Time course of the body bend angles. Positive values indicate body bend to the contralateral direction with respect to the illumination. The blue bar indicates illumination that lasts for 5 s. Six trials in a fish are shown. ln Control experiment. l Same as i, but different areas (blue dotted circles) were illuminated as a control experiment. m Same as j upon a control experiment. n Same as k upon a control experiment. Four trials in a fish are shown. o Body-bend angle upon optogenetic activation (mean angle between 4 and 5 s). Six fish for each. p = 0.004 (two-sided two-sample t-test). Scale bars, a, e, i, l 50 μm; b, f, j, m 500 μm. Source data are provided as a Source Data file.
Fig. 6
Fig. 6. Ca2+ imaging of nMLF neurons during roll tilts.
a Top: confocal stacked image of nMLF neurons that were retrogradely labeled with Ca2+ indicator, Cal-520, and rhodamine dextran. Bottom: single optical section. Scale bar, 20 μm. b Time course of ΔR/R0 in each neuron in response to roll tilt. The numbers correspond to those in a. c Color-coded ΔR/R0 traces of all nMLF neurons (330 neurons from 10 fish, with 163 for the left side and 167 for the right side) in response to a roll tilt. Neurons are grouped by their location (left or right) and are sorted by the maximum ΔR/R0 during ipsi-up tilt. Neuronal indexes are denoted on the left. d Graph showing the maximum ΔR/R0 during ipsi-up tilt (Y axis) vs. the soma area size (X axis). Source data are provided as a Source Data file.
Fig. 7
Fig. 7. Ablation of nMLF neurons impairs the VBR.
ae Ablation of nMLF neurons. a Schematic showing optical backfill followed by laser ablation of nMLF neurons. b Confocal stacked images before (top) and after (bottom) laser ablation of nMLF neurons on the left side. c Behaviors of head-embedded fish during roll tilts. d Time course of the body bend angle in response to roll tilt. The same trial shown in c. e Pairwise comparison of maximum body bend angles between ablated-side-down and ablated-side-up tilts (eight fish; four for each side ablation). Average values of at least five trials are shown for each fish. p = 0.003 (two-sided paired samples t test). fi Control experiment. f Confocal stacked images fish before (top) and after (bottom) laser ablation of hindbrain neurons (non-nMLF neurons) in Tg(pitx2:Dendra2). g Same as c upon a control experiment. h Same as d upon a control experiment. The same trial shown in g. i Same as e upon a control experiment (five fish, with three for left side ablation and two for right side ablation). Average values of five to eight trials are shown for each fish. p = 0.05 (two-sided paired samples t-test). Scale bars, b, f 50 μm; c, g 500 μm. Source data are provided as a Source Data file.
Fig. 8
Fig. 8. Ca2+ imaging of slow-type PHMs during roll tilts.
a Schematic showing simultaneous imaging of Ca2+ in PHMs and fish behaviors. b Fluorescence images of Tg(smyhc2:tdTomato-jGCaMP7b) fish at 6 dpf. Left: lateral view. Red fluorescence and transmitted light images are merged. Right: ventral view of the area around PHMs (“imaging area” in the left panel). Rostral is to the top. Green and red channels are merged. PHMs are bilaterally located (dashed blue lines). They consist of the following three segments: rostral, middle and caudal segments. Autofluorescence (greenish signal) derived from intestine and yolk is present in the middle. Scale bars, 200 μm. c Time course of ΔR/R0 in each segment of slow-type PHMs and body bend angles in response to a roll tilt. d Pairwise comparison of maximum ΔR/R0 in each segment of slow-type PHMs between ipsi-down and ipsi-up tilts (six fish). A single trial or average values of two trials are shown for each fish. p = 0.01 for the rostral, p = 0.02 for the middle, and p = 0.0006 for the caudal segments (two-sided paired samples t test). Source data are provided as a Source Data file.
Fig. 9
Fig. 9. Ablation of slow-type PHMs impairs the VBR.
a Images of immunohistochemistry with S58 antibody against Tg(smyhc2:loxP-RFP-loxP-DTA) fish. Top: images of a fish without tbx2b:Cre (control). Bottom: images of a fish with tbx2b:Cre. b Behaviors of Tg(tbx2b:Cre; smyhc2:loxP-RFP-loxP-DTA) fish in the head-embedded condition during roll tilts. c Time course of the body bend angle in response to roll tilt. The same trial as shown in b. d Maximum body bend angles of control (without Cre) and PHM-ablated (with Cre) fish (six fish for each). Average values of at least five trials are shown for each fish. p = 0.0004 (two-sided two-sample t test). Scale bars, a 100 μm; b 500 μm. Source data are provided as a Source Data file.

Similar articles

Cited by

References

    1. Maki BE, McIlroy WE, Fernie GR. Change-in-support reactions for balance recovery. IEEE Eng. Med. Biol. Mag. 2003;22:20–26. doi: 10.1109/MEMB.2003.1195691. - DOI - PubMed
    1. Le Mouel C, Brette R. Mobility as the purpose of postural control. Front. Comput. Neurosci. 2017;11:67. doi: 10.3389/fncom.2017.00067. - DOI - PMC - PubMed
    1. Morasso PBACMSV. Preflexes and internal models in biomimetic robot systems. Cogn. Process. 2005;6:25–36. doi: 10.1007/s10339-004-0039-6. - DOI
    1. Cullen KE. The vestibular system: multimodal integration and encoding of self-motion for motor control. Trends Neurosci. 2012;35:185–196. doi: 10.1016/j.tins.2011.12.001. - DOI - PMC - PubMed
    1. Forbes PA, Siegmund GP, Schouten AC, Blouin JS. Task, muscle and frequency dependent vestibular control of posture. Front. Integr. Neurosci. 2014;8:94. - PMC - PubMed

Publication types