. 2023 Mar 10;14(1):1326.
doi: 10.1038/s41467-023-36900-7.

Different NIPBL requirements of cohesin-STAG1 and cohesin-STAG2

Affiliations

Different NIPBL requirements of cohesin-STAG1 and cohesin-STAG2

Dácil Alonso-Gil et al. Nat Commun. .

Abstract

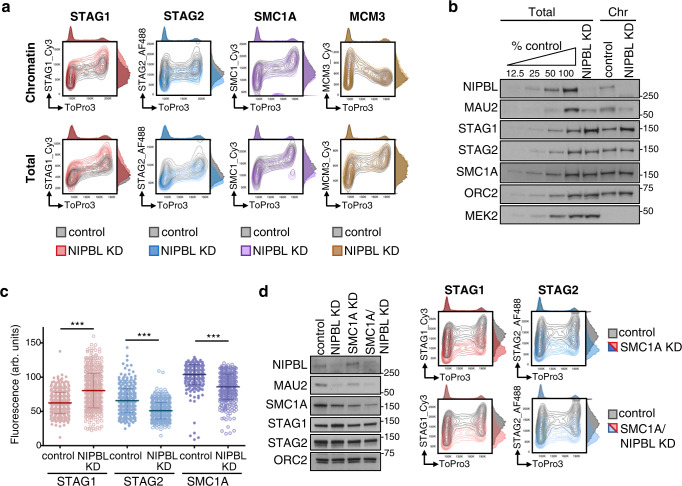
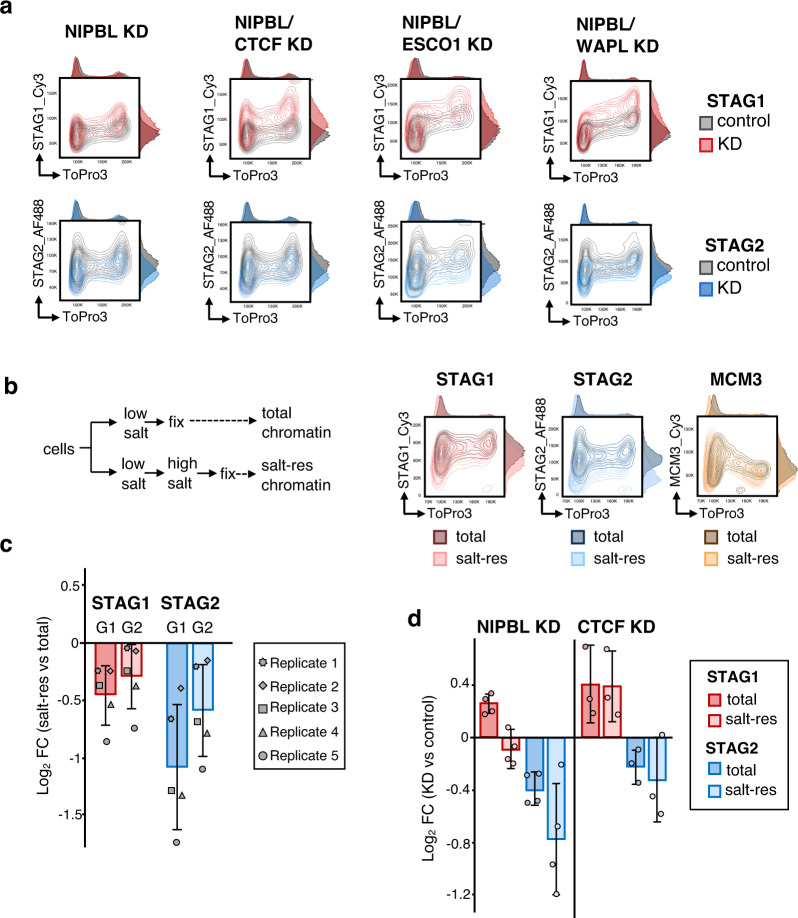
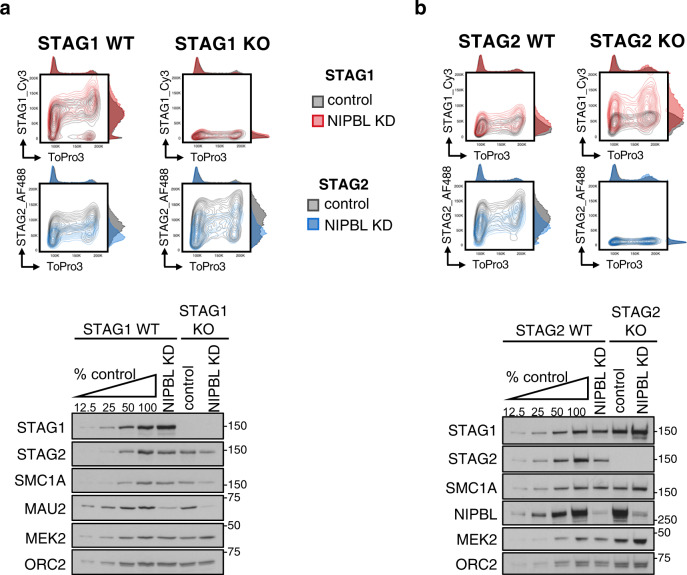
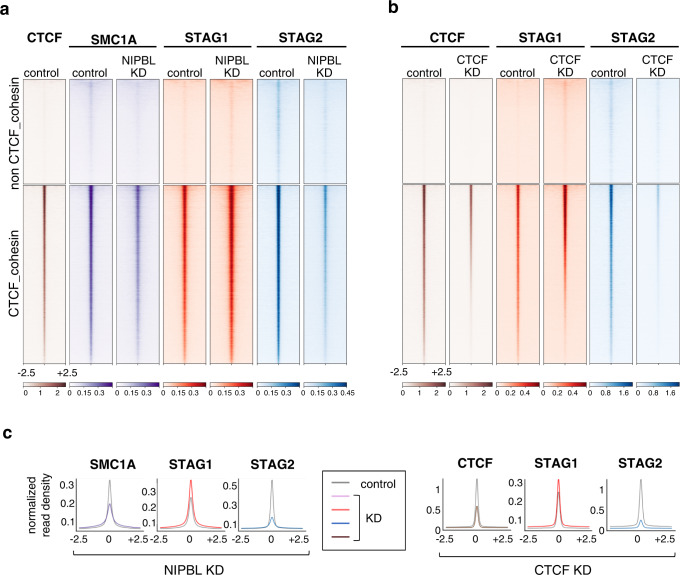
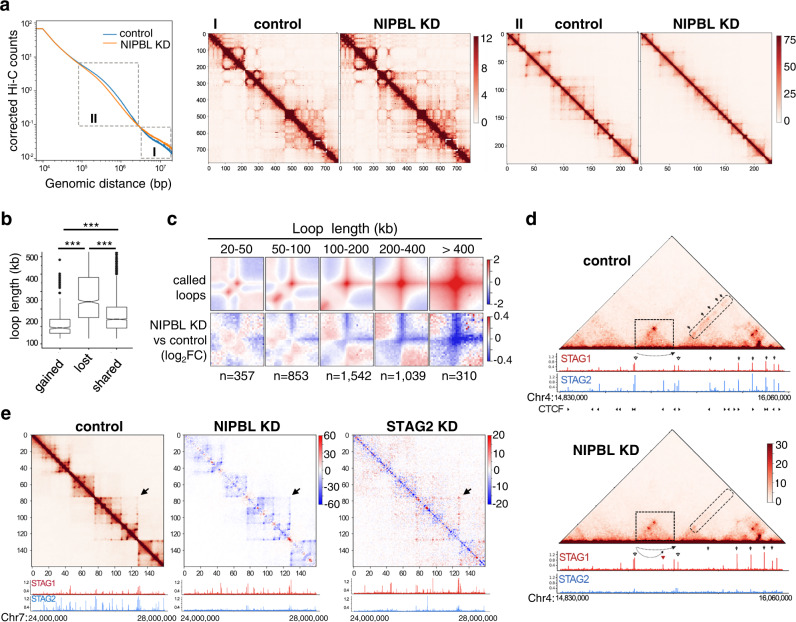
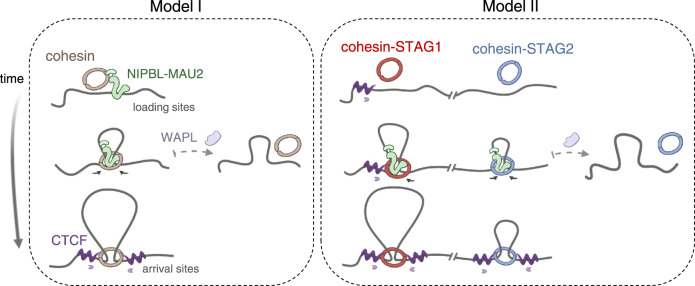
Cohesin organizes the genome through the formation of chromatin loops. NIPBL activates cohesin's ATPase and is essential for loop extrusion, but its requirement for cohesin loading is unclear. Here we have examined the effect of reducing NIPBL levels on the behavior of the two cohesin variants carrying STAG1 or STAG2 by combining a flow cytometry assay to measure chromatin-bound cohesin with analyses of its genome-wide distribution and genome contacts. We show that NIPBL depletion results in increased cohesin-STAG1 on chromatin that further accumulates at CTCF positions while cohesin-STAG2 diminishes genome-wide. Our data are consistent with a model in which NIPBL may not be required for chromatin association of cohesin but it is for loop extrusion, which in turn facilitates stabilization of cohesin-STAG2 at CTCF positions after being loaded elsewhere. In contrast, cohesin-STAG1 binds chromatin and becomes stabilized at CTCF sites even under low NIPBL levels, but genome folding is severely impaired.


Conflict of interest statement

The authors declare no competing interests.

Figures

Fig. 1
Fig. 1. NIPBL KD affects cohesin-STAG1 and cohesin-STAG2 in opposite ways.
a Asynchronously growing HeLa cells mock transfected (control) or transfected with siRNA against NIPBL (NIPBL KD) were analyzed by flow cytometry 72 h later. Contour plots of the indicated proteins in control (gray plots) and NIPBL KD cells (colored plots) were overlapped for comparison. For each map, the cell cycle profile according to DNA content appears on top while the distribution of antibody intensities is plotted on the right. b Immunoblot analysis of chromatin fractions (Chr) and total cell extracts from control and NIPBL KD cells. Increasing amounts of total extract from control cells were loaded to better quantitate the extent of depletion. NIPBL partner MAU2 also decreases after NIPBL KD. This is one representative experiment of at least 3 performed. c Quantitative immunofluorescence (arb. units, arbitrary units) of control or NIPBL KD HeLa cells stained with antibodies against STAG1, STAG2 and SMC1A. At least 372 cells were analyzed per condition in a single experiment. Means and SD are plotted. A non-parametric Mann–Whitney two-sided test with confidence intervals of 99% was performed. ***p < 2e−16. See also Supplementary Table 1. d Flow cytometry contour plots for chromatin-bound STAG1 and STAG2 in control (gray contour plots), SMC1 KD and double NIPBL/SMC1A KD (colored contour plots) HeLa cells. The immunoblot on the left shows remaining protein levels in total cell extracts in the different conditions. The experiment was performed twice with similar results.
Fig. 2
Fig. 2. Effect of cohesin regulators on the response of cohesin variants to NIPBL KD.
a Representative flow cytometry contour plots for chromatin-bound STAG1 and STAG2 in control (gray plots) and KD (colored plots) HeLa cells. For each double KD condition, a single KD condition was also analyzed (see Supplementary Fig. 3). The NIPBL KD plot shown corresponds to the experiment co-depleting NIPBL and CTCF. Experiments were performed three times with similar results. b Left, scheme of the experiment. Right, flow cytometry contour plots comparing total and salt-resistant chromatin-bound levels of STAG1, STAG2 and MCM3. c Quantification of salt-resistant vs. total chromatin-bound levels of STAG1 and STAG2 in G1 and G2 (n = 5 experiments). The graph shows mean and standard deviation (SD) of the log2 fold change (log2FC) of median antibody intensity (salt res vs. total). d Changes in total and salt-resistant chromatin-bound levels of STAG1 and STAG2 in G1 cells after NIPBL KD (n = 4 experiments) or CTCF KD (n = 3 experiments). The graph shows mean and SD of the log2FC of median antibody intensity (KD vs. control).
Fig. 3
Fig. 3. NIPBL KD increases cohesin on chromatin in STAG2 KO cells.
a Top, contour plot profiles of chromatin-bound STAG1 and STAG2 in A673 cells with (WT) or without (KO) STAG1 in control (gray) and NIPBL KD (colored) condition. Bottom, immunoblot analyses of the same cells. b As in a, for A673 cells with (WT) or without (KO) STAG2. All experiments were performed three times with similar results.
Fig. 4
Fig. 4. Cohesin-STAG1 accumulates at CTCF sites in NIPBL KD cells.
a Distribution of three cohesin subunits in control and NIPBL KD MCF10A cells. Reads from calibrated ChIP-seq are plotted in a 5-kb window centered in the summits of cohesin positions with and without CTCF (24,912 and 14,607 positions, respectively). Information on replicates and additional datasets used in Supplementary Table 4. b Distribution of CTCF, STAG1 and STAG2 in control and CTCF KD MCF10A cells, as in a. For a replicate experiment and additional analyses see Supplementary Fig. 5. c Normalized read density plots for cohesin subunits ±2.5 kb of the summit in the different KD conditions from the heatmaps above.
Fig. 5
Fig. 5. NIPBL is required for loop extrusion.
a Contact probability as a function of genome distance in control and NIPBL KD cells (left) and normalized contact matrices for whole chromosome 17 (I) and the boxed region within (II; Chr17:66,700,000–72,500,000) that exemplify changes at very long (I) and TAD-scale (II) distances. Resolution is 100 kb/bin in I and 25 kb/bin in II. In situ Hi-C data come from three replicates in mock transfected (control) MCF10A cells and four replicates in NIPBL KD cells (see Supplementary Fig. 6). b Box plot for the size of gained (406), lost (1029) and shared (2666) loops called at 10-kb resolution between control and NIPBL KD cells (see “Methods” and Supplementary Data 1 for genomic coordinates). Boxes represent interquartile range (IQR); the midline represents the median; whiskers are 1.5 × IQR; and individual points are outliers. A non-parametric Mann–Whitney two-sided test and Holm’s correction for multiple comparisons was used. ***p < 2e−16. c Metaplots for loops of the indicated sizes in control cells (top) and how they change after NIPBL KD (bottom). The number of loops in each category is indicated below. d Representative region in chromosome 4 (chr4:14,830,000–16,060,000) showing contacts (10-kb resolution), distribution of STAG1 and STAG2, and CTCF positions and orientation (top matrix only). In the center of the matrix (boxed) a long loop decreases and a shorter one within slightly increases in the NIPBL KD condition (dashed arrows below the matrix). On the right, a stripe that is reduced indicated. Arrowheads signal cohesin positions. e Comparison of the differential contacts observed in NIPBL KD and STAG2 KD cells (25 kb/bin) in a region of chromosome 7 (chr7:24,000,000–28,000,000) and corresponding distribution of STAG1 and STAG2, as measured by ChIP-seq. The matrix shown on the left corresponds to the control of NIPBL KD cells. Arrow points to a 1.3 Mb-long loop that disappears in NIPBL KD but is maintained (even increased) in STAG2 KD cells.
Fig. 6
Fig. 6. An alternative model for the role of NIPBL in chromatin association and extrusion by the two cohesin variants.
In model I, NIPBL-MAU2 promotes chromatin association of cohesin (STAG1 or STAG2) as well as loop extrusion until the complex is released by WAPL or becomes arrested by CTCF proteins bound in convergent orientation. In the alternative model II, NIPBL-MAU2 is not required for association of cohesin with chromatin, but it is for loop extrusion. Cohesin-STAG1 binds at/near CTCF sites while cohesin-STAG2 is loaded elsewhere and requires NIPBL to reach them. Image created with BioRender.com.

References

    1. Yatskevich S, Rhodes J, Nasmyth K. Organization of chromosomal DNA by SMC complexes. Annu. Rev. Genet. 2019;53:445–482. doi: 10.1146/annurev-genet-112618-043633. - DOI - PubMed
    1. Davidson IF, Peters JM. Genome folding through loop extrusion by SMC complexes. Nat. Rev. Mol. Cell Biol. 2021;22:445–464. doi: 10.1038/s41580-021-00349-7. - DOI - PubMed
    1. Oldenkamp R, Rowland BD. A walk through the SMC cycle: from catching DNAs to shaping the genome. Mol. Cell. 2022;82:1616–1630. doi: 10.1016/j.molcel.2022.04.006. - DOI - PubMed
    1. van der Lelij P, et al. Synthetic lethality between the cohesin subunits STAG1 and STAG2 in diverse cancer contexts. Elife. 2017;6:e26980. doi: 10.7554/eLife.26980. - DOI - PMC - PubMed
    1. Casa V, et al. Redundant and specific roles of cohesin STAG subunits in chromatin looping and transcriptional control. Genome Res. 2020;30:515–527. doi: 10.1101/gr.253211.119. - DOI - PMC - PubMed

Publication types