. 2023 Mar 10;14(1):1328.
doi: 10.1038/s41467-023-36713-8.

The TINCR ubiquitin-like microprotein is a tumor suppressor in squamous cell carcinoma

Affiliations

The TINCR ubiquitin-like microprotein is a tumor suppressor in squamous cell carcinoma

Lucia Morgado-Palacin et al. Nat Commun. .

Abstract

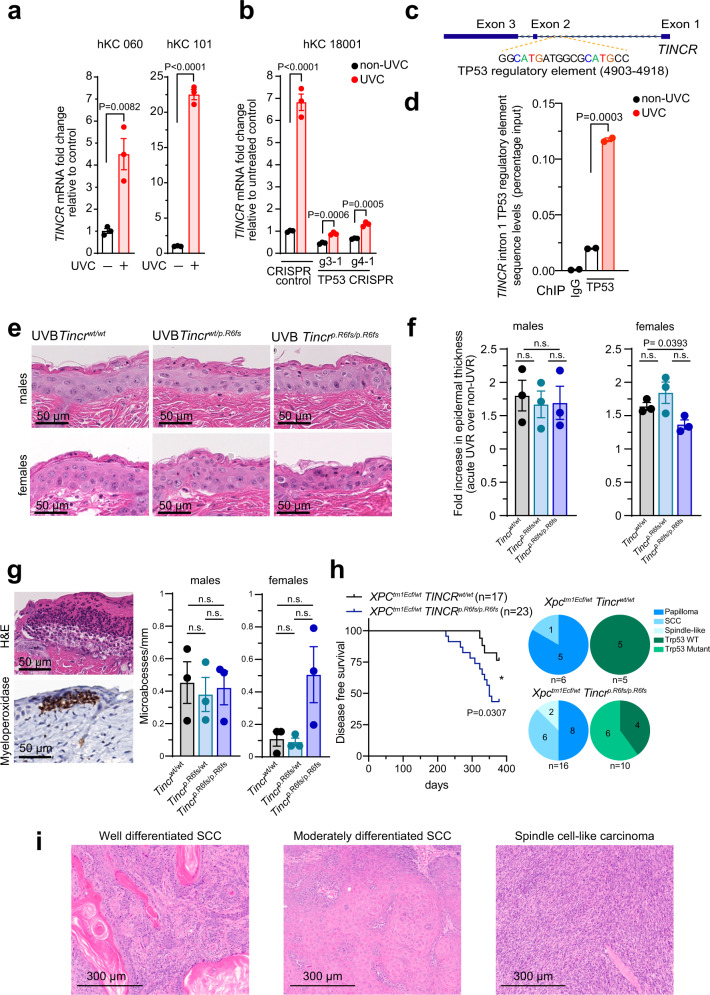
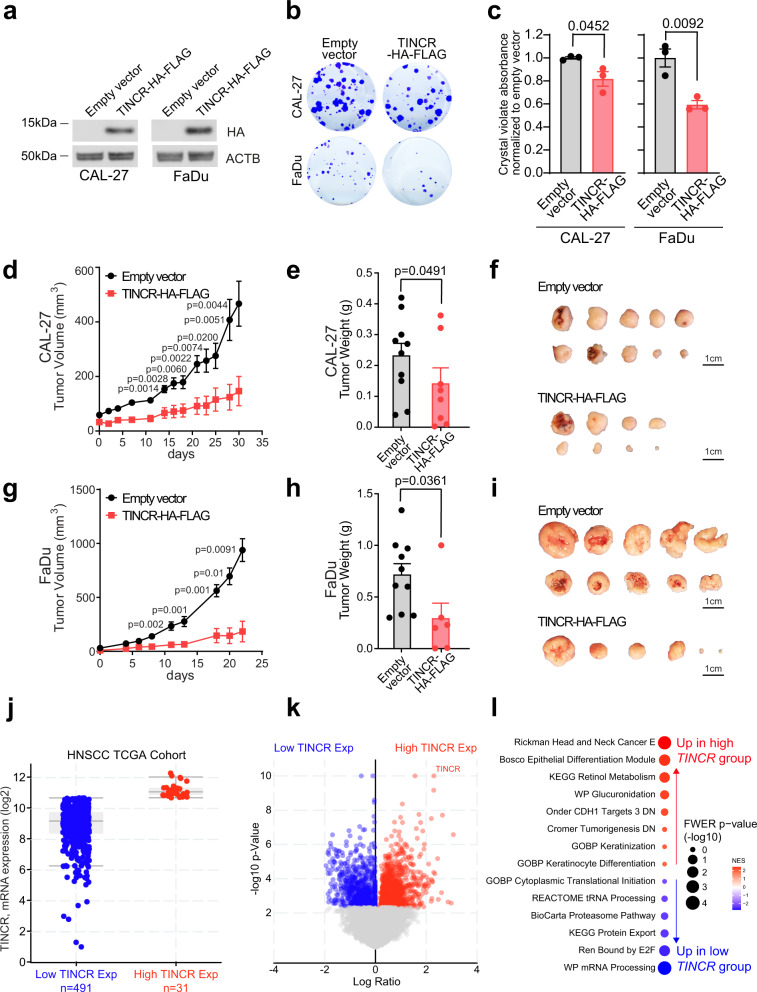
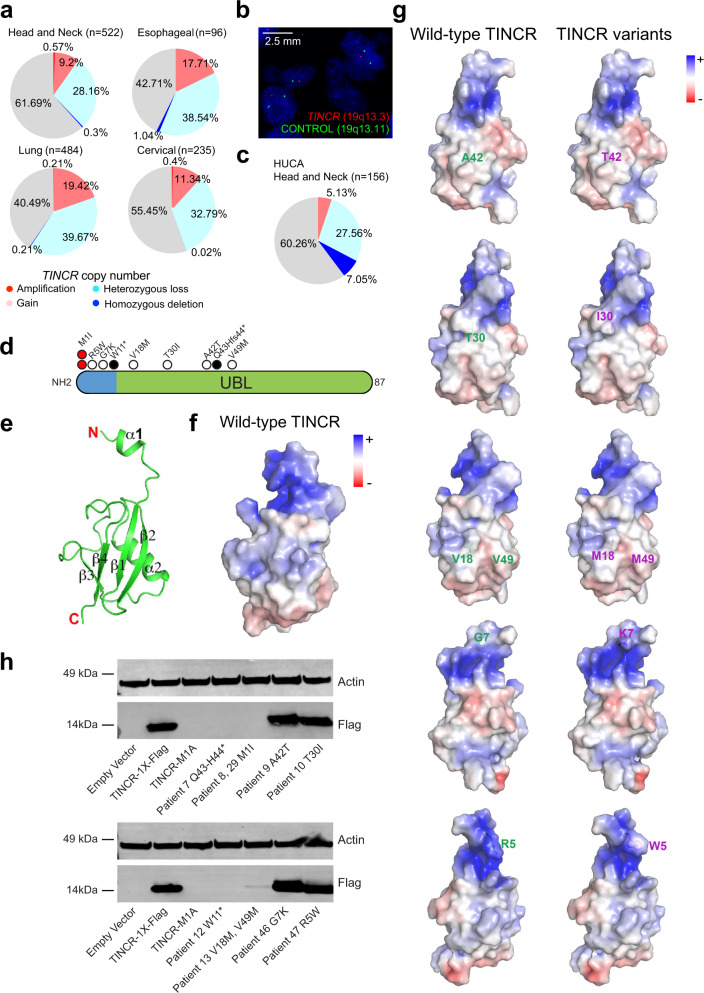
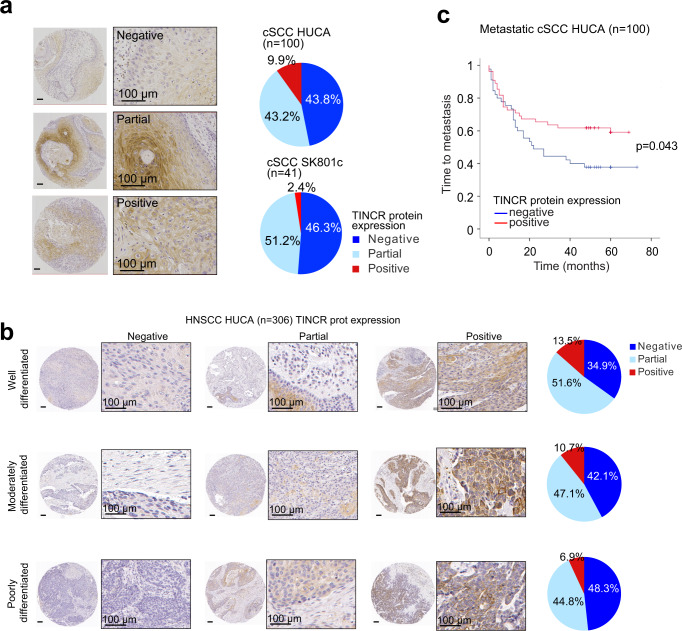
The TINCR (Terminal differentiation-Induced Non-Coding RNA) gene is selectively expressed in epithelium tissues and is involved in the control of human epidermal differentiation and wound healing. Despite its initial report as a long non-coding RNA, the TINCR locus codes for a highly conserved ubiquitin-like microprotein associated with keratinocyte differentiation. Here we report the identification of TINCR as a tumor suppressor in squamous cell carcinoma (SCC). TINCR is upregulated by UV-induced DNA damage in a TP53-dependent manner in human keratinocytes. Decreased TINCR protein expression is prevalently found in skin and head and neck squamous cell tumors and TINCR expression suppresses the growth of SCC cells in vitro and in vivo. Consistently, Tincr knockout mice show accelerated tumor development following UVB skin carcinogenesis and increased penetrance of invasive SCCs. Finally, genetic analyses identify loss-of-function mutations and deletions encompassing the TINCR gene in SCC clinical samples supporting a tumor suppressor role in human cancer. Altogether, these results demonstrate a role for TINCR as protein coding tumor suppressor gene recurrently lost in squamous cell carcinomas.


Conflict of interest statement

A.S. founded Velia Therapeutics and TFM consults and owns shares in Velia Therapeutics. J.A.B. and A.A.F. are currently employed by Regeneron Pharmaceuticals. The remaining authors declare no competing interests.

Figures

Fig. 1
Fig. 1. TINCR is a p53 target gene upregulated in response to UV-induced damage.
a RT-PCR of TINCR levels in human keratinocytes from two foreskin samples (060 and 101) at baseline and following UVC radiation (100 mJ/cm2) as average values normalized to ACTB relative to untreated controls. Error bars: standard error of the mean in technical replicates. P values: two-tailed unpaired Student’s t-test. b TINCR RNA levels in wild type and CRISPR TP53 knockout human keratinocytes targeted by gRNAs (g3-1, g4-1) in basal conditions and 4 h following UVC radiation (20 mJ/cm2) as in a. c Localization of the intron 1 TP53 regulatory element in the TINCR locus. d Quantitative PCR analysis of TP53 antibody chromatin immunoprecipitation with primers flanking the TP53 regulatory element in human keratinocytes at baseline and following UVC treatment. IgG chromatin immunoprecipitation is shown as control. P values: two-tailed unpaired Student’s t-test. e Representative images of hematoxylin-eosin-stained back skin from UVB-treated wild type, heterozygous, and homozygous Tincr mutant mice. f Quantification of epidermal thickness following UVB radiation in male (n = 3) and female (n = 3) mice for each Tincr genotype as in e as average values of relative skin thickness normalized to non-UVB-treated controls for each sex and genotype. Error bars: standard error of the mean. P values: two-tailed unpaired Student’s t-test. g Hematoxylin-eosin and myeloperoxidase stains showing UVB-induced skin microabscesses, and quantification of the number of these lesions in males and females for each Tincr genotype. Graphs show average values, each dot represents one mouse, and error bars correspond to the standard error of the mean. P values: two-tailed unpaired Student’s t-test. h Kaplan–Meier disease-free survival curves of Xpctm1Ecf/wt Tincrwt/wt (n = 17) and Xpctm1Ecf/wt Tincrp.R6fs/p.R6fs (n = 23) mice following long-term exposure to UVB (100 mJ/cm2, 3 times per week for 35 weeks). P values: log-rank Mantel–Cox test. Pie chart graphs show numbers of papillomas (dark blue), squamous cell carcinomas (medium blue) or spindle cell-like carcinomas (light blue) and if lesions were Trp53 wild-type (dark green) or Trp53 mutant (light green) in Xpctm1Ecf/wt Tincrwt/wt and Xpctm1Ecf/wt Tincrp.R6fs/p.R6fs mice. i Haematoxylin-eosin-stained micrographs of SCC tumors developing following chronic UVB exposure in Xpctm1Ec/wt Tincrp.R6fs/p.R6fs mice. Source data are provided as a Source Data file.
Fig. 2
Fig. 2. TINCR suppresses squamous cell carcinoma cells and tumor growth.
a Western blot analysis of exogenous TINCR protein expression in HNSCC cell lines infected with empty or TINCR-HA-FLAG expression vectors. b Representative images of colony-forming assays in CAL-27 and FaDu cells expressing either empty vector or TINCR-HA-FLAG constructs. c Quantification of colony growth as in b. Graphs show average crystal violet signal across technical triplicates. Error bars show the standard error of the mean. Data were representative of two independent experiments. d In vivo intradermal tumor growth of CAL-27 cells expressing either empty vector or TINCR-HA-FLAG constructs. Growth curves show the average volume and standard deviation across ten independent tumors for each condition. Error bars show the standard error of the mean. e Graph shows the average weight of tumors recovered at the endpoint for each condition as in d. Error bars show the standard error of the mean. f Images of tumors recovered at endpoint for each condition as in e. g In vivo intradermal tumor growth of FaDu cells expressing either empty vector or TINCR-HA-FLAG constructs. Growth curves show the average volume and standard deviation across ten independent tumors for each condition. Error bars show the standard error of the mean. h Graph shows the average weight of tumors recovered at the endpoint for each condition as in g. Error bars show the standard error of the mean. i Images of tumors recovered at endpoint for each condition as in g. j Box and whisker plot of TINCR mRNA expression across TCGA HNSCC patients with high (n = 31, red) and low (n = 491, blue) TINCR expression. k Volcano plot representation of differential gene expression between HNSCC patients with high and low expression of TINCR. l Dot plot representation of GSEA analysis in HNSCC patients with high TINCR expression compared to HNSCC patients with low TINCR expression. P values in ce, g, h correspond to two-tailed unpaired Student’s t-test. Source data are provided as a Source Data file.
Fig. 3
Fig. 3. Prevalence and structural consequence of TINCR deletions in human cancer.
a Frequency of TINCR copy number alterations in TCGA HNSCC, lung SCC, esophageal SCC, and cervical SCC tumors. b Representative image of TINCR heterozygous loss detection by fluorescence in situ hybridization (FISH) in HNSCC. c Pie chart representation of frequency TINCR copy number alterations in TCGA HNSCC analyzed by FISH. d Schematic representation of the TINCR protein indicating the position of mutations identified in HNSCC patient tumor samples. Translation-initiating codon mutations are depicted as red circles, truncating mutations as black circles, and single amino acid substitutions as white circles. e Ribbon diagram representation of TINCR protein crystal structure at 2.12 Å resolution. f Electrostatic surface potential of the wild-type TINCR protein. Positively charged regions are shown in blue (kT/e = +5) and negatively-charged regions are shown in red (kT/e = −5). g Electrostatic surface potential of the documented TINCR variants. Positively charged regions are shown in blue (kT/e = +5) and negatively-charged regions are shown in red (kT/e = −5). h Western blot of analysis of documented TINCR variants on TINCR protein expression in 293 cells infected with empty vector, TINCR-1X-Flag, or variant TINCR constructs. Source data are provided as a Source Data file.
Fig. 4
Fig. 4. Prognostic impact of the loss of TINCR protein expression in human cancer.
a Representative images of immunohistochemical analysis of TINCR protein expression in cSCC tumors. Pie chart graphs show the prevalence of different TINCR protein expression patterns in two independent cohorts of cSCC samples. Negative (blue): no detection. Partial (light blue): TINCR expression is limited to differentiated areas of the tumor. Positive (red): diffuse TINCR staining. b Representative images of the different staining patterns of TINCR detected by immunohistochemistry in HNSCC patient tumor samples classified according to their differentiation grade. Pie chart graphs depict the distribution of TINCR protein expression patterns in relation to the tumor differentiation grading in a cohort of 306 HNSCC cases. c Kaplan–Meier curves indicating time to metastasis in patients with metastatic cSCC dichotomized according to TINCR protein expression.

References

    1. Mercer TR, Dinger ME, Mattick JS. Long non-coding RNAs: insights into functions. Nat. Rev. Genet. 2009;10:155–159. doi: 10.1038/nrg2521. - DOI - PubMed
    1. Chowdhary A, Satagopam V, Schneider R. Long non-coding RNAs: mechanisms, experimental, and computational approaches in identification, characterization, and their biomarker potential in cancer. Front. Genet. 2021;12:649619. doi: 10.3389/fgene.2021.649619. - DOI - PMC - PubMed
    1. Wan, D. C. & Wang, K. C. Long noncoding RNA: significance and potential in skin biology. Cold Spring Harb. Perspect. Med.4, a015404 (2014). - PMC - PubMed
    1. Kretz M, et al. Control of somatic tissue differentiation by the long non-coding RNA TINCR. Nature. 2013;493:231–235. doi: 10.1038/nature11661. - DOI - PMC - PubMed
    1. Sharma U, et al. Long non-coding RNA TINCR as potential biomarker and therapeutic target for cancer. Life Sci. 2020;257:118035. doi: 10.1016/j.lfs.2020.118035. - DOI - PMC - PubMed

Publication types