. 2023 Mar 10;14(1):1330.
doi: 10.1038/s41467-023-36824-2.

LYN kinase programs stromal fibroblasts to facilitate leukemic survival via regulation of c-JUN and THBS1

Affiliations

LYN kinase programs stromal fibroblasts to facilitate leukemic survival via regulation of c-JUN and THBS1

Alexander F Vom Stein et al. Nat Commun. .

Abstract

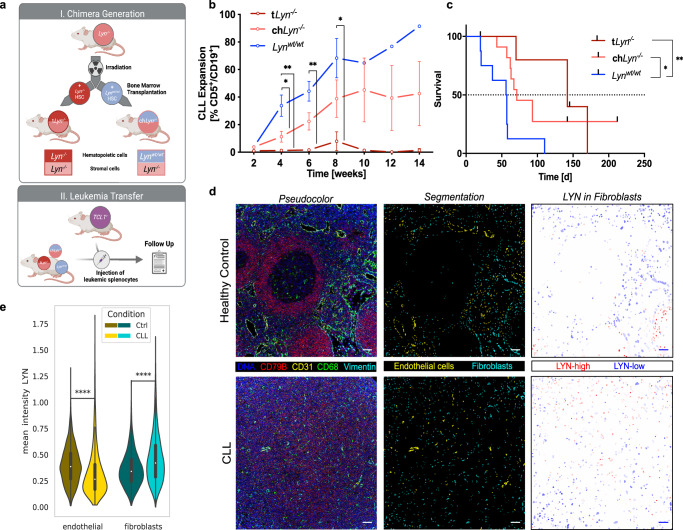
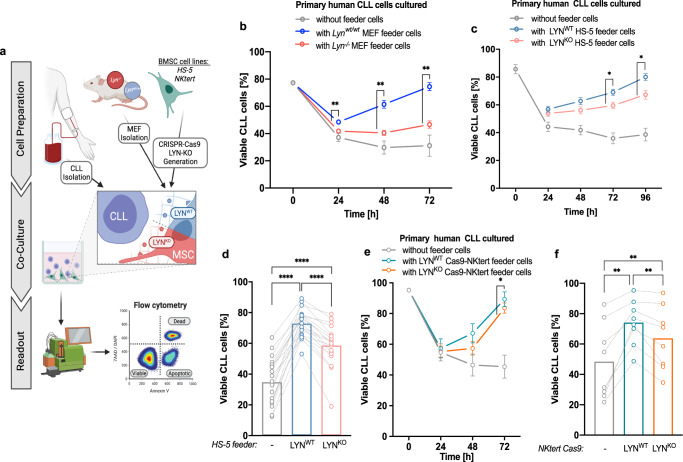
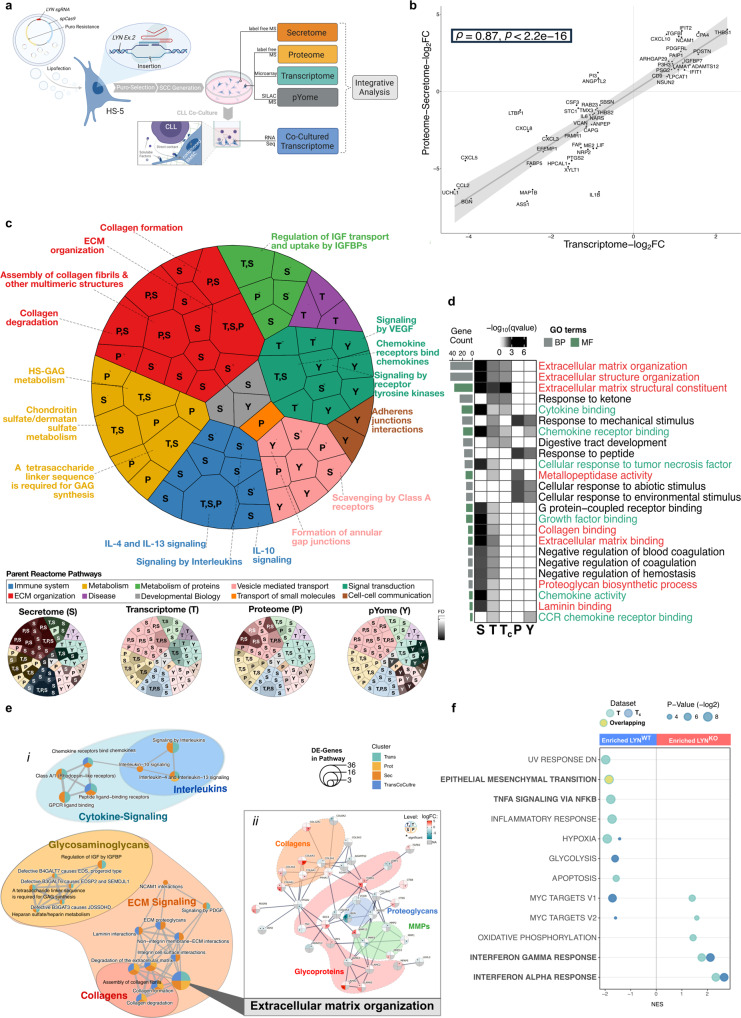
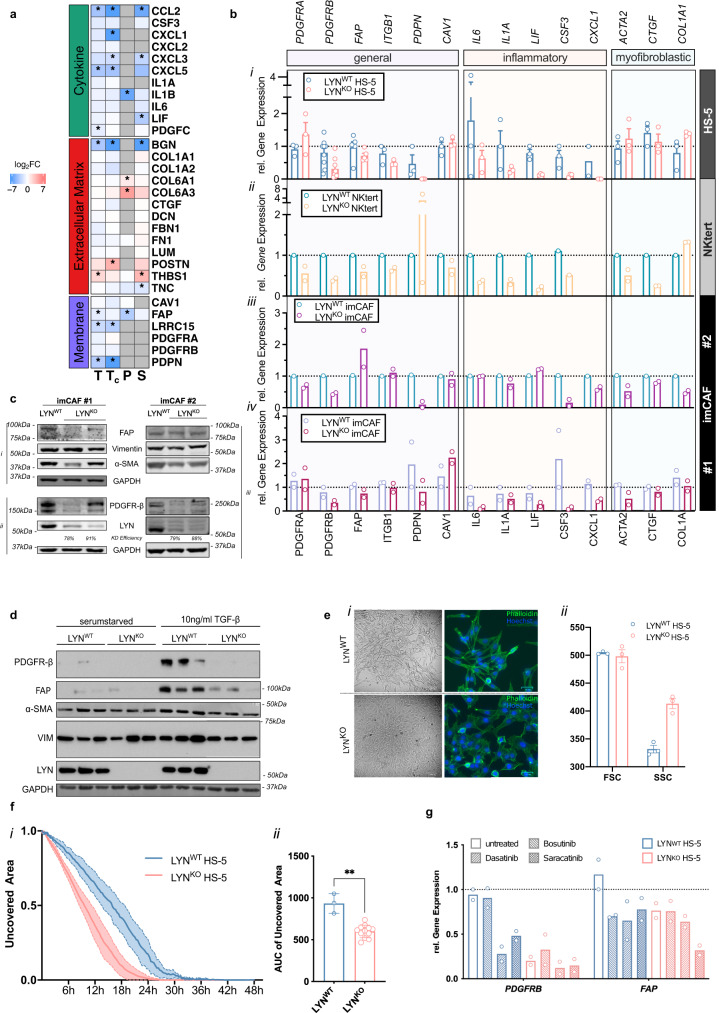
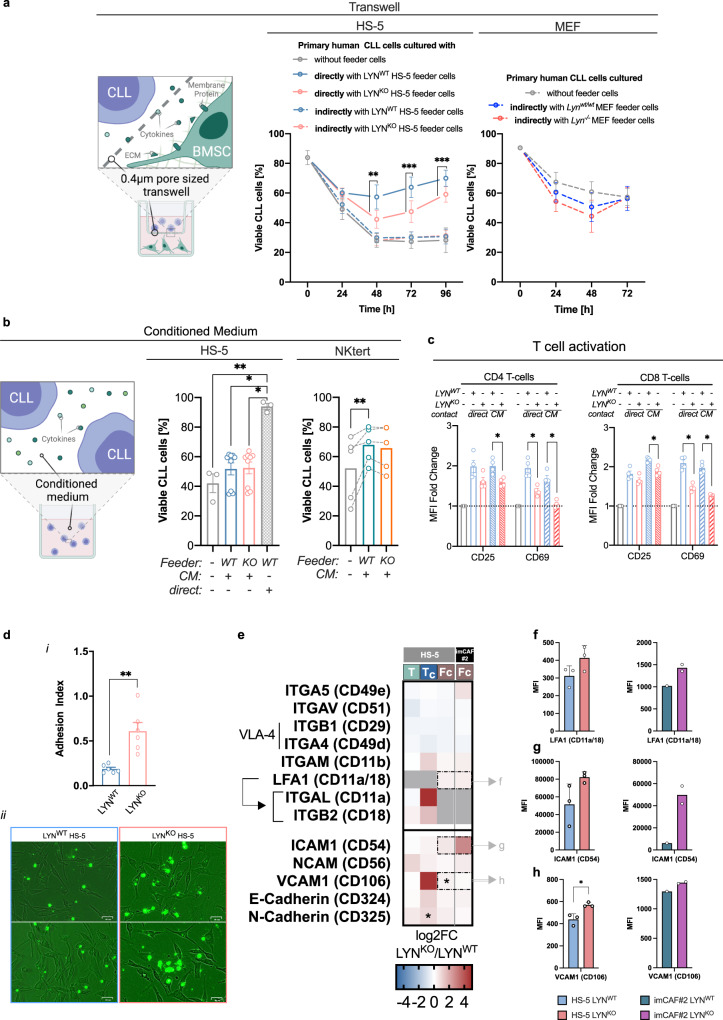
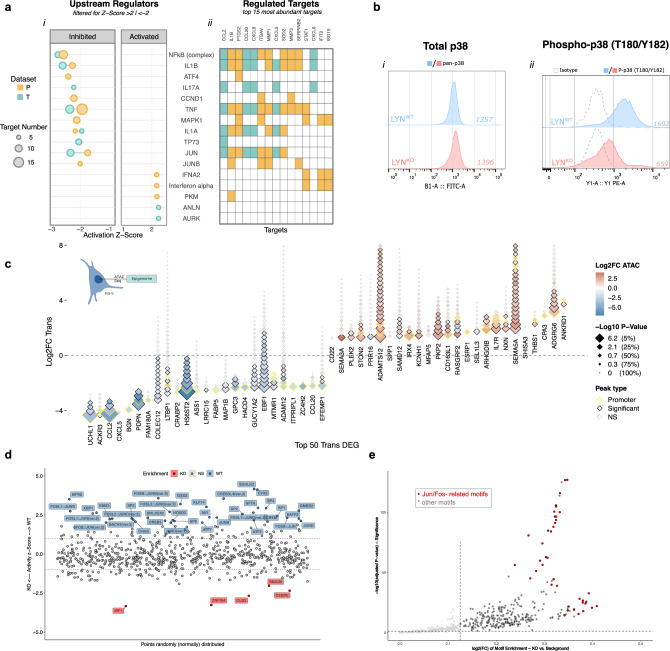
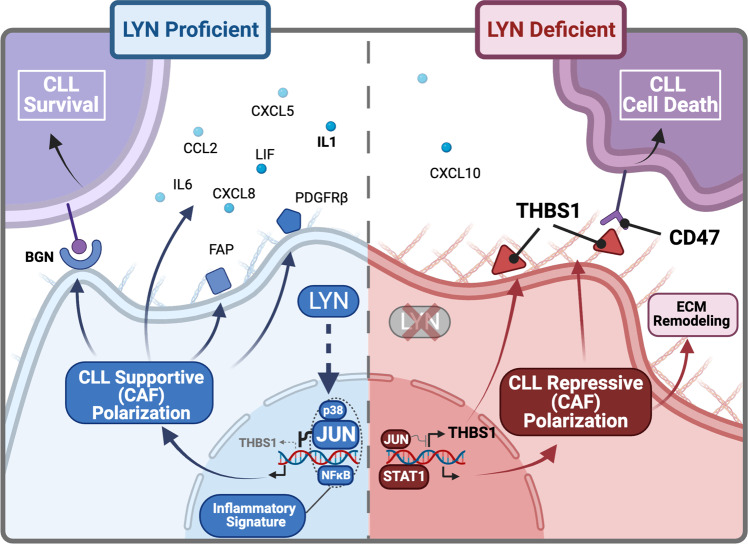
Microenvironmental bystander cells are essential for the progression of chronic lymphocytic leukemia (CLL). We have discovered previously that LYN kinase promotes the formation of a microenvironmental niche for CLL. Here we provide mechanistic evidence that LYN regulates the polarization of stromal fibroblasts to support leukemic progression. LYN is overexpressed in fibroblasts of lymph nodes of CLL patients. LYN-deficient stromal cells reduce CLL growth in vivo. LYN-deficient fibroblasts show markedly reduced leukemia feeding capacity in vitro. Multi-omics profiling reveals that LYN regulates the polarization of fibroblasts towards an inflammatory cancer-associated phenotype through modulation of cytokine secretion and extracellular matrix composition. Mechanistically, LYN deletion reduces inflammatory signaling including reduction of c-JUN expression, which in turn augments the expression of Thrombospondin-1, which binds to CD47 thereby impairing CLL viability. Together, our findings suggest that LYN is essential for rewiring fibroblasts towards a leukemia-supportive phenotype.


Conflict of interest statement

This study was partially supported with a research funding by Gilead Sciences to M.H. T.O. received research funding from Gilead and Merck KGaA (not related to this work). T.O. is consultant for Roche and Merck KGaA (both not related to this work). The remaining authors declare no other competing interests.

Figures

Fig. 1
Fig. 1. LYN kinase in non-hematopoietic microenvironmental cells promoted CLL expansion.
a Graphical illustration of the in vivo experimental setup. I. Lyn−/− mice were lethally irradiated and the hematopoietic system was reconstituted using Lyn−/− or Lynwt/wt bone marrow transplantation (BMT), resulting in chimeric mice lacking LYN globally (tLyn−/−) or specifically in the radioresistant stromal compartment (chLyn-/-). II. The hematopoietic system was successfully reconstituted after 8 weeks and chimeric mice were subsequently transplanted with 107 murine TCL1tg/wt CLL cells (4 biological replicates). Illustration was created with BioRender.com. b Leukemic expansion in the peripheral blood was monitored every 14 days via flow cytometry and is displayed as fraction of CD5+CD19+ CLL cells in all CD45+ leukocytes (tLyn−/− n = 7; chLyn−/− n = 10; Lynwt/wt n = 8; mean ± SEM; two-sided Mann-Whitney test: Week 4 Lynwt/wt vs. chLyn−/− p = 0.02499, Week 4 Lynwt/wt vs. tLyn−/− p = 0.001166, Week 6 Lynwt/wt vs. tLyn−/− p = 0.002165, Week 8 Lynwt/wt vs. tLyn−/− p = 0.035714). c Kaplan-Meier curve illustrating the survival of chimeric recipient mice after CLL adoptive transfer (tLyn−/− n = 6; chLyn−/− n = 11; Lynwt/wt n = 8; Mantel-Cox log-rank test: Lynwt/wt vs. chLyn−/− p = 0.0119, Lynwt/wt vs. tLyn−/− p = 0.0021, chLyn−/− vs. tLyn−/− p = 0.4707). d Representative images of Hyperion Imaging Mass Cytometry of a healthy control lymph node (HC-LN) (top) and a CLL-LN (bottom). (Left) False color image (middle) result of cell-type segmentation (right) segmented fibroblasts color-coded by mean LYN intensity (bars represent 50 µm, representative of total n = 9 HC-LN and n = 12 CLL-LN). e Violin plot for mean LYN expression per segmented single cell (Healthy controls: n = 9 HC-LN (3272 endothelial cells; 6466 fibroblasts); CLL: n = 12 CLL-LN (1817 endothelial cells; 7543 fibroblasts); boxplots represent median with the interquartile range, whiskers indicate adjacent values, violin represents kernel density estimation, independent two-sided t-tests: endothelial p = 7.380e−41, fibroblasts p = 2.942e−170). See also Fig. S1. Source data are provided as a Source Data file.
Fig. 2
Fig. 2. LYN kinase in fibroblasts supported primary CLL cell survival in vitro.
a, Illustration of the different in vitro co-culture systems: Primary human CLL samples were isolated from the peripheral blood of CLL patients. LYN proficient and deficient stromal feeder cells were either isolated from MEF of Lynwt/wt and Lyn−/− mice or generated in human BMSC lines via CRISPR/Cas9. Leukemic and stromal cells were co-cultured, and CLL viability (defined as proportion of Annexin V-/7AAD cells of all CD45+ cells) was measured over time by flow cytometry. Illustration was created with BioRender.com. b Lynwt/wt and Lyn−/− MEF (n = 2 clones per genotype) were used in co-culture with primary human CLL samples (n = 3). Depicted is the CLL viability over time (mean ± SEM; two-sided Mann-Whitney test for Lynwt/wt vs. Lyn−/− at each time point: 24 h–72 h p = 0.002165). c, d LYNWT and LYNKO HS-5 single-cell clones (SCC) were used in co-culture with CLL cells. (CLL n = 19; 2 clones per HS-5 genotype). c illustrates CLL viability over time (mean ± SEM; two-sided Mann-Whitney test for LYNWT vs. LYNKO at each time point: 72 h p = 0.003056; 96 h p = 0.013878) and (d) highlights individual sample viability after 72 h of co-culture (single representative HS-5 clone per genotype; bars represent mean viability; two-tailed Wilcoxon rank test: in all tests p < 0.0001). e, f LYNWT and LYNKO NKtert Cas9 SCCs were used for co-culture assays with CLL cells. (CLL n = 10; LYNWT 1 clone, LYNKO 5 clones). e illustrates CLL viability over time (mean ± SEM; two-sided Mann-Whitney test for LYNWT vs. LYNKO at each time point: 72 h p = 0.049609) and (f) highlights individual sample viability after 48 h of co-culture (from 8 CLL patients; LYNWT: 1 clone; LYNKO: every circle represents mean viability on 5 distinct LYNKO clones; bars represent mean viability; Wilcoxon rank test: in all tests p = 0.0078). See also Fig. S1. Source data are provided as a Source Data file.
Fig. 3
Fig. 3. Integrative multi-omics analysis identified a transcriptionally altered fibroblast polarization in LYN-deficient cells perturbating predominantly cytokine- and matrix related pathways.
a Multi-omics profiling. Illustration was created with BioRender.com. b Spearman rank correlation analysis between T and S/P. Commonly expressed genes/proteins (52 in total) with absolute log2-FC > 0.8 were selected. c Integrative Reactome-Pathway Enrichment analysis. Weighted Voronoi Treemap (top) represents a hierarchal visualization of enriched top-level pathways (defined by single colors) enclosing sub-level pathways with the annotation of each enriched “omics”-layer. The proportional area matches the frequency and weight of this region per total. Grayscale plots (bottom) show statistical significance (FDR calculated by clusterProfiler) for each sub-level pathway per “omics”-layer. d Heatmap of enriched GO-Terms independently performed per “omics”-layer, common terms displaying statistical significance (−log10 q value calculated by clusterProfiler) are depicted. GO-terms are colored according to top-level pathways in (c). Bar plots represent total number of genes contributing to the enriched term (green: Molecular Function; gray: Biological Process). e Network visualization of Reactome-enrichment results: (i) Enrichment map of the top deregulated pathways in T, Tc, P, S. Each node represents one Reactome-Term, the circle colors indicate “omics”-layers in which the pathway was deregulated, circle size represents DEG number within this term. Edges represent shared genes between nodes, generated by clusterProfiler. Domain annotation was added manually. (ii) STRING protein association network contributing to “ECM organization” Reactome-Pathway. Every node is divided in four segments (representing T, Tc, P, S) colored by the gene/protein log2-FC value. Gray color indicates missing values, asterisks indicate significant differentially expression in the respective layer (specified in Methods). Well-defined clusters of different ECM protein families were manually annotated. Only proteins with interaction score ≥ 0.9 are shown. f Gene Set Enrichment Analysis (GSEA) in T and Tc. Normalized enrichment scores (NES) of enriched genesets from the Hallmark Molecular Signatures Database are depicted. Colors represent “omics”-layers, dot size represents statistical significance as -log2 of adjusted p value (specified in Methods) of enriched terms. Genesets with negative NES were enriched in LYNWT, positive NES enriched in LYNKO clones. See also Fig. S2. Source data are provided as a Source Data file.
Fig. 4
Fig. 4. LYN deletion disturbed the CAF-like phenotype and associated polarization in stromal cells by diminishing inflammatory features and enhancing typical myofibroblastic functions.
a Heatmap of a curated list of genes associated with CAF phenotype. Fold changes (log2-FC) from “omics”-layers are depicted. Red and blue color represent log2-FC of genes in LYNWT and LYNKO clones, respectively. Individual layers, where a gene was not detected, are gray. Genes were grouped by their cellular compartment and asterisks indicate “omics”-layers where genes were significantly differentially expressed (specified in Methods). b Transcriptional levels of CAF markers according to Biffi et al. in different LYNWT and LYNKO cells (i: HS-5, ii: NKtert, iii/iv: two imCAF lines) determined by qRT-PCR. (HS-5: 3 SCC per genotype; NKtert: 1 LYNWT SCC vs. 2 LYNKO SCC; imCAF#1: 2 polyclones per genotype, imCAF#2: 1 LYNWT vs. 2 LYNKO polyclones). c Immunoblot of LYNWT or LYNKO imCAF#1 and imCAF#2 for selected CAF markers. (i) and (ii) were prepared from the same lysates. d Immunoblot of LYNWT or LYNKO HS-5 cells (3 clones per genotype, untreated or stimulated with 10 ng/ml TGFβ for 24 h) for selected CAF markers. e (i) Bright field (left) and immunofluorescence microscopy (right) for phalloidin and Hoechst showing morphology of LYNKO cells under normal culture conditions. (ii) Quantification of FSC and SSC of HS-5 LYNWT and LYNKO (mean ± SEM, 3 clones per genotype). f Migration of HS-5 cells in a scratch assay. The scratch area relative to the maximal value was measured every 20 min by live cell microscopy for HS-5 LYNWT (1 clone) and LYNKO (3 clones) in independent triplicates (mean ± SD) (i). Area Under the Curve (mean ± SD; Mann-Whitney test p = 0.0044) (ii). g LYNWT and LYNKO HS-5 cells were treated for 24 h with kinase inhibitors (1 µM dasatinib, 5 µM bosutinib, 5 µM saracatinib), mRNA levels of PDGFRB and FAP were assessed by qRT-PCR (2 SCC per genotype). In all qRT-PCR gene expression was normalized to PPIA. Depicted are means (± SEM where applicable) from the indicated number of clones per genotype. See also Fig. S3. Source data are provided as a Source Data file.
Fig. 5
Fig. 5. Diminished CLL support upon LYN deletion is not related to changes in cytokine secretion.
a CLL cells (n = 5) were cultured with HS-5 (1 clone per genotype) (middle) or MEF (CLL: n = 4; MEF: 1 clone per genotype) (right) in direct contact or separated by a 0.4 µm pore-sized transwell membrane. (mean ± SEM; Uncorrected Fisher’s LSD test for LYNWT vs. LYNKO: 48 h direct p = 0.0028; 72 h direct p = 0.0004; 96 h direct p = 0.0003). b CLL (n = 3) were cultured for 72 h in HS-5 cell conditioned medium (3 clones per genotype) (middle):, without feeder cells vs. direct contact to LYNWT p = 0.0032, with CM from LYNWT vs. direct contact to LYNWT p = 0.0156, with CM from LYNKO vs. direct contact to LYNWT p = 0.0201) or 48 h in NKtert cell conditioned medium (right) (CLL: n = 5, NKtert: 1 clone per genotype, without feeder cells vs. CM from LYNWT p = 0.0044), (mean ± SEM; two-sided Uncorrected Dunn’s test). c, Healthy PBMC (n = 4) were cultured for 72 h alone, in direct contact or with conditioned medium from LYNWT/LYNKO HS-5 cells. MFI of activation markers on CD3+CD4+ or CD3+CD8+ cells were normalized to cells cultured alone (mean ± SEM; two-sided Mann-Whitney test against LYNWT conditions: for all tests p = 0.028571). d CFSE-labeled CLL cells (n = 2) were co-cultured with LYNWT or LYNKO HS-5 cells for 48 h, images were taken after rigorous washing (i). Adhesion Index depicts CFSE+ CD45+ CLL cells per CFSE- HS-5 cells (ii) (3 clones per genotype, mean ± SEM, two-sided Mann-Whitney test p = 0.0022). e Heatmap depicting expression fold change from HS-5 T and Tc data, and flow cytometry (Fc) of HS-5 and imCAF#2 cells. Color depicts log2-FC (LYNKO/LYNWT) of gene expression/MFI respectively, asterisks indicate statistical significance specified for each dataset). f–h MFI for (f) LFA1, (g) ICAM1 and (h) VCAM1 in HS-5 (left, 3 clones per genotype) and imCAF#2 (right, 1 LYNWT clone vs. 2 LYNKO clones) cells (mean ± SD, two-sided Welch’s t-test p = 0.0308). Illustration was created with BioRender.com. Source data are provided as a Source Data file.
Fig. 6
Fig. 6. LYN-dependent regulation of the ECM proteins like Thrombospondin-1 (THBS1) in stromal cells supported the viability of CLL cells.
a CLL cells (n = 8) were cultured on decellularized ECM from LYNWT and LYNKO HS-5 cells for 48 h. (i) illustration, (ii) CLL viability as Annexin V/7AAD per CD45+ cells. (mean, two-sided Wilcoxon test, p = 0.0078). b Immunoblot of BGN in LYNWT and LYNKO HS-5 cells (1 sample each). c HS-5 cells were transfected with siBGN or control siRNA (15 nM), CLL (n = 9) were co-cultured for 96 h (mean, two-sided Uncorrected Dunn’s test: without feeder vs. siCT p < 0.0001; without feeder vs. siBGN p = 0.0339; siCT vs. siBGN p = 0.0339). d–f THBS1 expression in HS-5 cells. d qRT-PCR analysis normalized to PPIA. e Immunoblot for THBS1. f Soluble THBS1 measured by ELISA (d: 2 clones per genotype, e, f: 3 clones per genotype; mean ± SEM; unpaired two-sided t-test: p = 0256). g CLL cells (n = 8) were cultured with recombinant human THBS1 and viability was assessed after 24 h (mean, two-sided Wilcoxon test compared to untreated, p = 0.0391). h THBS1-overexpressing and Mock HS-5 cells were cultured with CLL cells (n = 15, 1 clone per condition), (mean ± SEM; two-sided Wilcoxon test for Mock- vs. THBS1-overexpressing: 24 h p = 0.005371, 48 h p = 0.000366, 72 h p = 0.000427, 96 h p = 0.003906). i CLL cells (n = 6) were co-cultured with THBS1 knockdown-LYNKO or control HS-5 cells for 72 h (mean, two-sided Wilcoxon test p = 0.0312). j CLL cells (n = 10) were co-cultured with antibody-pretreated HS-5 cells for 48 h. (i) illustration, (ii) CLL cell viability was quantified by flow cytometry (mean, two-sided Wilcoxon test p = 0.0469). k Violin plot for mean THBS1 expression per segmented single cell in Imaging Mass Cytometry (Fig. 1d). HC-LN: n = 9 (6466 fibroblasts), CLL-LN: n = 12 (7543 fibroblasts). Boxplots represent median with the interquartile range, whiskers indicate adjacent values, violin represents kernel density estimation, independent two-sided t-tests (p = 1.522e−257). See also Fig. S4. Illustration was created with BioRender.com. Source data are provided as a Source Data file.
Fig. 7
Fig. 7. Inflammatory signaling involving p38 phosphorylation and c-JUN transcriptional activity was perturbated upon LYN deficiency.
a Ingenuity Pathway Analysis (IPA) of Transcriptome (T) and Proteome (P). (i) Predicted upstream regulators with an absolute mean activation Z-score >2 are depicted. Individual T and P “omics”-layers are colored respectively and the circle size determines the number of associated target genes. (ii) Heatmap of the 15 most abundant target genes of the selected upstream regulators, showing gene-regulator associations. b Histogram of flow-cytometric assessment of total (i) and Phospho-T180/Y182 (ii) p38 MAPK expression in unstimulated HS-5 LYNWT and LYNKO cells (1 representative clone per genotype of 3 clones). Dashed curves represent isotype controls, numbers indicate uncorrected MFI. c Diamond plot illustrating homogenous relation between Epigenomic and Transcriptomic changes in HS-5 cells. For the top 50 DEGs (25 genes each with biggest/smallest log2-FC) from HS-5 Transcriptome (T), each diamond represents one related accessible-interval measured in HS-5 ATAC-sequencing data. Y-Axis position of the lowest diamond illustrates log2-FC of the representative gene in HS-5 Transcriptome. Color of each diamond represents log2-FC and size −log10 P value of the respective interval in HS-5 ATAC-Seq data (analysis specified in Methods). Black margin highlights differentially accessible (DA) intervals, yellow margins DA-promoter intervals. Graphical illustration was created with BioRender.com. d Transcription factor footprinting analysis of HS-5 Epigenome. Activity plot showing the distribution of z-transformed activity scores of the underlying motifs (y-axis). On the x-axis the points are distributed randomly. Motifs with differential footprinting (p value ≤ 0.05 and |z-Score | ≥ 1, analysis specified in Methods) are highlighted in red (enriched in LYNKO) or in blue (enriched in LYNWT). e, One-sided Volcano plot of HS-5 Epigenome motif enrichment analysis. X-Axis shows the ratio of foreground (in DA-intervals) vs. background (in all intervals) motif frequency as log2-FC, y-Axis shows the respective adjusted p value (analysis specified in Methods). JUN/FOS-related motifs are highlighted in red. See also Fig. S5. Source data are provided as a Source Data file.
Fig. 8
Fig. 8. Reduced c-JUN expression disinhibited THBS1 expression and suppressed leukemia support in BMSC.
a Immunoblot of total c-JUN protein expression in cytoplasmatic and nuclear fractions of LYNWT and LYNKO HS-5 cells (2 clones per genotype). b Transcriptional expression of JUN in (i) HS-5 (3 clones per genotype), (ii) and NKtert (LYNWT 1 clone, LYNKO 2 clones). Expression was measured by qRT-PCR and normalized to PPIA housekeeping gene expression (mean ± SEM). c HS-5 Cas9 cells were transfected with different crRNA sequences targeting GFP or JUN 5 days before they were co-cultured with primary human CLL cells for additional 48 h. CLL cell viability in co-culture was quantified by flow cytometry as Annexin V-/DAPI- of all CD45+ cells (CLL n = 17; mean; Wilcoxon rank test compared to crGFP: without feeder and crJUN#1 p < 0.0001; crJUN#2 p = 0.0004). d NKtert Cas9 cells were transfected with different crRNA sequences targeting GFP, JUN or non-targeting (NT) 3 days before they were co-cultured with primary human CLL cells for additional 72 h. CLL cell viability in co-culture was quantified by flow cytometry as Annexin V/DAPI of all CD45+ cells (CLL n = 6; mean; two-sided Wilcoxon rank test compared to crNT: in all tests p = 0.0312). e Immunoblot of JUNKO (2 samples with different gRNAs) and control HS-5 (2 independent samples) Cas9 cells showing THBS1 and c-JUN protein expression. JUN knockout-efficiency was calculated to crNT control. f qRT-PCR analysis of relative THBS1 mRNA expression normalized to PPIA housekeeper gene expression of HS-5 Cas9 cells (i) and NKtert Cas9 cells (ii) following CRISPR-mediated JUN knockout (mean, 3 technical replicates). g Immunoblot of LYNWT (one SCC) and LYNKO (2 SCCs) HS-5 cells showing THBS1 and c-JUN protein expression 72 h after transduction with cJUN-N-Flag expressing plasmid or Mock control. See also Fig. S5. Source data are provided as a Source Data file.
Fig. 9
Fig. 9. Graphical summary.
Summary of LYN governing stromal polarization and regulating CLL support. Left: LYN induces transcriptional programming of BMSC via inflammatory regulators (p38, JUN, NFκΒ), promoting an iCAF-like polarization and suppressing THBS1 transcription. Subsequently, related cytokines (IL1, IL6, CCL2, CXCL5, CXCL8, LIF) and surface proteins (FAP, PDGFRβ) are highly expressed and CLL survival is fostered via direct cell contact, exemplarily via the ECM protein BGN. Right: In the absence of LYN, BMSC polarization is transcriptionally reprogrammed (reduced JUN, increased STAT1 expression), resulting in a reduced inflammatory cytokine secretion and diminished expression of iCAF markers. The ECM is remodeled with increased collagen production, and THBS1 expression is disinhibited by the reduced JUN expression. Direct contact to the remodeled ECM restrains CLL survival via enhanced THBS1-CD47 axis. Illustration was created with BioRender.com.

References

    1. Hallek M, Shanafelt TD, Eichhorst B. Chronic lymphocytic leukaemia. Lancet. 2018;391:1524–1537. doi: 10.1016/S0140-6736(18)30422-7. - DOI - PubMed
    1. Nguyen P-H, Niesen E, Hallek M. New roles for B cell receptor associated kinases: when the B cell is not the target. Leukemia. 2019;33:576–587. doi: 10.1038/s41375-018-0366-8. - DOI - PubMed
    1. Ten Hacken E, Burger JA. Microenvironment interactions and B-cell receptor signaling in Chronic Lymphocytic Leukemia: Implications for disease pathogenesis and treatment. Biochim. Biophys. Acta. 2016;1863:401–413. doi: 10.1016/j.bbamcr.2015.07.009. - DOI - PMC - PubMed
    1. Dubois N, et al. Importance of Crosstalk Between Chronic Lymphocytic Leukemia Cells and the Stromal Microenvironment: Direct Contact, Soluble Factors, and Extracellular Vesicles. Front. Oncol. 2020;10:1422. doi: 10.3389/fonc.2020.01422. - DOI - PMC - PubMed
    1. Paggetti J, et al. Exosomes released by chronic lymphocytic leukemia cells induce the transition of stromal cells into cancer-associated fibroblasts. Blood. 2015;126:1106–1117. doi: 10.1182/blood-2014-12-618025. - DOI - PMC - PubMed

Publication types

MeSH terms