. 2023 Mar 11;14(3):190.
doi: 10.1038/s41419-023-05704-4.

Protein dynamics at invadopodia control invasion-migration transitions in melanoma cells

Affiliations

Protein dynamics at invadopodia control invasion-migration transitions in melanoma cells

Marlène Legrand et al. Cell Death Dis. .

Abstract

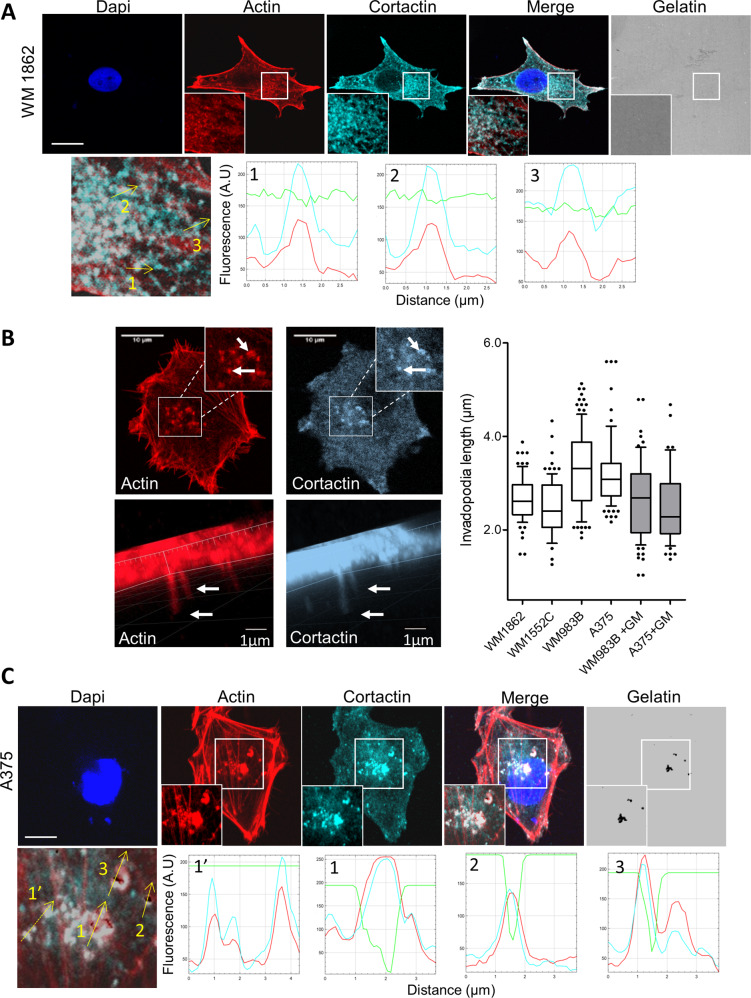
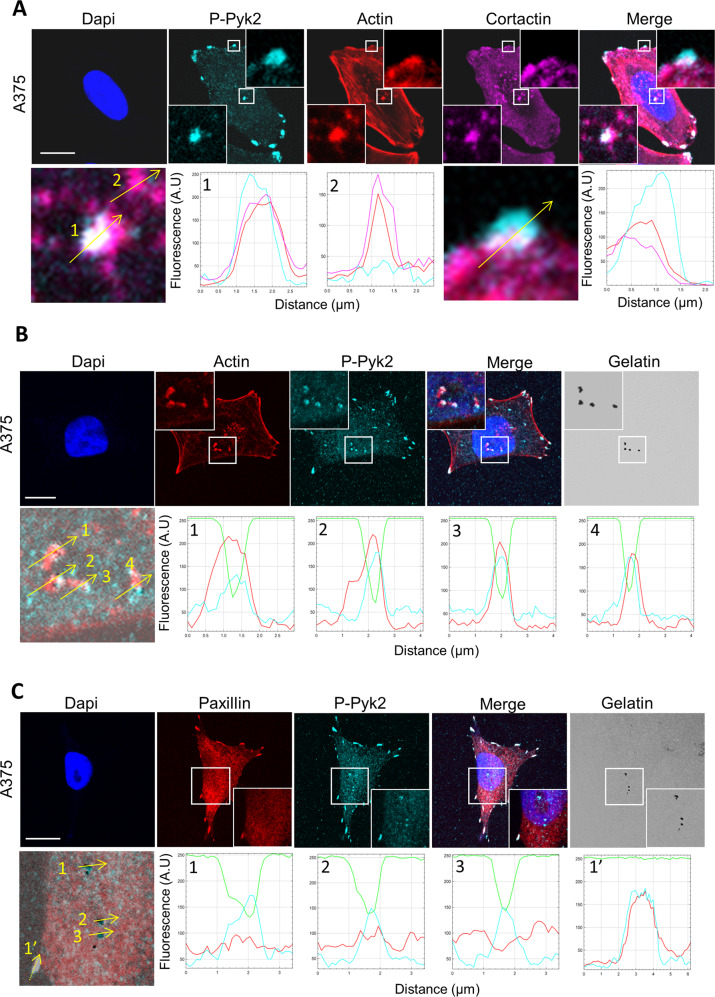
Cell invasion is a highly complex process that requires the coordination of cell migration and degradation of the extracellular matrix. In melanoma cells, as in many highly invasive cancer cell types these processes are driven by the regulated formation of adhesives structures such as focal adhesions and invasive structures like invadopodia. Structurally, focal adhesion and invadopodia are quite distinct, yet they share many protein constituents. However, quantitative understanding of the interaction of invadopodia with focal adhesion is lacking, and how invadopodia turn-over is associated with invasion-migration transition cycles remains unknown. In this study, we investigated the role of Pyk2, cortactin and Tks5 in invadopodia turnover and their relation with focal adhesions. We found that active Pyk2 and cortactin are localised at both focal adhesions and invadopodia. At invadopodia, localisation of active Pyk2 is correlated with ECM degradation. During invadopodia disassembly, Pyk2 and cortactin but not Tks5 are often relocated at nearby nascent adhesions. We also show that during ECM degradation, cell migration is reduced which is likely related to the sharing of common molecules within the two structures. Finally, we found that the dual FAK/Pyk2 inhibitor PF-431396 inhibits both focal adhesion and invadopodia activities thereby reducing both migration and ECM degradation.


Conflict of interest statement

The authors declare no competing interests.

Figures

Fig. 1
Fig. 1. Actin and Cortactin labelled both active and inactive invadopodia.
A In situ melanoma WM1832 cells were plated on FITC-Gelatin (Grey), fixed, stained with Hoechst and labelled for actin (Red) and cortactin (Cyan). Boxed regions and insets depict invadopodia. Graphs indicate fluorescent intensity in arbitrary units (A.U.) of F-actin (red), Cortactin (Cyan) with respect to Gelatin (green) over the indicated line scan in the inset. Note the colocalisation of actin and cortactin in dot-like structure and the absence of degradation area. Scale bar: 10 µm. B XY (top, left) confocal images of in situ melanoma WM1552 showing invadopodia (insets, white arrows) as identified by dot-like F-actin (Red) and cortactin (Cyan) colocalisation. XZ (bottom, left) images of invadopodia projecting into a collagen/gelatin matrix plated in the top chamber of a 1-μm transwell filter. Histograms represents mean invadopodia length and whiskers with 10–90 percentile with 54–117 invadopodia from 27 to 56 cells analysed per condition. C Metastatic melanoma A375 cells were plated on FITC-Gelatin (Grey), fixed, stained with Hoechst and labelled for actin (Red) and cortactin (Cyan). Boxed regions and insets depict invadopodia (White) and degradation areas were identified as black holes on fluorescent gelatin. Graphs indicate fluorescent intensity in arbitrary units (A.U.) of Actin (red), Cortactin (Cyan) with respect to Gelatin (green) over the indicated line scan in the inset. Dotted line indicates inactive invadopodia whereas straight lines indicate active invadopodia. Note that co-localisation of actin and cortactin in dot-like structure label both active and inactive invadopodia. Scale bar: 10 µm. The mean number of invadopodia/cell was calculated for 57 WM1862 and 123 A375 cells.
Fig. 2
Fig. 2. P-Pyk2 is expressed at both focal adhesion and invadopodia.
A Metastatic melanoma A375 melanoma cells were fixed stained with Dapi and labelled for P-Pyk2 (Cyan) actin (Red) and cortactin (Magenta). Boxed regions and insets depict focal adhesion (top, white) and typical dot-like invadopodia (bottom white). Graphs indicate fluorescent intensity in arbitrary units (A.U.) of P-Pyk2 (Cyan), actin (red) and cortactin (Magenta) over the indicated line scan in the inset at invadopodia (left) and focal adhesion (right). Note high level of P-Pyk2 in only one of the two invadopodia selected. Note also high level of P-Pyk2 at focal adhesion. Scale bar: 10 µm. B Metastatic melanoma A375 cells were plated on FITC-Gelatin (Grey), fixed, stained with Hoechst and labelled for actin (Red) and P-Pyk2 (Cyan). Boxed regions and insets depict invadopodia (White) and degradation areas were identified as black holes on fluorescent gelatin. Graphs indicate fluorescent intensity in arbitrary units (A.U.) of actin (red), P-Pyk2 (Cyan) with respect to gelatin (green) over the indicated line scan in the inset. Note that all active invadopodia present high level of both actin and P-Pyk2. Scale bar: 10 µm. C Metastatic melanoma A375 cells were plated on FITC-Gelatin (Grey), fixed, stained with Hoechst and labelled for paxillin (Red) and P-Pyk2 (Cyan). Boxed regions and insets depict invadopodia and focal adhesion (White). Degradation areas were identified as black holes on fluorescent gelatin. Graphs indicate fluorescent intensity in arbitrary units (A.U.) of paxillin (red), P-Pyk2 (Cyan) with respect to gelatin (green) over the indicated line scan in the inset. Note that all active invadopodia (straight lines) present high level of P-Pyk2 but background level of paxillin whereas focal adhesions (dotted line) present high level of both paxillin and P-Pyk2 but no degradation. Scale bar: 10 µm.
Fig. 3
Fig. 3. P-Pyk2 localisation at invadopodia correlates with matrix degradation.
A In situ and metastatic melanoma cells were plated on FITC-Gelatin (Grey), fixed, and labelled for actin (Red) cortactin (Magenta) and P-Pyk2 (Cyan). Boxed regions and insets depict invadopodia (White) and degradation areas were identified as black holes on fluorescent gelatin. Note the presence of P-Pyk2 at focal adhesions but also in a subset of invadopodia from metastatic melanoma cells. Note the presence of “active invadopodia” defined as colocalisation of actin/cortactin spots with degradation areas whereas inactive invadopodia are defined as actin/cortactin spots without underneath degradation. Scale bar: 10 µm. B Histograms represents mean and whiskers with 10–90 percentile of the ratio P-Pyk2 signal at invadopodia over P-Pyk2 signal in the whole cell calculated for each active (0–256, in red) and inactive invadopodia (79–569, in grey) from at least 10 cells per cell type from 3 independent experiments; ***P < 0.001; ANOVA followed by Tukey’s Multiple Comparison for active versus inactive conditions.
Fig. 4
Fig. 4. Time-lapse imaging of Cortactin-dsRed revealed biphasic Cortactin appearance at active invadopodia.
A Dual time-lapse images of Cortactin-dsRed and Cy3-Gelatin were taken every 15 min for 24 h; representative images are shown every 30 min. Insets show magnified views of active invadopodia in the cortactin channel (white arrows) and the gelatin channel (black arrows) Scale bar: 10 µm. B Graphs indicate fluorescent intensity in arbitrary units (A.U.) of Cortactin-dsRed (Red), and Cy3-gelatin (black) over the indicated yellow line scan in the inset at t = 60, 120 and 390 min. Note high fluorescence intensity of Cortactin-dsRed (left) at invadopodia before degradation (t = 60), a second increase in fluorescence intensity after degradation (t = 120) and the return to background levels after degradation (t = 390). Right graph represents the mean intensity of Cortactin-dsRed and Cy3-gelatin fluorescence over time of this example. Bottom graph represents the mean F/Fmax intensity ± SEM of Cortactin-dsRed and F/Fmin intensity ± SEM of FITC-gelatin over time from 30 invadopodia. For each invadopodia, T = 0 was defined as the maximal fluorescence intensity of cortactin.
Fig. 5
Fig. 5. Loss of Cortactin at invadopodia is time-correlated to the formation of focal adhesion-containing Cortactin during migration.
A Dual fluorescent time-lapse images of Cortactin-dsRed and Cy3-Gelatin and bright field images were taken every 15 min for 24 h; representative images are shown. Dot-like cortactin fluorescence appeared at t = 15 min (white arrow) and disappeared at t = 150 min, whereas matrix degradation appeared at t = 60 min (black arrow). Note that the disappearance of cortactin at invadopodia is time-correlated to the appearance of cortactin at focal adhesion (arrowhead) during migration clearly visualised by the movement of the nucleus in the bright field images (yellow arrow) Scale bar: 10 µm. B Graphs indicate fluorescent intensity in arbitrary units (A.U.) of Cortactin-dsRed (Red), and Cy3-gelatin (black) over the indicated line scan in the inset at t = 15, 60 and 150 min. Note high fluorescence intensity of Cortactin-dsRed (left) at invadopodia before degradation (t = 15), and the return to background levels after degradation (t = 150). Graph represents the mean intensity of Cortactin-dsRed at invadopodia and focal adhesion and Cy3-gelatin fluorescence at invadopodia over time. Note the concomitant increase and decrease in cortactin fluorescence at focal adhesion and invadopodia, respectively.
Fig. 6
Fig. 6. Analysis of invadopodia dynamics and protein dynamics at invadopodia.
A375 cells expressing either Cortactin-dsRed (A) or Pyk2-GFP (B) were imaged by dual Epifluorescence/TIRF mode at 1 image/10 s during 1 h. Insets show magnified views of invadopodia (white arrows). One image in epifluorescence (EPI) is shown for each condition to help visualise the cortical location of invadopodia. Note the transformation of dot-like invadopodia into focal complexes (yellow arrowheads) in cells expressing cortactin (A) and Pyk2 (B). Representative time-lapse images are shown from 27 to 37 cells. Graph represent normalised fluorescence intensity over time at invadopodia and nascent adhesions. Scale bar: 10 µm. C Analysis of protein dynamics at invadopodia by FRAP. Left, a typical recovery curve of Tks5-GFP at invadopodia is shown. Middle, box chart represent the mean t1/2 and whiskers the 10–90 percentile from 10 to 35 cells analysed per condition. Right, box chart represent the mean % of recovery and whiskers the 10–90 percentile from 10 to 35 cells analysed per condition.
Fig. 7
Fig. 7. Melanoma displayed deceased migration during invadopodia activity.
A Dual time-lapse images of LifeAct-mCardinal and FITC-Gelatin were taken every 10 min for 24 h; representative images are shown every 10 min. Note the presence of actin spot (t = 0; white arrow) before the degradation activity (t = 10; black arrow) Scale bar: 10 µm. B Box chart represent the mean migration speed of cells and whiskers the 10–90 percentile (n = 45, from 3 independent experiments) before and during invadopodia activity. *P < 0.05; unpaired t test compared to control condition.
Fig. 8
Fig. 8. Effect of the FAK inhibitor PF-573228 and the dual FAK/Pyk2 inhibitor PF-431396 on migration and matrix degradation of melanoma cells.
A Confluent cell layers of A375 cells treated or not with PF-573228 or PF 431396 at 1 µM were wounded and cells were allowed to migrate during 12 h. B A375 melanoma cells lines treated or not with PF-573228 or PF 431396 at 1 µM were plated on Cy3-Gelatin (Grey), fixed, and labelled for actin (Red) and cortactin (Green). Scale bar: 10 µm. C Left, box chart represent the mean migration speed normalised to control of cells and whiskers the 10–90 percentile from at least 3 independent experiments. Right, box chart represent the mean area of degradation (n = 66–118) from 3 independent experiments and whiskers the 10–90 percentile. ***P < 0.001; unpaired t test compared to control condition.

References

    1. Shain AH, Bastian BC. From melanocytes to melanomas. Nat Rev Cancer. 2016;16:345–58. - PubMed
    1. Hoshino D, Branch KM, Weaver AM. Signaling inputs to invadopodia and podosomes. J Cell Sci. 2013;126:2979–89. - PMC - PubMed
    1. Murphy DA, Courtneidge SA. The ‘ins’ and ‘outs’ of podosomes and invadopodia: characteristics, formation and function. Nat Rev Mol Cell Biol. 2011;12:413–26. - PMC - PubMed
    1. Eddy RJ, Weidmann MD, Sharma VP, Condeelis JS. Tumor cell invadopodia: invasive protrusions that orchestrate metastasis. Trends Cell Biol. 2017;27:595–607. - PMC - PubMed
    1. Sharma VP, Eddy R, Entenberg D, Kai M, Gertler FB, Condeelis J. Tks5 and SHIP2 regulate invadopodium maturation, but not initiation, in breast carcinoma cells. Curr Biol. 2013;23:2079–89. - PMC - PubMed

Publication types