. 2023 Feb 21;12(5):683.
doi: 10.3390/cells12050683.

Proliferating Astrocytes in Primary Culture Do Not Depend upon Mitochondrial Respiratory Complex I Activity or Oxidative Phosphorylation

Affiliations

Proliferating Astrocytes in Primary Culture Do Not Depend upon Mitochondrial Respiratory Complex I Activity or Oxidative Phosphorylation

Ellen A Silva et al. Cells. .

Abstract

Understanding the role of astrocytes in the development of the nervous system and neurodegenerative disorders implies a necessary knowledge of the oxidative metabolism of proliferating astrocytes. The electron flux through mitochondrial respiratory complexes and oxidative phosphorylation may impact the growth and viability of these astrocytes. Here, we aimed at assessing to which extent mitochondrial oxidative metabolism is required for astrocyte survival and proliferation. Primary astrocytes from the neonatal mouse cortex were cultured in a physiologically relevant medium with the addition of piericidin A or oligomycin at concentrations that fully inhibit complex I-linked respiration and ATP synthase, respectively. The presence of these mitochondrial inhibitors for up to 6 days in a culture medium elicited only minor effects on astrocyte growth. Moreover, neither the morphology nor the proportion of glial fibrillary acidic protein-positive astrocytes in culture was affected by piericidin A or oligomycin. Metabolic characterization of the astrocytes showed a relevant glycolytic metabolism under basal conditions, despite functional oxidative phosphorylation and large spare respiratory capacity. Our data suggest that astrocytes in primary culture can sustainably proliferate when their energy metabolism relies only on aerobic glycolysis since their growth and survival do not require electron flux through respiratory complex I or oxidative phosphorylation.

Keywords: OXPHOS; astrocytes; bioenergetic; mitochondria; oligomycin; piericidin A.


Conflict of interest statement

The authors declare no conflict of interest.

Figures

Figure 1
Figure 1
Proliferation and viability of astrocytes cultured in media containing different concentrations of energy substrates. Astrocytes were cultured in DMEM containing various concentrations of energy substrates, such as 25 mM glucose, 4 mM glutamine, and 1 mM pyruvate (Medium 1); 5.5 mM glucose, 4 mM glutamine, and 1 mM pyruvate (Medium 2); 5.5 mM glucose, 0.8 mM glutamine, and 0.3 mM pyruvate (Medium 3). Cells were analyzed after one (D1), three (D3), five (D5), and seven (D7) days in culture. (A) Microphotographs of astrocytes at D5 when cultured in Media 1, 2, and 3. (B) Cell viability by trypan blue. (C) ATP content in cultured cells. a.u.: Arbitrary units. (D) Cell viability by MTT. Statistically significant by two-way ANOVA, post-hoc Bonferroni (p < 0.05); “a” compared to D1, “b” compared to D3, and “c” compared to D5 in the same medium. N = 6–7.
Figure 2
Figure 2
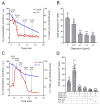
Effect of oligomycin and piericidin A on the oxygen consumption rate (OCR) of astrocytes in suspension. Astrocytes (7.5 × 10⁵/mL) were resuspended in Medium 3 containing 20 mM HEPES-Na+, and OCR was monitored in a high-resolution oxygraph. (A) Representative trace of OCR in suspended astrocytes. As indicated by the arrows, oligomycin (OLIGO) additions were made until reaching the final concentration of 2.0 µg/mL. The oligomycin concentrations in µg/mL achieved after each addition are shown in parentheses. (B) OCR values obtained after sequential additions of oligomycin. *** Statistically different from basal in the absence of oligomycin, by one-way ANOVA, post-hoc Bonferroni, p < 0.001. (C) Representative trace of OCR in suspended astrocytes. As indicated by the arrows, additions of piericidin A were made until reaching a final concentration of 4.0 µM. The piericidin A concentrations in µM achieved after each addition are shown in parentheses. (D) OCR values obtained under basal condition and after additions of 8 µM CCCP, piericidin A (PIERI; 2 and 4 µM) plus rotenone (ROT; 2 µM) or antimycin (AA; 1 µM) as indicated. Statistically different from OCR in the presence of 8 µM CCCP plus 2 µM piericidin A, by Kruskal-Wallis followed by Dunn’s multiple comparisons test, *** p < 0.001.
Figure 3
Figure 3
Effect of oligomycin and piericidin A on the oxygen consumption rate (OCR) of adhered astrocytes. Astrocytes (60,000 cells/well) were plated in a 24-well plate specific for use in the Seahorse XFe24 analyzer and cultured in Medium 3 with DMSO (0.025%, v/v; solvent) or the mitochondrial inhibitors oligomycin (1 µg/mL) and piericidin A (2 µM) present from D1. Cells were evaluated after 48 h (D3) when oligomycin or piericidin A were also added during the runs. (A) Representative trace of OCR of adhered astrocytes treated with DMSO and acutely treated with oligomycin. Where indicated, a bolus addition of 1.0 µg/mL oligomycin (OLIGO) was performed, followed by 1 µM antimycin plus 1 µM rotenone (AA + ROT). (B) Representative trace of OCR of adhered astrocytes treated with DMSO and acutely treated with piericidin A. Where indicated, a bolus addition of 2.0 µM piericidin A (PIERI) was performed, followed by ROT and AA. (C) Representative trace of OCR by adhered astrocytes chronically treated with oligomycin. Where indicated, additions of OLIGO, ROT, and AA were made. (D) Representative trace of OCR by adhered astrocytes chronically treated with piericidin A. Where indicated, additions of PIERI, ROT and AA were made. (E) Antimycin-sensitive OCR values from adhered astrocytes in basal condition, chronically and/or acutely treated with piericidin A and oligomycin. * Statistically significant by two-way ANOVA, post-hoc Bonferroni, compared to Oligomycin (acute). p < 0.05. N = 4.
Figure 4
Figure 4
Proliferation and viability of astrocytes cultured in the presence of mitochondrial inhibitors. Astrocytes were cultured in Medium 3, containing DMSO (0.025%, v/v; solvent), oligomycin (OLIGO; 1 µg/mL), or piericidin A (PIERI; 2 µM) from D1. Cells were analyzed after one (D1), four (D4), and seven (D7) days in culture. (A) Cell viability by trypan blue. (B) ATP content in cultured cells. a.u.: Arbitrary units. (C) Cell viability by MTT. (D) Microphotographs of astrocytes cultured for four days in the presence of DMSO, OLIGO, or PIERI. (E) Percentage (%) of glial fibrillary acidic protein (GFAP)-positive astrocytes within cells cultured in the presence of mitochondrial inhibitors. Cells were analyzed after four days in culture. Statistically significant by two-way ANOVA, post hoc Bonferroni (p < 0.05); “a” compared to D1, “b” compared to D4, * compared to control (DMSO) at the same time point. N = 5–8.
Figure 5
Figure 5
Lactate dehydrogenase (LDH) concentration in the medium after culturing astrocytes with mitochondrial inhibitors. Astrocytes were cultured in Medium 3, containing DMSO (0.025%, v/v; solvent), oligomycin (OLIGO; 1 µg/mL), or piericidin A (PIERI; 2 µM) from day one (D1). The culture media were replaced at days one (D1) and four (D4). Therefore, media for LDH quantification were collected 72 h after medium replacement, thus at D4 (D1 → D4) and/or at D7 (D4 → D7). N = 5–7.
Figure 6
Figure 6
Glucose consumption and lactate released in astrocytes cultured in the presence of mitochondrial inhibitors. Astrocytes were cultured in Medium 3, containing DMSO (0.025%, v/v; solvent), oligomycin (OLIGO; 1 µg/mL), or piericidin A (PIERI; 2 µM) from day one (D1). Culture medium samples for glucose and lactate quantification were collected after 24 h of the addition of mitochondrial inhibitors to cultured astrocytes. For more details, see Section 2. *** Statistically significant by one-way ANOVA and the Bonferroni compared to the respective DMSO condition (p < 0.001). N = 7.

References

    1. Pellerin L., Magistretti P.J. Sweet Sixteen for ANLS. J. Cereb. Blood Flow Metab. 2012;32:1152–1166. doi: 10.1038/jcbfm.2011.149. - DOI - PMC - PubMed
    1. Westergaard N., Sonnewald U., Schousboe A. Metabolic Trafficking between Neurons and Astrocytes: The Glutamate/Glutamine Cycle Revisited. Dev. Neurosci. 1995;17:203–211. doi: 10.1159/000111288. - DOI - PubMed
    1. McKenna M.C. The Glutamate-Glutamine Cycle Is Not Stoichiometric: Fates of Glutamate in Brain. J. Neurosci. Res. 2007;85:3347–3358. doi: 10.1002/jnr.21444. - DOI - PubMed
    1. Brown A.M., Ransom B.R. Astrocyte Glycogen and Brain Energy Metabolism. Glia. 2007;55:1263–1271. doi: 10.1002/glia.20557. - DOI - PubMed
    1. Pellerin L., Magistretti P.J. Glutamate Uptake into Astrocytes Stimulates Aerobic Glycolysis: A Mechanism Coupling Neuronal Activity to Glucose Utilization. Proc. Natl. Acad. Sci. USA. 1994;91:10625–10629. doi: 10.1073/pnas.91.22.10625. - DOI - PMC - PubMed

Publication types

LinkOut - more resources