. 2023 Feb 22;12(5):694.
doi: 10.3390/cells12050694.

Intrahippocampal Inoculation of Aβ1-42 Peptide in Rat as a Model of Alzheimer's Disease Identified MicroRNA-146a-5p as Blood Marker with Anti-Inflammatory Function in Astrocyte Cells

Affiliations

Intrahippocampal Inoculation of Aβ1-42 Peptide in Rat as a Model of Alzheimer's Disease Identified MicroRNA-146a-5p as Blood Marker with Anti-Inflammatory Function in Astrocyte Cells

Ruth Aquino et al. Cells. .

Abstract

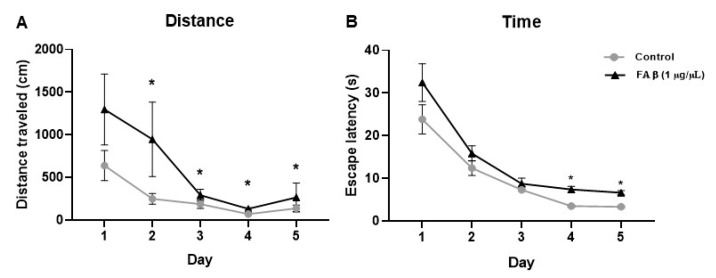
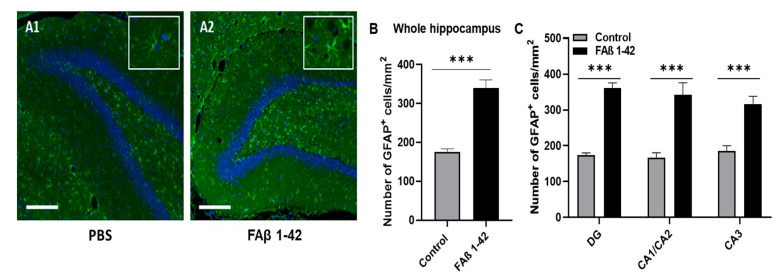
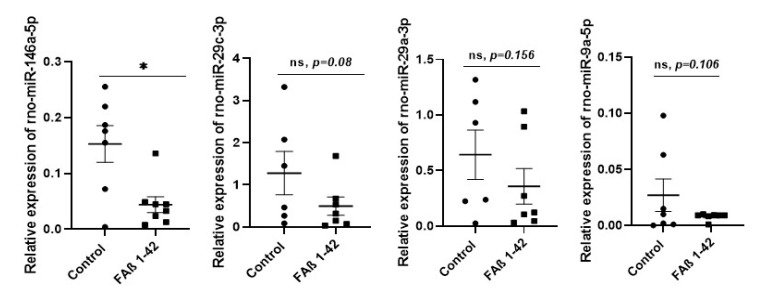
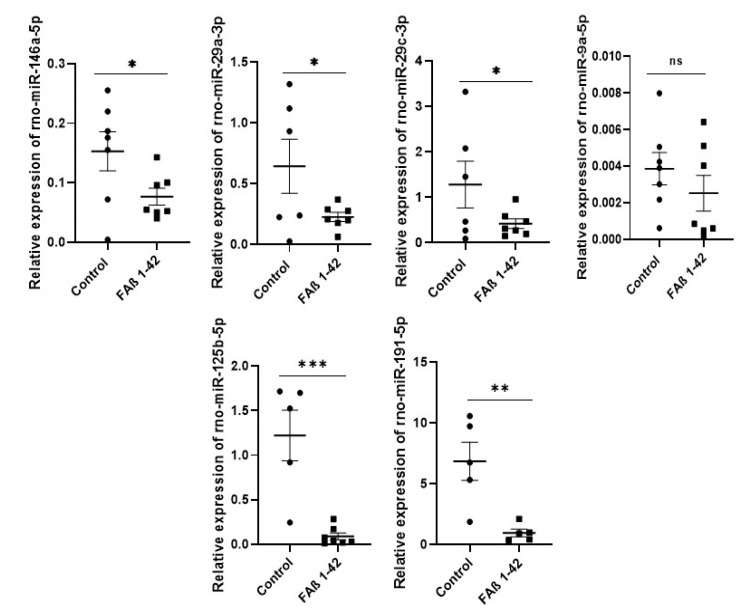
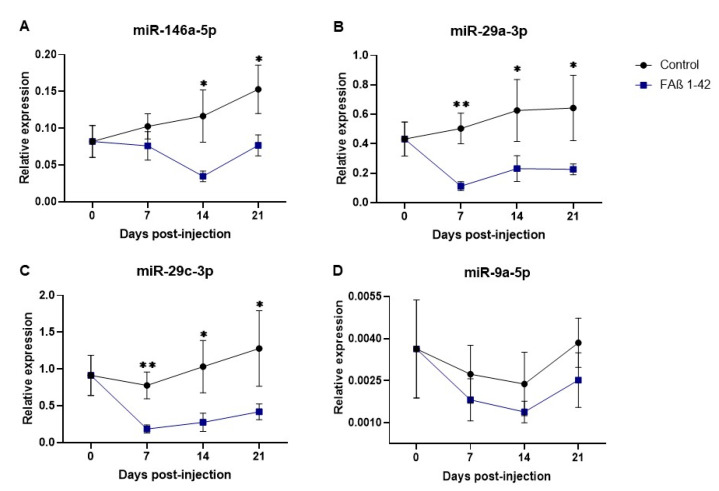
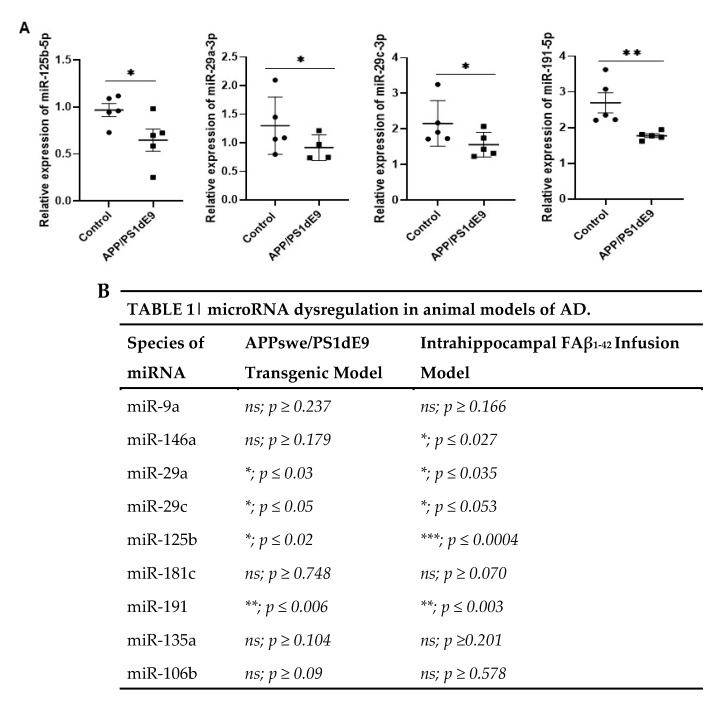
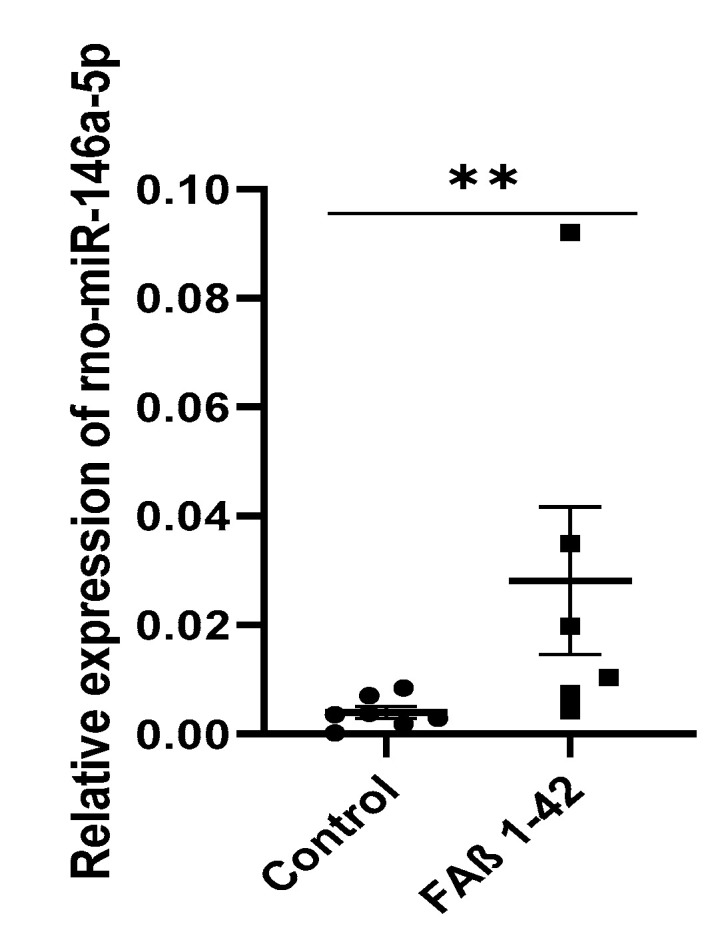
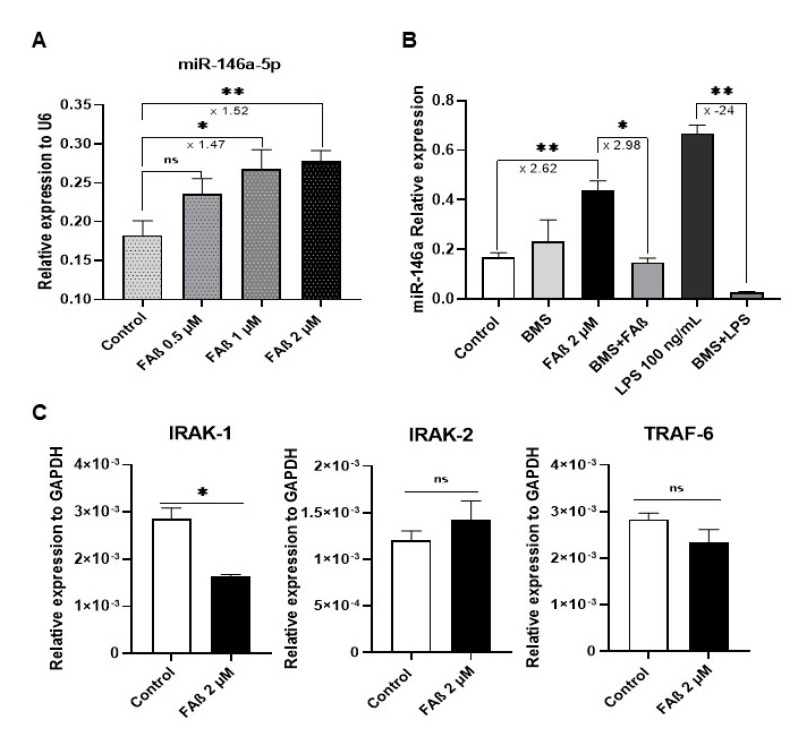
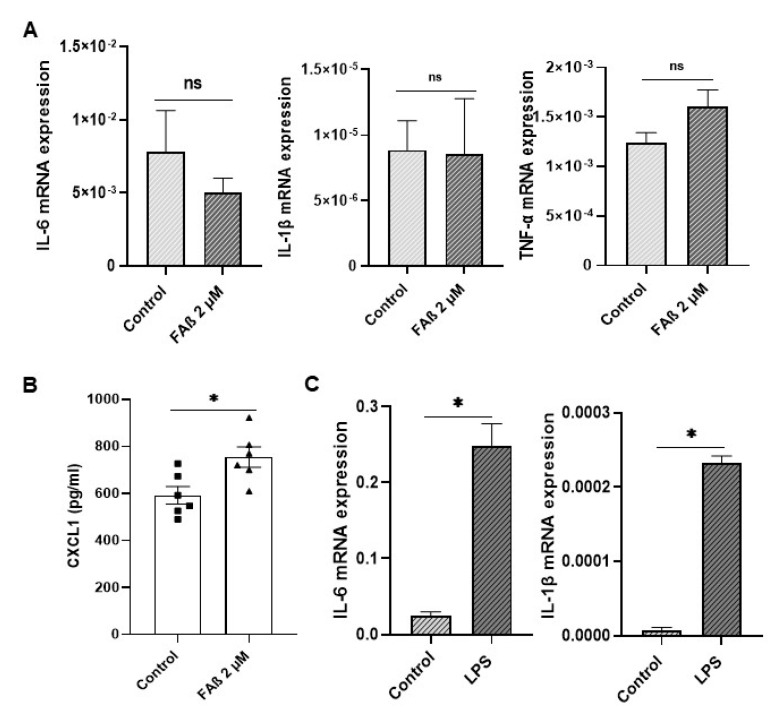
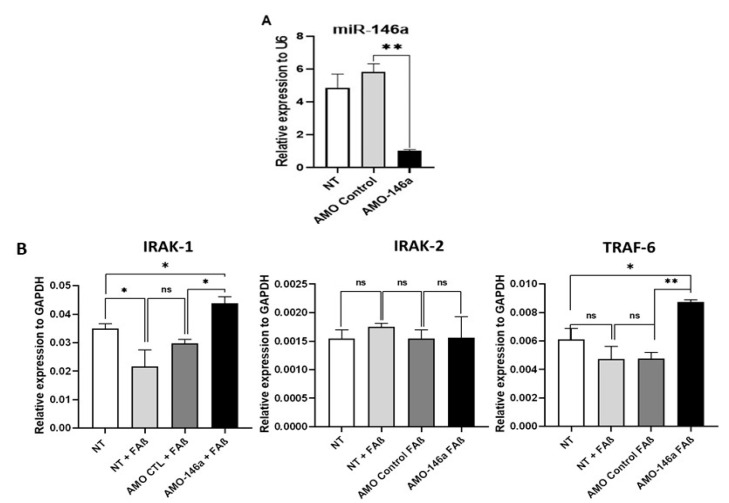
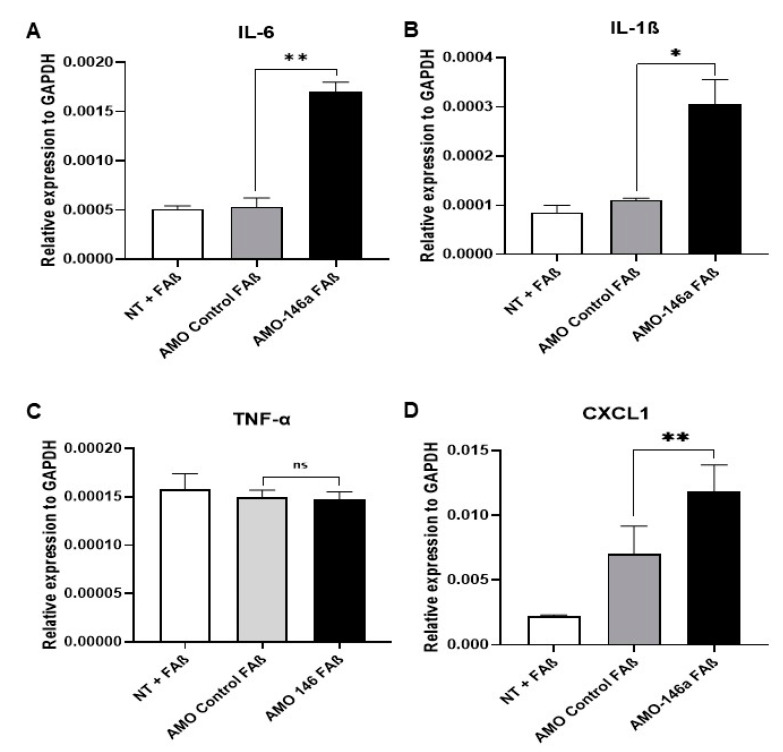
Circulating microRNAs (miRNAs) have aroused a lot of interest as reliable blood diagnostic biomarkers of Alzheimer's disease (AD). Here, we investigated the panel of expressed blood miRNAs in response to aggregated Aβ1-42 peptides infused in the hippocampus of adult rats to mimic events of the early onset of non-familial AD disorder. Aβ1-42 peptides in the hippocampus led to cognitive impairments associated with an astrogliosis and downregulation of circulating miRNA-146a-5p, -29a-3p, -29c-3p, -125b-5p, and-191-5p. We established the kinetics of expression of selected miRNAs and found differences with those detected in the APPswe/PS1dE9 transgenic mouse model. Of note, miRNA-146a-5p was exclusively dysregulated in the Aβ-induced AD model. The treatment of primary astrocytes with Aβ1-42 peptides led to miRNA-146a-5p upregulation though the activation of the NF-κB signaling pathway, which in turn downregulated IRAK-1 but not TRAF-6 expression. As a consequence, no induction of IL-1β, IL-6, or TNF-α was detected. Astrocytes treated with a miRNA-146-5p inhibitor rescued IRAK-1 and changed TRAF-6 steady-state levels that correlated with the induction of IL-6, IL-1β, and CXCL1 production, indicating that miRNA-146a-5p operates anti-inflammatory functions through a NF-κB pathway negative feedback loop. Overall, we report a panel of circulating miRNAs that correlated with Aβ1-42 peptides' presence in the hippocampus and provide mechanistic insights into miRNA-146a-5p biological function in the development of the early stage of sporadic AD.

Keywords: Alzheimer’s disease; Aβ1–42 peptide; biomarkers; diagnosis; miRNA-146a-5p; microRNAs.


Conflict of interest statement

The authors declare no conflict of interest.

Figures

Figure 1
Figure 1
Effects of FAβ1–42 infusion on learning and memory capacity evaluated by the Morris Water Maze (MWM) test. The distance and the escape latency performed by rats (n = 10) injected with FAβ1–42 at a concentration of 1 µg/µL was evaluated at day 14 post-injection. (A) Total distance traveled and (B) Total escape latency used by rats during the 5 days of training. Control group (n = 10) of animals was injected with PBS. Data are represented as mean ± SEM. Statistical comparisons were performed using Kruskal–Wallis. * p ≤ 0.05.
Figure 2
Figure 2
Quantification of GFAP+ astrocytes in the hippocampal areas. Brain sections from rats infused with FAβ1–42 (1 µg/µL) or PBS solutions were analyzed 14 days post-injection. (A1,A2) Representative immunohistochemical staining of GFAP expression (in green) in the DG area. The slides were counterstained with DAPI (blue). Scale bar, 500 µm. The box corresponds to GFAP staining with a higher magnification (B) Histograms showing the number of GFAP + cells per mm2 quantified in the total hippocampus and (C) in each area of the hippocampus (CA1/CA2, CA3 and DG). The quantification of GFAP + cells was analyzed in 4–5 sections per animal (n = 5 for each group). Statistical comparisons between both groups were analyzed using a Student’s t-test. *** p ≤ 0.001.
Figure 3
Figure 3
Relative expression of circulating miRNA-146a-5p, miRNA-29a-3p, miRNA-9a-5p, miRNA-29c-3p in serum samples of rats infused with 1 µg/µL of FAβ1–42 peptides solution. Sera from rats infused with FAβ1–42 peptides (treated group) or PBS (control group) solutions were collected 21 days post-infusion. MiRNA were extracted and quantified by qRT-PCR. Data are represented as mean ± SEM of 7–8 samples evaluated in triplicate. Statistical comparisons between FAβ1–42 and PBS group were performed using the Mann–Whitney test * p ≤ 0.05.
Figure 4
Figure 4
Relative expression of circulating miRNA-146a-5p, miRNA-29a-3p, miRNA-9a-5p, miRNA-29c-3p, miRNA-125b, miRNA-191-5p in serum of rats infused with 2.5 µg/µL of FAβ1–42 peptide solution. Serum samples were collected 21 days post-infusion. MiRNAs were extracted and quantified by qRT-PCR. Data are represented as mean ± SEM of 7–8 samples evaluated in triplicate. Statistical comparisons between FAβ1–42 and PBS group were performed using the Mann–Whitney test. * p ≤ 0.05, ** p ≤ 0.01, *** p ≤ 0.001.
Figure 5
Figure 5
Kinetics of circulating microRNAs detected in the serum of rats infused with FAβ 1–42 peptide solution used at 2.5 µg/µL final concentration. The quantification of miRNAs in serum of rats was investigated at 0, 7, 14, and 21 days post-infusion with FAβ1–42 peptides or with PBS control solutions. Relative expression profiles of (A) miR-146a-5p, (B) miR-29a-3p, (C) miR-29c-3p, and (D) miR-9a-5p quantified by qRT-PCR performed in triplicates and expressed as mean ± SEM (n = 8 rats per group and for each time point). Statistical comparisons between groups at each time were made using the Mann–Whitney test. * p ≤ 0.05, ** p ≤ 0.01.
Figure 6
Figure 6
Relative expression of circulating miRNA-125b-5p, miRNA-29a, miRNA-29c, and miRNA-191-5p in serum of APPswe/PS1dE9 transgenic animal model of AD. (A) Serum samples from transgenic mice at 15 months of age were extracted and processed for miRNA detection by qRT-PCR. Data are represented as mean ± SEM of 5 sera samples performed in triplicate. (B) Table illustrating the statistically significant differences in terms of relative expression of miRNAs between the FAβ1–42-infused animal model (day 21) and the APPswe/PS1dE9 transgenic animal model of AD. Statistical comparisons between the transgenic and control group were performed using the Mann–Whitney test. * p ≤ 0.05, ** p ≤ 0.01, *** p ≤ 0.001.
Figure 7
Figure 7
Relative expression of circulating miRNA-146a-5p in CSF of rats infused with FAβ1–42 peptides solution. CSF samples from rats infused with FAβ (2.5 µg/µL) or PBS solutions were collected at 14 days post-injection. The amount of miR-146-5p was then quantified by qRT-PCR. Data are represented as mean ± SEM of n = 7 samples performed in triplicate. Statistical comparisons between the FAβ-infused and control group were performed using the Mann–Whitney test. ** p ≤ 0.01.
Figure 8
Figure 8
MiRNA-146a-5p is up-regulated in primary astrocytes treated with FAβ1–42 peptides, and its expression is dependent on the NF-κB pathway. (A) Relative expression of miRNA-146a-5p in primary astrocytes was 0.5, 1, and 2 µM of FAβ1–42 peptides for 3 days in tissue culture. (B) Relative expression of miRNA-146a-5p in primary astrocytes as function of treatment with 2 µM of FAβ1–42 solution in the presence of 5 µM of BMS-345541, IκB kinase pharmacology inhibitor. As positive control, cells were treated with LPS (100 ng/mL). (C) Relative expression of IRAK-1/2 and TRAF-6 in astrocytes treated with 2 µM of FAβ1–42 peptides. Data are represented as the mean ± SEM performed in triplicate. Statistical comparisons between FAβ1–42-treated cells and control, DMSO-treated cells were performed with a Student’s t-test. * p ≤ 0.05, ** p ≤ 0.01.
Figure 9
Figure 9
Expression of inflammatory markers in astrocyte cells treated with FAβ1–42 peptides solution. (A) Three days post-stimulation with FAβ solution (2 µM), the expression of IL-6, IL-1β, and TNF-α were quantified by RT-qPCR. (B) CXCL1 was quantified by ELISA. (C) Astrocytes were also stimulated with LPS at 100 ng/mL for 3 days as positive control. Data are represented as mean ± SEM of experiments made in triplicate. Statistical comparisons between groups were made using a Student’s t-test. * p ≤ 0.05.
Figure 10
Figure 10
Transfection of miRNA-146a-5p inhibitor in FAβ1–42-treated astrocyte cells rescues expression of IRAK-1 and TRAF-6 but not IRAK-2. (A) qRT-PCR evaluation of performance of anti-miR-146a oligonucleotides (AMO-146a) to down-regulate expression of miRNA-146a-5p in astrocytes. (B) qRT-PCR evaluation of impact of AMO-146a transfection on expression of transcriptional targets of miRNA-146a-5p in FAβ1–42-astrocyte-treated cells. Cells were first transfected with AMO-146a or AMO-CTL (100 nM), then treated with FAβ1–42 peptides solutions (2 µM) before quantification of the relative expression of IRAK1/2 and TRAF-6 transcriptional targets of miRNA-146a-5p. Non-treated astrocytes (NT, no FAβ1–42 treatment) were used as additional control. Data are represented as mean ± SEM of one representative experiment performed twice in triplicate. Statistical comparisons between groups were made using a Student’s t-test. * p ≤ 0.05, ** p ≤ 0.01.
Figure 11
Figure 11
Transfection of miRNA-146-5p inhibitor in FAβ1–42-treated astrocytes rescues as well promote the expression of pro-inflammatory molecules. Astrocytes were first transfected with AMO-146a or AMO-CTL (100 nM), then treated with FAβ1–42 peptides (2 µM) before quantification relative of the expression of (A) IL-6, (B) IL-1β, (C) TNF-α, and (D) CXCL1 by qRT-PCR. Data are represented as mean ± SEM of one representative experiment performed twice in triplicate. Statistical comparisons between groups were made using a Student’s t-test. * p ≤ 0.05, ** p ≤ 0.01.

References

    1. Prince M., Bryce R., Albanese E., Wimo A., Ribeiro W., Ferri C.P. The global prevalence of dementia: A systematic review and metaanalysis. Alzheimer’s Dement. J. Alzheimer’s Assoc. 2013;9:63–75.e62. doi: 10.1016/j.jalz.2012.11.007. - DOI - PubMed
    1. Mullard A. Alzheimer amyloid hypothesis lives on. Nat. Rev. Drug Discov. 2016;16:3–5. doi: 10.1038/nrd.2016.281. - DOI - PubMed
    1. Selkoe D.J. Alzheimer’s disease: Genes, proteins, and therapy. Physiol. Rev. 2001;81:741–766. doi: 10.1152/physrev.2001.81.2.741. - DOI - PubMed
    1. Bekris L.M., Yu C.E., Bird T.D., Tsuang D.W. Genetics of Alzheimer disease. J. Geriatr. Psychiatry Neurol. 2010;23:213–227. doi: 10.1177/0891988710383571. - DOI - PMC - PubMed
    1. Bateman R.J., Xiong C., Benzinger T.L., Fagan A.M., Goate A., Fox N.C., Marcus D.S., Cairns N.J., Xie X., Blazey T.M., et al. Clinical and biomarker changes in dominantly inherited Alzheimer’s disease. N. Engl. J. Med. 2012;367:795–804. doi: 10.1056/NEJMoa1202753. - DOI - PMC - PubMed

Publication types