. 2023 Feb 24;12(5):723.
doi: 10.3390/cells12050723.

Blocking Store-Operated Ca2+ Entry to Protect HL-1 Cardiomyocytes from Epirubicin-Induced Cardiotoxicity

Affiliations

Blocking Store-Operated Ca2+ Entry to Protect HL-1 Cardiomyocytes from Epirubicin-Induced Cardiotoxicity

Xian Liu et al. Cells. .

Abstract

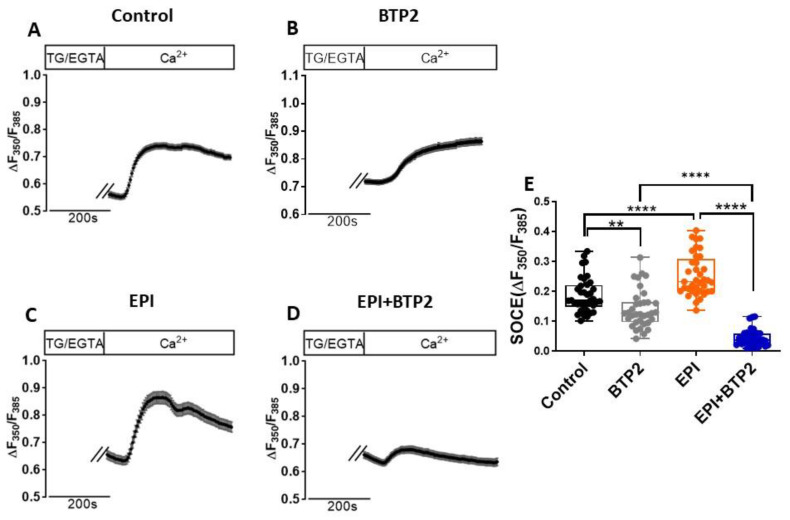
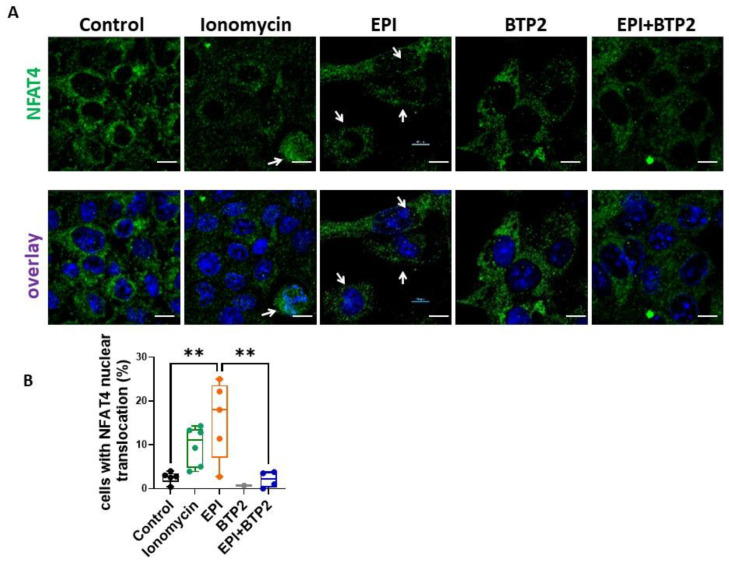
Epirubicin (EPI) is one of the most widely used anthracycline chemotherapy drugs, yet its cardiotoxicity severely limits its clinical application. Altered intracellular Ca2+ homeostasis has been shown to contribute to EPI-induced cell death and hypertrophy in the heart. While store-operated Ca2+ entry (SOCE) has recently been linked with cardiac hypertrophy and heart failure, its role in EPI-induced cardiotoxicity remains unknown. Using a publicly available RNA-seq dataset of human iPSC-derived cardiomyocytes, gene analysis showed that cells treated with 2 µM EPI for 48 h had significantly reduced expression of SOCE machinery genes, e.g., Orai1, Orai3, TRPC3, TRPC4, Stim1, and Stim2. Using HL-1, a cardiomyocyte cell line derived from adult mouse atria, and Fura-2, a ratiometric Ca2+ fluorescent dye, this study confirmed that SOCE was indeed significantly reduced in HL-1 cells treated with EPI for 6 h or longer. However, HL-1 cells presented increased SOCE as well as increased reactive oxygen species (ROS) production at 30 min after EPI treatment. EPI-induced apoptosis was evidenced by disruption of F-actin and increased cleavage of caspase-3 protein. The HL-1 cells that survived to 24 h after EPI treatment demonstrated enlarged cell sizes, up-regulated expression of brain natriuretic peptide (a hypertrophy marker), and increased NFAT4 nuclear translocation. Treatment by BTP2, a known SOCE blocker, decreased the initial EPI-enhanced SOCE, rescued HL-1 cells from EPI-induced apoptosis, and reduced NFAT4 nuclear translocation and hypertrophy. This study suggests that EPI may affect SOCE in two phases: the initial enhancement phase and the following cell compensatory reduction phase. Administration of a SOCE blocker at the initial enhancement phase may protect cardiomyocytes from EPI-induced toxicity and hypertrophy.

Keywords: NFAT4; anthracycline; apoptosis; cardiac hypertrophy; chemotherapy; reactive oxygen species (ROS); store-operated Ca2+ entry (SOCE).


Conflict of interest statement

The authors declare no conflict of interest.

Figures

Figure 1
Figure 1
SOCE machinery genes were downregulated by EPI in cardiomyocytes. (A) RNA-seq data analysis of human iPSC-derived cardiomyocytes treated with 2 µM EPI for 48 h. SOCE machinery genes include Orais, TRPCs, and Stims. (B) Representative traces of intracellular Ca2+ in HL-1 cells treated with vehicle control or 1 µM EPI for 6 h. (C) Statistics of changes in intracellular Ca2+ in HL-1 cells without (0.28 ± 0.085) or with the treatment of EPI (0.02897 ± 0.021). Mean ± SD, n = 10, ****: p < 0.0001 (based on t-test).
Figure 2
Figure 2
Acute treatment of EPI increased SOCE in HL-1 cardiomyocytes. Ratio of fluorescence of fura-2 AM at two excitation wavelengths (F350 nm/F385 nm) was used to monitor changes in intracellular Ca2+ concentration. (AD) Representative traces of intracellular Ca2+ in HL-1 cells treated with vehicle control, 20 µM BTP2, 1 µM EPI, or 20 µM BTP2 plus 1 µM EPI for 30 min. (E) Statistical analysis of SOCE in HL-1 cells. Mean ± SD, n = 35. **: p = 0.0056, ****: p < 0.0001 (based on one-way ANOVA and Bonferroni post hoc analysis).
Figure 3
Figure 3
EPI induced ROS production in HL-1 cardiomyocytes. ROS was measured in HL-1 cells by using DHE dye in control group with only resting cells; 1 µM EPI treatment for 30 min (EPI); 20 µM BTP2 (BTP2) treatment; 1 μM EPI together with 20 µM BTP2 treatment for 30 min (EPI + BTP-2). Quantitative fluorescent intensity (a.u.) from each independent well was showed. n = 6, Mean ± SD. ***: p < 0.001; ****: p < 0.0001. (Based on One Way ANOVA and Bonferroni post hoc analysis).
Figure 4
Figure 4
BTP2 inhibited EPI-induced apoptosis in HL-1 cardiomyocytes. (A) Cell nuclei were stained with DAPI (blue) and F-actin was stained with phalloidin (red). F-actin degradation was observed with 1 µM EPI treatment for 5 h. With 20 µM BTP2 co-treatment, the EPI-induced F-actin disruption was partially rescued. (B) The F-actin fluorescence intensity was quantified. ***: p < 0.001; ****: p < 0.0001 (C) Western blotting analysis of cleaved caspase 3 expression in HL-1 cardiomyocytes. Cells were treated by vehicle (control), 1 µM EPI, 20 µM BTP2, or 1 µM EPI plus 20 µM BTP2 for 5 h followed by normal culture conditions for 24 h. GAPDH was used as loading control. (D) The quantification of cleaved caspase 3 normalized to the expression of GAPDH. Three independent biological replicates were carried out and used for the quantification. ***: EPI vs. Control, p = 0.0009; *: EPI + BTP2 vs. EPI, p = 0.0218 (based on one-way ANOVA and Bonferroni post hoc analysis).
Figure 5
Figure 5
BTP2 inhibited EPI-induced hypertrophy in HL-1 cardiomyocytes. HL-1 cells treated with 1 µM EPI for 5 h followed by fresh media culture for 24 h. (A) Phase contrast images of HL-1 cells treated with 1 µM EPI (EPI), 1 μM EPI together with 20 µM BTP2 (EPI + BTP-2), or vehicle-treated control (control). Scale bar, 50 µm. (B) Quantification of the cell surface area of HL-1 cardiomyocytes. Mean ± SEM, n ≥ 581 per group. ****: p < 0.0001 (based on one-way ANOVA and Bonferroni post hoc analysis). (C) BTP2 reduced hypertrophy marker BNP transcript in HL-1 cardiomyocytes. Quantitative reverse transcription PCR expression levels of BNP were normalized to GAPDH and plotted relative to the level in the vehicle-treated control cells. n = 9, triplicates from three independent experiment. Mean ± SD. ****: p < 0.0001 (based on one-way ANOVA and Bonferroni post hoc analysis).
Figure 6
Figure 6
BTP2 inhibited the EPI-induced nuclear translocation of NFAT4 in HL-1 cardiomyocytes. HL-1 cells were treated with vehicle, 1 µM EPI, 20 µM BTP2, or 1 µM EPI combined with 20 µM BTP2 for 5 h, followed by drug withdrawal and culture for 24 h and stained for NFAT4. Cells treated with 10 µM ionomycin for 15 min were used as positive control. (A) Representative confocal images of NFAT. Scale bar, 10 µm. white arrows indicate the co-localization of NFAT4 and Nuclei (B) Statistical analysis of the percentage of cells with NFAT nuclear translocation. Each dot is an averaged datapoint from a single confocal image. Each image represents one biological replicate. Mean ± SD. **: p < 0.01 (based on one-way ANOVA and Bonferroni post hoc analysis).
Figure 7
Figure 7
Working model. Acute treatment of EPI enhanced SOCE, triggering NFAT4-mediated hypertrophy and caspase3-mediated apoptosis in cardiomyocytes. Both the EPI-induced apoptosis and hypertrophy can be inhibited by blocking SOCE.

References

    1. World Health Organization WHO Model List of Essential Medicines—22nd List. 2021. [(accessed on 30 September 2021)]. Available online: https://www.who.int/publications/i/item/WHO-MHP-HPS-EML-2021.02.
    1. Zamorano J.L., Lancellotti P., Rodriguez Munoz D., Aboyans V., Asteggiano R., Galderisi M., Habib G., Lenihan D.J., Lip G.Y.H., Lyon A.R., et al. 2016 ESC Position Paper on cancer treatments and cardiovascular toxicity developed under the auspices of the ESC Committee for Practice Guidelines: The Task Force for cancer treatments and cardiovascular toxicity of the European Society of Cardiology (ESC) Eur. Heart J. 2016;37:2768–2801. doi: 10.1093/eurheartj/ehw211. - DOI - PubMed
    1. Mitry M.A., Edwards J.G. Doxorubicin induced heart failure: Phenotype and molecular mechanisms. Int. J. Cardiol. Heart Vasc. 2016;10:17–24. doi: 10.1016/j.ijcha.2015.11.004. - DOI - PMC - PubMed
    1. Cardinale D., Colombo A., Lamantia G., Colombo N., Civelli M., De Giacomi G., Rubino M., Veglia F., Fiorentini C., Cipolla C.M. Anthracycline-induced cardiomyopathy: Clinical relevance and response to pharmacologic therapy. J. Am. Coll. Cardiol. 2010;55:213–220. doi: 10.1016/j.jacc.2009.03.095. - DOI - PubMed
    1. Nakamura M., Sadoshima J. Mechanisms of physiological and pathological cardiac hypertrophy. Nat. Rev. Cardiol. 2018;15:387–407. doi: 10.1038/s41569-018-0007-y. - DOI - PubMed

Publication types