. 2023 Feb 24;12(5):733.
doi: 10.3390/cells12050733.

Blocking EREG/GPX4 Sensitizes Head and Neck Cancer to Cetuximab through Ferroptosis Induction

Affiliations

Blocking EREG/GPX4 Sensitizes Head and Neck Cancer to Cetuximab through Ferroptosis Induction

Aude Jehl et al. Cells. .

Abstract

(1) Background: Epiregulin (EREG) is a ligand of EGFR and ErB4 involved in the development and the progression of various cancers including head and neck squamous cell carcinoma (HNSCC). Its overexpression in HNSCC is correlated with short overall survival and progression-free survival but predictive of tumors responding to anti-EGFR therapies. Besides tumor cells, macrophages and cancer-associated fibroblasts shed EREG in the tumor microenvironment to support tumor progression and to promote therapy resistance. Although EREG seems to be an interesting therapeutic target, no study has been conducted so far on the consequences of EREG invalidation regarding the behavior and response of HNSCC to anti-EGFR therapies and, more specifically, to cetuximab (CTX); (2) Methods: EREG was silenced in various HNSCC cell lines. The resulting phenotype (growth, clonogenic survival, apoptosis, metabolism, ferroptosis) was assessed in the absence or presence of CTX. The data were confirmed in patient-derived tumoroids; (3) Results: Here, we show that EREG invalidation sensitizes cells to CTX. This is illustrated by the reduction in cell survival, the alteration of cell metabolism associated with mitochondrial dysfunction and the initiation of ferroptosis characterized by lipid peroxidation, iron accumulation and the loss of GPX4. Combining ferroptosis inducers (RSL3 and metformin) with CTX drastically reduces the survival of HNSCC cells but also HNSCC patient-derived tumoroids; (4) Conclusions: The loss of EREG might be considered in clinical settings as a predictive biomarker for patients that might undergo ferroptosis in response to CTX and that might benefit the most from the combination of ferroptosis inducers and CTX.

Keywords: EREG; autophagy; biomarkers; ferroptosis; head and neck cancers; metabolism; tumoroid.


Conflict of interest statement

The authors declare that they have no known competing financial interests or personal relationships that could have appeared to influence the work reported in this paper.

Figures
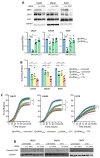
Figure 1
Figure 1
(A) Expression of EREG, EGFR, CAV1 and GAPDH was determined by Western blot in CAL27, CAL33 and SCC9 cells untransfected and transfected with siRNACtrl or siRNAEREG. Histograms represent the mean ± SEM (CAL27 and CAL33 n = 6–11 and SCC9 n = 6–13, with * p < 0.05 and *** p < 0.001) of the protein expression in siRNACtrl- or siRNAEREG-transfected cells normalized with GAPDH. (B) Histograms show the surviving fraction of CAL27, CAL33 and SCC9 cells transfected with siRNACtrl or siRNAEREG and treated with solvent or 30 nM CTX. Data represent the mean ± SEM surviving fraction at day 8 post-transfection and post-treatment (n = 4 with * p < 0.05, ** p < 0.01 and *** p < 0.0001). (C) Curves show the percentage of confluence after normalization to day 0 of CAL27, CAL33 and SCC9 cells transfected with siRNACtrl or siRNA EREG and treated with solvent or 30 nM CTX. Data are represented as the mean ± SEM (small dots) of confluence at 168 h post-transfection and post-treatment (CAL27 and CAL33 n = 4–5 and SCC9 n = 6–5 with * p < 0.05, ** p < 0.01 and *** p < 0.001). (D) Expression of cleaved PARP and GAPDH was determined by Western blot in CAL27, CAL33 and SCC9 cells transfected with siRNACtrl or siRNAEREG and treated with solvent or CTX (30 nM).
Figure 2
Figure 2
(A) Energetic map of CAL27, CAL33 and SCC9 cells transfected with siRNACtrl or siRNA EREG and treated with solvent or 30 nM CTX. Histograms show the ATP production of CAL27, CAL33 and SCC9 cells transfected with siRNACtrl or siRNAEREG and treated with solvent or 30 nM CTX. Data are represented as the mean ± SEM of ATP produced 144 h post-transfection and post-treatment (n = 8–9, with * p < 0.05, ** p < 0.001 and *** p < 0.0001). (B) Expression of ULK-1, Beclin1, LC3B and GAPDH was determined by Western blot in CAL27, CAL33 and SCC9 cells not transfected or transfected with siRNACtrl or siRNAEREG and treated with solvent or 30 nM CTX. Histograms represent the mean ± SEM (CAL27 n = 11, CAL33 n = 9 and SCC9 n = 10, with * p < 0.05, ** p < 0.01 and *** p < 0.001) of the protein expression normalized with GAPDH.
Figure 2
Figure 2
(A) Energetic map of CAL27, CAL33 and SCC9 cells transfected with siRNACtrl or siRNA EREG and treated with solvent or 30 nM CTX. Histograms show the ATP production of CAL27, CAL33 and SCC9 cells transfected with siRNACtrl or siRNAEREG and treated with solvent or 30 nM CTX. Data are represented as the mean ± SEM of ATP produced 144 h post-transfection and post-treatment (n = 8–9, with * p < 0.05, ** p < 0.001 and *** p < 0.0001). (B) Expression of ULK-1, Beclin1, LC3B and GAPDH was determined by Western blot in CAL27, CAL33 and SCC9 cells not transfected or transfected with siRNACtrl or siRNAEREG and treated with solvent or 30 nM CTX. Histograms represent the mean ± SEM (CAL27 n = 11, CAL33 n = 9 and SCC9 n = 10, with * p < 0.05, ** p < 0.01 and *** p < 0.001) of the protein expression normalized with GAPDH.
Figure 3
Figure 3
(A) Histograms showing the levels of intracellular Fe2+ measured in CAL27, CAL33 and SCC9 cells transfected with siRNACtrl or siRNAEREG and treated with solvent or 30 nM CTX. Data are represented as the mean ± SEM of intracellular Fe2+ intensity (n = 8, with * p < 0.05, ** p < 0.001 and *** p < 0.0001). Pictures show (B) the intracellular Fe2+ production (in red, staining of individual CAL27 and SCC9 cells or clustered CAL33) and (C) the lipid peroxidation (in green) acquired by confocal microscopy in CAL27, CAL33 and SCC9 cells transfected with siRNACtrl or siRNAEREG and treated with solvent or 30 nM CTX (scale bar: 100 µm).
Figure 4
Figure 4
Expression of GPX4 and GAPDH (A) and c-Myc and GAPDH (B) was determined by Western blot in CAL27, CAL33 and SCC9 cells untransfected or transfected with siRNACtrl or siRNAEREG and treated with solvent or 30 nM CTX. Histograms represent the mean ± SEM (CAL27 and CAL33 n = 10 and SCC9 n = 9, with * p < 0.05, ** p < 0.01 and *** p < 0.001) of the protein expression normalized with GAPDH. (C) Histograms show the surviving fraction of CAL27, CAL33 and SCC9 cells transfected with siRNACtrl or siRNAEREG and treated with 30 nM CTX, 5 µM RSL3 or a combination of both. Data represent the mean ± SEM surviving fraction at day 8 post-transfection and post-treatment (n = 4, with *** p < 0.0001). (D) Histograms show the surviving fraction of CAL27, CAL33 and SCC9 cells transfected with siRNACtrl or siRNAEREG and treated with 30 nM CTX, 1 mM metformin (METF) or a combination of both. Data represent the mean ± SEM surviving fraction at day 8 post-transfection and post-treatment (n = 4, with ** p < 0.01 and *** p < 0.0001). (E) Expression of GPX4 and GAPDH was determined by Western blot in CAL27 transfected with siRNACtrl or siRNAEREG and treated with 30 nM CTX, 5 µM RSL3 or a combination of both (upper panel) or with 30 nM CTX, 1 mM metformin (METF) or a combination of both (lower panel). Histograms represent the mean ± SEM (n = 4, with * p < 0.05, ** p < 0.01 and *** p < 0.001) of the protein expression normalized with GAPDH.
Figure 5
Figure 5
(A) Patient-derived tumoroids T1 were treated with solvent, 30 nM CTX, 5 µM RSL3, 1 µM metformin (METF), a combination of CTX + RSL3 or CTX + metformin. Pictures were before treatment (left panel) and 7 days after treatment with 4× (middle panel) and 10× (right panel) magnification. (B) Viability was determined after 7 days of the culture. Each bar represents the mean ± SEM of the percentage of viability (n = 3 for T1 and T2, with * p < 0.05, ** p < 0.001, *** p < 0.0001. (C) Expression of GPX4 and GAPDH was determined by Western blot in T1 tumoroids treated with solvent, 30 nM CTX, 5 µM RSL3, 1 µM metformin (METF), a combination of CTX + RSL3 or CTX + metformin. Histograms represent the mean ± SEM (n = 4, with * p < 0.05, ** p < 0.01 and *** p < 0.001) of the protein expression normalized with GAPDH.
Figure 5
Figure 5
(A) Patient-derived tumoroids T1 were treated with solvent, 30 nM CTX, 5 µM RSL3, 1 µM metformin (METF), a combination of CTX + RSL3 or CTX + metformin. Pictures were before treatment (left panel) and 7 days after treatment with 4× (middle panel) and 10× (right panel) magnification. (B) Viability was determined after 7 days of the culture. Each bar represents the mean ± SEM of the percentage of viability (n = 3 for T1 and T2, with * p < 0.05, ** p < 0.001, *** p < 0.0001. (C) Expression of GPX4 and GAPDH was determined by Western blot in T1 tumoroids treated with solvent, 30 nM CTX, 5 µM RSL3, 1 µM metformin (METF), a combination of CTX + RSL3 or CTX + metformin. Histograms represent the mean ± SEM (n = 4, with * p < 0.05, ** p < 0.01 and *** p < 0.001) of the protein expression normalized with GAPDH.

References

    1. Sung H., Ferlay J., Siegel R.L., Laversanne M., Soerjomataram I., Jemal A., Bray F. Global Cancer Statistics 2020: GLOBOCAN Estimates of Incidence and Mortality Worldwide for 36 Cancers in 185 Countries. CA Cancer J. Clin. 2021;71:209–249. doi: 10.3322/caac.21660. - DOI - PubMed
    1. Bonner J.A., Harari P.M., Giralt J., Azarnia N., Shin D.M., Cohen R.B., Jones C.U., Sur R., Raben D., Jassem J., et al. Radiotherapy plus cetuximab for squamous-cell carcinoma of the head and neck. N. Engl. J. Med. 2006;354:567–578. doi: 10.1056/NEJMoa053422. - DOI - PubMed
    1. Bonner J.A., Harari P.M., Giralt J., Cohen R.B., Jones C.U., Sur R.K., Raben D., Baselga J., Spencer S.A., Zhu J., et al. Radiotherapy plus cetuximab for locoregionally advanced head and neck cancer: 5-year survival data from a phase 3 randomised trial, and relation between cetuximab-induced rash and survival. Lancet Oncol. 2010;11:21–28. doi: 10.1016/S1470-2045(09)70311-0. - DOI - PubMed
    1. Goldstein N.I., Prewett M., Zuklys K., Rockwell P., Mendelsohn J. Biological efficacy of a chimeric antibody to the epidermal growth factor receptor in a human tumor xenograft model. Clin. Cancer Res. 1995;1:1311–1318. - PubMed
    1. Masuelli L., Budillon A., Marzocchella L., Mrozek M.A., Vitolo D., Di Gennaro E., Losito S., Sale P., Longo F., Ionna F., et al. Caveolin-1 overexpression is associated with simultaneous abnormal expression of the E-cadherin/alpha-beta catenins complex and multiple ErbB receptors and with lymph nodes metastasis in head and neck squamous cell carcinomas. J. Cell. Physiol. 2012;227:3344–3353. doi: 10.1002/jcp.24034. - DOI - PubMed

Publication types

MeSH terms