. 2023 Feb 24;15(5):1457.
doi: 10.3390/cancers15051457.

Immune Microenvironment in Sporadic Early-Onset versus Average-Onset Colorectal Cancer

Affiliations

Immune Microenvironment in Sporadic Early-Onset versus Average-Onset Colorectal Cancer

Fanny Andric et al. Cancers (Basel). .

Abstract

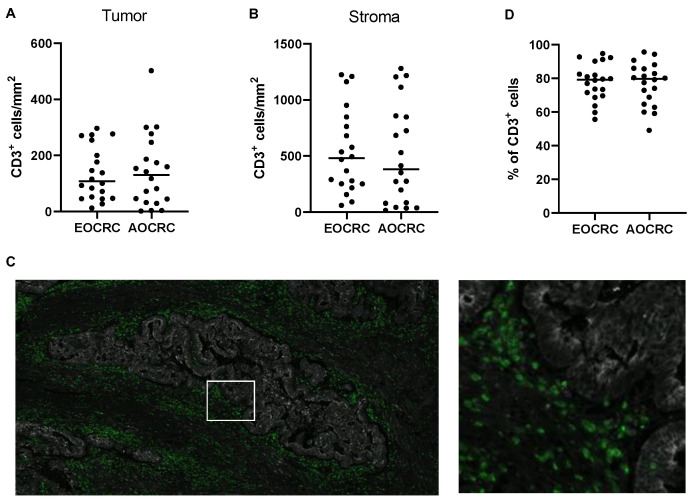
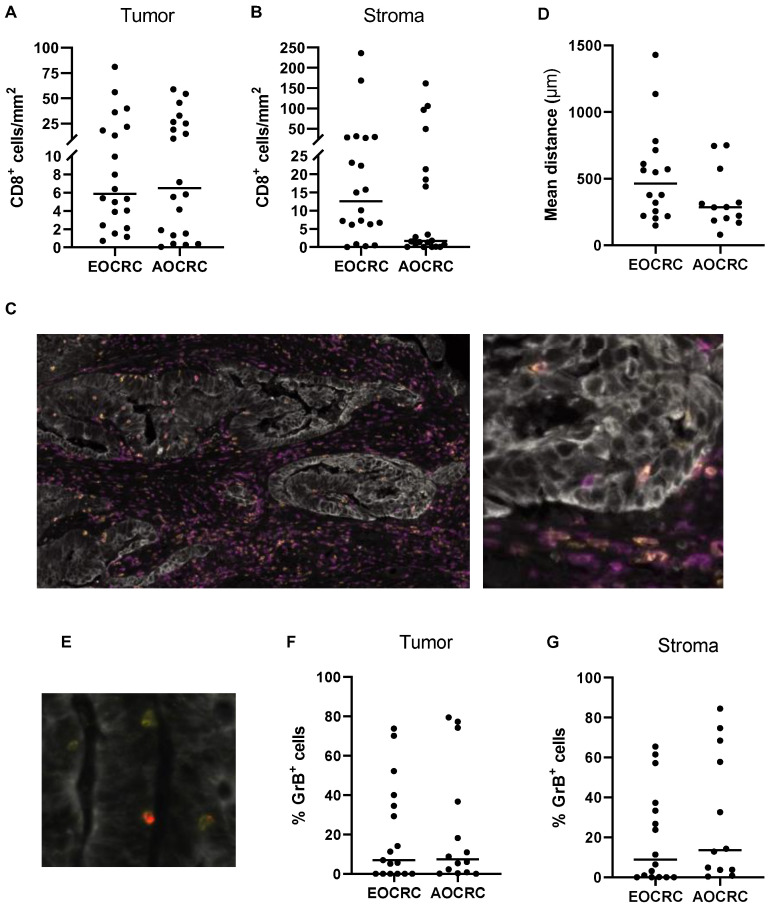
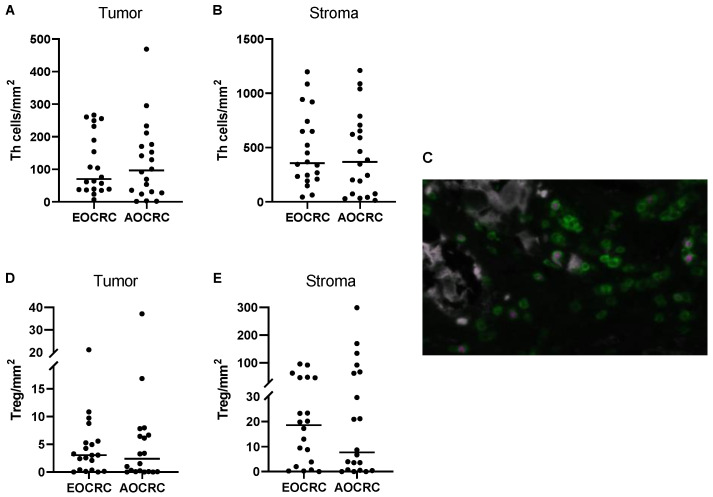
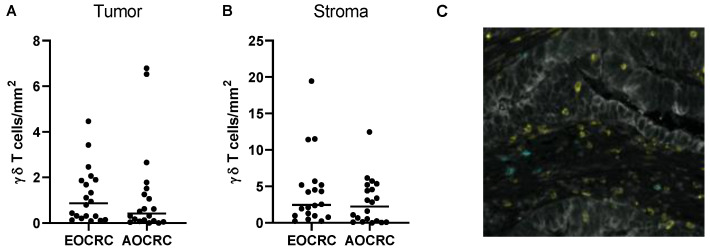
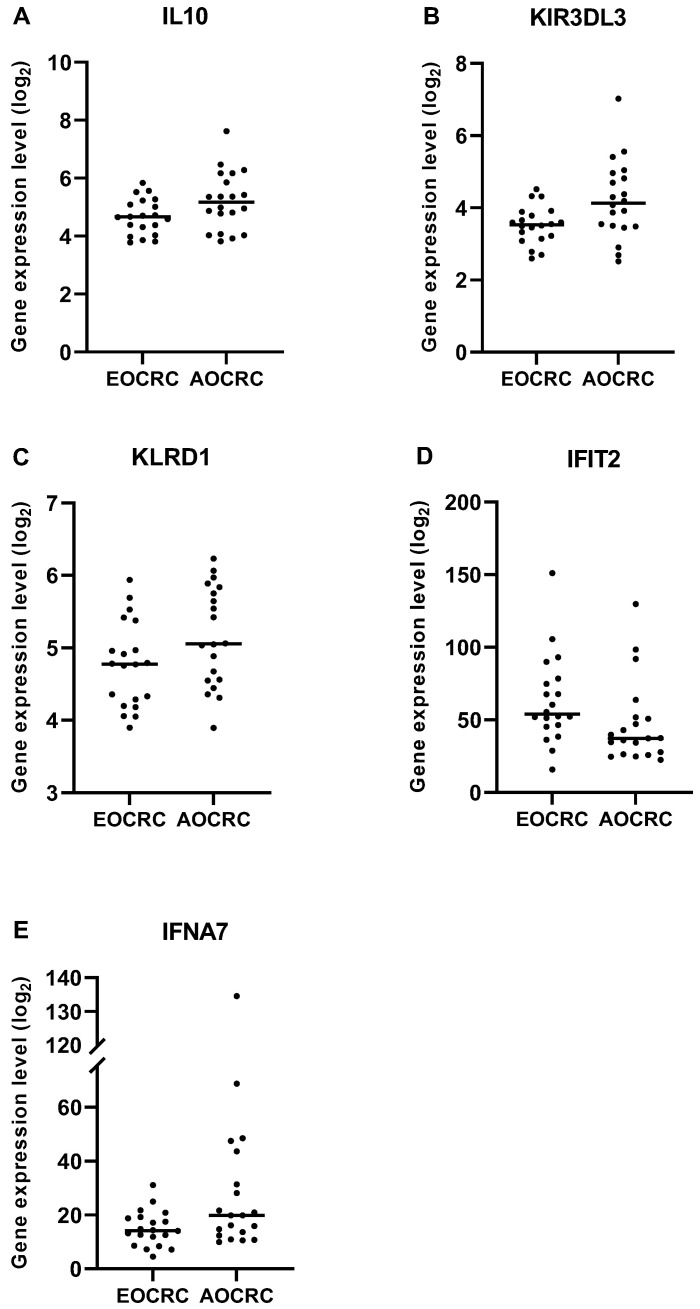
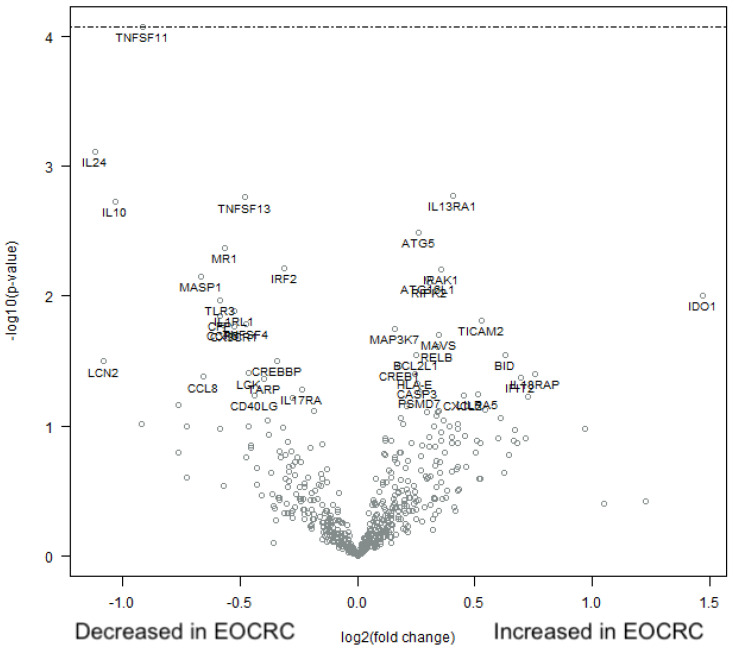
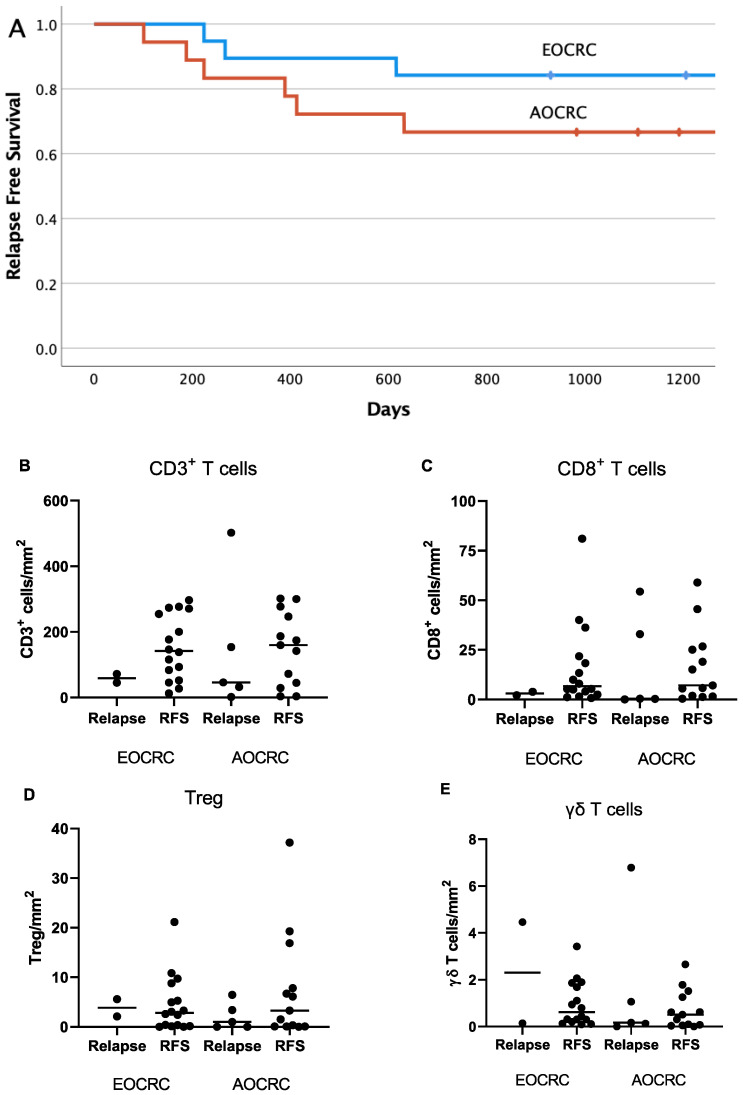
The incidence of left-sided colon and rectal cancer in young people are increasing worldwide, but its causes are poorly understood. It is not clear if the tumor microenvironment is dependent on age of onset, and little is known about the composition of tumor-infiltrating T cells in early-onset colorectal cancer (EOCRC). To address this, we investigated T-cell subsets and performed gene expression immune profiling in sporadic EOCRC tumors and matched average-onset colorectal cancer (AOCRC) tumors. Left-sided colon and rectal tumors from 40 cases were analyzed; 20 EOCRC (<45 years) patients were matched 1:1 to AOCRC (70-75 years) patients by gender, tumor location, and stage. Cases with germline pathogenic variants, inflammatory bowel disease or neoadjuvant-treated tumors were excluded. For T cells in tumors and stroma, a multiplex immunofluorescence assay combined with digital image analysis and machine learning algorithms was used. Immunological mediators in the tumor microenvironment were assessed by NanoString gene expression profiling of mRNA. Immunofluorescence revealed no significant difference between EOCRC and AOCRC with regard to infiltration of total T cells, conventional CD4+ and CD8+ T cells, regulatory T cells, or γδ T cells. Most T cells were located in the stroma in both EOCRC and AOCRC. Immune profiling by gene expression revealed higher expression in AOCRC of the immunoregulatory cytokine IL-10, the inhibitory NK cell receptors KIR3DL3 and KLRB1 (CD161), and IFN-a7 (IFNA7). In contrast, the interferon-induced gene IFIT2 was more highly expressed in EOCRC. However, in a global analysis of 770 tumor immunity genes, no significant differences could be detected. T-cell infiltration and expression of inflammatory mediators are similar in EOCRC and AOCRC. This may indicate that the immune response to cancer in left colon and rectum is not related to age of onset and that EOCRC is likely not driven by immune response deficiency.

Keywords: early-onset colorectal cancer; gene expression; immunofluorescence; tumor microenvironment; tumor-infiltrating lymphocytes.


Conflict of interest statement

The authors declare no conflict of interest.

Figures

Figure 1
Figure 1
Density of CD3+ T cells. The density of CD3+ T cells in tumors from early-onset (EOCRC) and average-onset colorectal cancer (AOCRC) patients was determined by immunofluorescence in tumor tissue (A) and tumor stroma (B). (C) Representative immunofluorescence image from an EOCRC patient with tumor cells (panCK, grey) and CD3+ T cells (green). Magnification 50× left and 300× right. (D) Percentage of all CD3+ cells located in the stroma. Symbols show individual values, and lines indicate the median.
Figure 2
Figure 2
CD8+ T cells in the tumor microenvironment. The density of CD8+ T cells in tumors from early-onset (EOCRC) and average-onset colorectal cancer (AOCRC) patients was determined by immunofluorescence in tumor tissue (A) and tumor stroma (B). (C) Representative immunofluorescence image from an EOCRC patient with tumor cells (panCK, grey), CD3+ T cells (magenta), and CD8+ T cells (yellow). Magnification 100× (left) and 300× (right). (D) Mean distance of stromal CD8+ cells to the nearest tumor cell. (E) Representative immunofluorescence image with tumor cells (panCK, grey), CD8+ T cells (yellow), and GrB+ cells (red). Magnification 500×. Percentage of CD8+ cells that express Granzyme B (GrB) located in tumor tissue (F) and tumor stroma (G). Symbols show individual values, and lines indicate the median.
Figure 3
Figure 3
CD4+ T cells in the tumor microenvironment. The density of Th cells (CD3+CD8FoxP3 cells) and Treg (CD3+CD8FoxP3+ cells) in tumors from early-onset (EOCRC) and average-onset colorectal cancer (AOCRC) patients was determined by immunofluorescence in tumor tissue (A,D) and tumor stroma (B,E). (C) Representative immunofluorescence image from an AOCRC patient with tumor cells (panCK, grey), CD3+ T cells (green), and FoxP3+ Treg (magenta). Magnification 300×. Symbols show individual values, and lines indicate the median.
Figure 4
Figure 4
γδ T cells in the tumor microenvironment. The density of γδ T cells in tumors from early onset (EOCRC) and average-onset colorectal cancer (AOCRC) patients was determined by immunofluorescence in tumor tissue (A) and tumor stroma (B). (C) Representative immunofluorescence image from an EOCRC patient with tumor cells (panCK, grey), CD8+ T cells (yellow), and γδ T cells (turquoise). Magnification 260×. Symbols show individual values, and lines indicate the median.
Figure 5
Figure 5
Gene expression in early and average-onset CRC. Significantly different expression in EOCRC and AOCRC in the three preselected gene panels are illustrated. Regulatory panel; (A) IL10 p = 0.0499, Cytotoxicity panel; (B) KIR3DL3 p = 0.0315 and (C) KLRD1 p = 0.0499, Pro-inflammatory panel; (D) IFIT2 p = 0.0167 and (E) IFNA7 p = 0.0439. Symbols show individual values, and lines indicate the median.
Figure 6
Figure 6
Immune profile in early and average-onset CRC tumors. RNA was extracted from formalin-fixed tumor tissue sections and analyzed using nCounter PanCancer Immune Profiling Panel. A volcano plot illustrating the relative up- and down-regulation of 770 genes in EOCRC tumors with AOCRC tumors as the baseline n = 20 in each group, respectively. The dashed line for the TNSF11 gene indicates p = 0.32 (32% false discoveries) in adjustment taking biologic gene-gene interactions into account.
Figure 7
Figure 7
Intratumoral T-cell infiltration in relation to patient outcome. Kaplan–Meier plot (A) showing relapse-free survival in EOCRC (blue) and AOCRC (red) patients with stage I–III tumors during a 3-year follow-up period (p = 0.41 between groups). The density of all T cells (B), CD8+ T cells (C), Treg (D), and gd T cells (E) in tumors from EOCRC and AOCRC patients who experienced a relapse within 3 years or had a relapse-free survival (RFS) was determined by immunofluorescence. Symbols show individual values, and lines indicate the median.

References

    1. Keum N., Giovannucci E. Global burden of colorectal cancer: Emerging trends, risk factors and prevention strategies. Nat. Rev. Gastroenterol. Hepatol. 2019;16:713–732. doi: 10.1038/s41575-019-0189-8. - DOI - PubMed
    1. Saad El Din K., Loree J.M., Sayre E.C., Gill S., Brown C.J., Dau H., De Vera M.A. Trends in the epidemiology of young-onset colorectal cancer: A worldwide systematic review. BMC Cancer. 2020;20:288. doi: 10.1186/s12885-020-06766-9. - DOI - PMC - PubMed
    1. Siegel R.L., Torre L.A., Soerjomataram I., Hayes R.B., Bray F., Weber T.K., Jemal A. Global patterns and trends in colorectal cancer incidence in young adults. Gut. 2019;68:2179–2185. doi: 10.1136/gutjnl-2019-319511. - DOI - PubMed
    1. Bailey C.E., Hu C.Y., You Y.N., Bednarski B.K., Rodriguez-Bigas M.A., Skibber J.M., Cantor S.B., Chang G.J. Increasing disparities in the age-related incidences of colon and rectal cancers in the United States, 1975–2010. JAMA Surg. 2015;150:17–22. doi: 10.1001/jamasurg.2014.1756. - DOI - PMC - PubMed
    1. Rahib L., Wehner M.R., Matrisian L.M., Nead K.T. Estimated Projection of US Cancer Incidence and Death to 2040. JAMA Netw. Open. 2021;4:e214708. doi: 10.1001/jamanetworkopen.2021.4708. - DOI - PMC - PubMed