

Phenotypic Plasticity in Circulating Tumor Cells Is Associated with Poor Response to Therapy in Metastatic Breast Cancer Patients
- PMID: 36900406
- PMCID: PMC10000974
- DOI: 10.3390/cancers15051616
Phenotypic Plasticity in Circulating Tumor Cells Is Associated with Poor Response to Therapy in Metastatic Breast Cancer Patients
Abstract
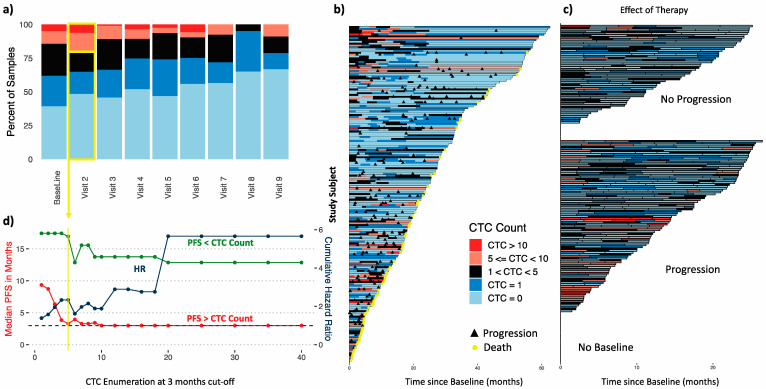
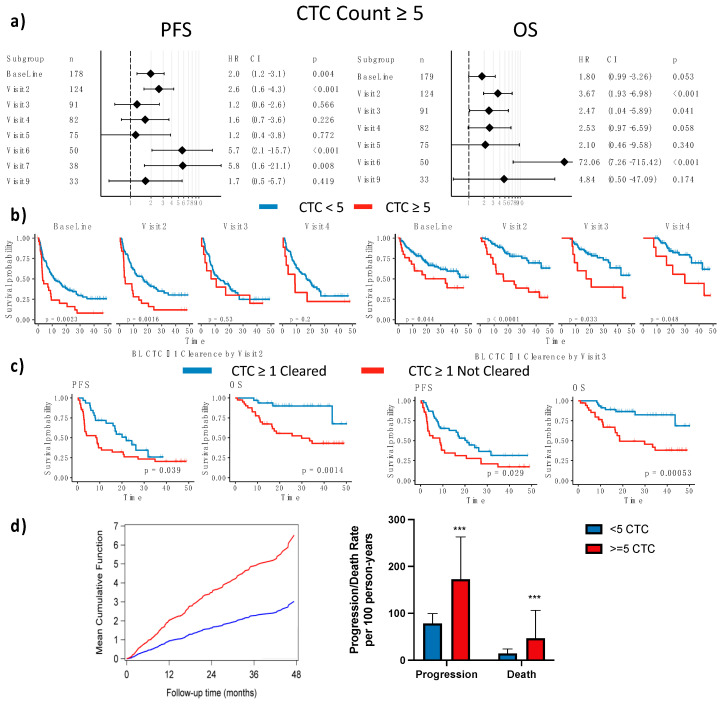
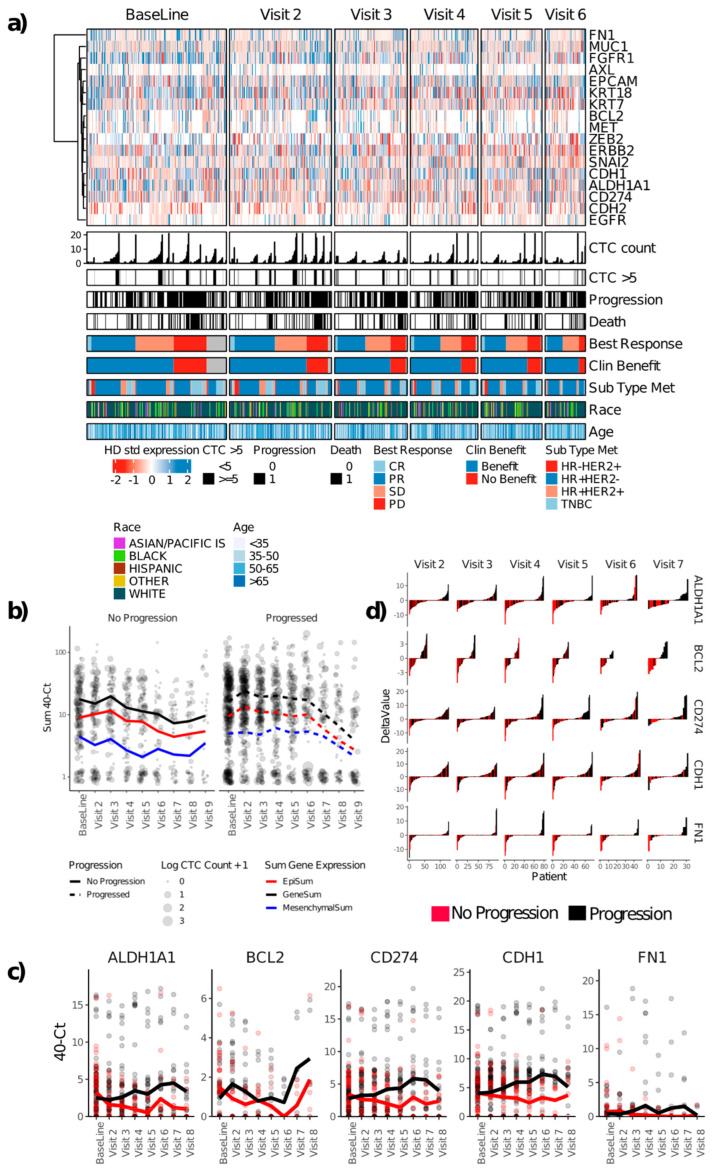
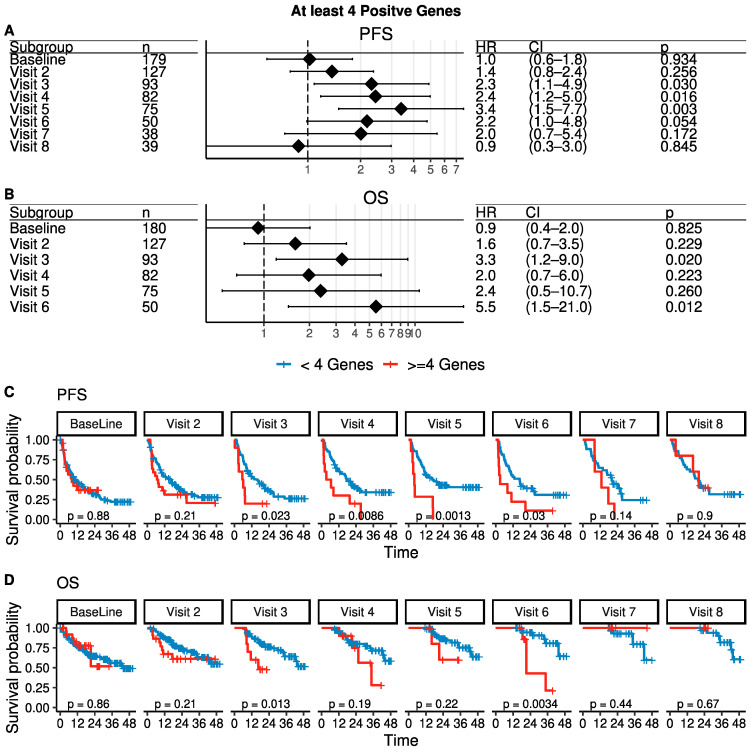
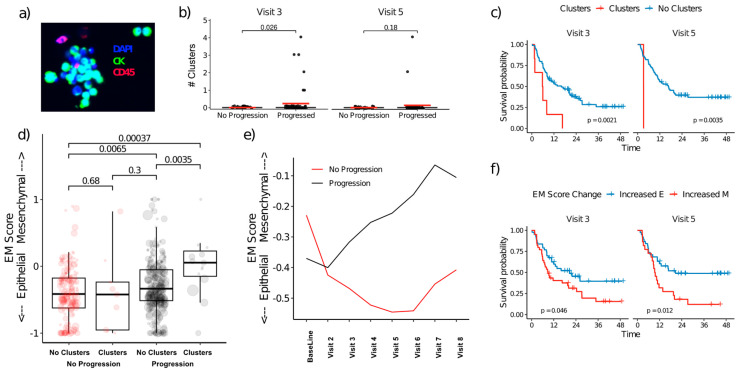
Circulating tumor cells (CTCs) are indicators of metastatic spread and progression. In a longitudinal, single-center trial of patients with metastatic breast cancer starting a new line of treatment, a microcavity array was used to enrich CTCs from 184 patients at up to 9 timepoints at 3-month intervals. CTCs were analyzed in parallel samples from the same blood draw by imaging and by gene expression profiling to capture CTC phenotypic plasticity. Enumeration of CTCs by image analysis relying primarily on epithelial markers from samples obtained before therapy or at 3-month follow-up identified the patients at the highest risk of progression. CTC counts decreased with therapy, and progressors had higher CTC counts than non-progressors. CTC count was prognostic primarily at the start of therapy in univariate and multivariate analyses but had less prognostic utility at 6 months to 1 year later. In contrast, gene expression, including both epithelial and mesenchymal markers, identified high-risk patients after 6-9 months of treatment, and progressors had a shift towards mesenchymal CTC gene expression on therapy. Cross-sectional analysis showed higher CTC-related gene expression in progressors 6-15 months after baseline. Furthermore, patients with higher CTC counts and CTC gene expression experienced more progression events. Longitudinal time-dependent multivariate analysis indicated that CTC count, triple-negative status, and CTC expression of FGFR1 significantly correlated with inferior progression-free survival while CTC count and triple-negative status correlated with inferior overall survival. This highlights the utility of protein-agnostic CTC enrichment and multimodality analysis to capture the heterogeneity of CTCs.
Keywords: EMT; biomarkers; biopsy; blood; breast cancer; breast neoplasms/pathology; circulating; circulating tumor cells (CTCs); circulating/pathology; liquid biopsy; metastatic process; neoplasms/diagnosis; neoplastic cells; tumor.
Conflict of interest statement
The funders had no role in the design of the study; in the collection, analyses, or interpretation of data; in the writing of the manuscript, or in the decision to publish the results. All authors report that Hitachi Chemical Company of Tokyo Japan (currently Showa Denko Materials Co., Ltd.) and The University of Texas MD Anderson Cancer Center entered into a Strategic Alliance Agreement to develop the MCA instrument and conduct the clinical trial that produced data reported in this manuscript.
Figures
Similar articles
-
The prognostic and therapeutic implications of circulating tumor cell phenotype detection based on epithelial-mesenchymal transition markers in the first-line chemotherapy of HER2-negative metastatic breast cancer.Cancer Commun (Lond). 2019 Jan 3;39(1):1. doi: 10.1186/s40880-018-0346-4. Cancer Commun (Lond). 2019. PMID: 30606259 Free PMC article. Clinical Trial.
-
Gene expression profiling of circulating tumor cells captured by MicroCavity Array is superior to enumeration in demonstrating therapy response in patients with newly diagnosed advanced and locally advanced non-small cell lung cancer.Transl Lung Cancer Res. 2023 Jan 31;12(1):109-126. doi: 10.21037/tlcr-22-314. Epub 2023 Jan 16. Transl Lung Cancer Res. 2023. PMID: 36762061 Free PMC article.
-
Prognostic impact of circulating tumor cell apoptosis and clusters in serial blood samples from patients with metastatic breast cancer in a prospective observational cohort.BMC Cancer. 2016 Jul 8;16:433. doi: 10.1186/s12885-016-2406-y. BMC Cancer. 2016. PMID: 27390845 Free PMC article.
-
The Role of Circulating Tumor Cells in the Prognosis of Metastatic Triple-Negative Breast Cancers: A Systematic Review of the Literature.Biomedicines. 2022 Mar 25;10(4):769. doi: 10.3390/biomedicines10040769. Biomedicines. 2022. PMID: 35453519 Free PMC article. Review.
-
Clinical Relevancy of Circulating Tumor Cells in Breast Cancer: Epithelial or Mesenchymal Characteristics, Single Cells or Clusters?Int J Mol Sci. 2022 Oct 12;23(20):12141. doi: 10.3390/ijms232012141. Int J Mol Sci. 2022. PMID: 36292996 Free PMC article. Review.
Cited by
-
Clinical significance and heterogeneity of circulating tumor cells and clusters in breast cancer subtypes.PeerJ. 2025 Jul 9;13:e19703. doi: 10.7717/peerj.19703. eCollection 2025. PeerJ. 2025. PMID: 40656955 Free PMC article. Review.
-
EMT and cancer: what clinicians should know.Nat Rev Clin Oncol. 2025 Jul 22. doi: 10.1038/s41571-025-01058-2. Online ahead of print. Nat Rev Clin Oncol. 2025. PMID: 40696171 Review.
-
Improving the Prognostic and Predictive Value of Circulating Tumor Cell Enumeration: Is Longitudinal Monitoring the Answer?Int J Mol Sci. 2024 Oct 2;25(19):10612. doi: 10.3390/ijms251910612. Int J Mol Sci. 2024. PMID: 39408942 Free PMC article. Review.
-
A Preliminary Analysis of Circulating Tumor Microemboli from Breast Cancer Patients during Follow-Up Visits.Curr Oncol. 2024 Sep 21;31(9):5677-5693. doi: 10.3390/curroncol31090421. Curr Oncol. 2024. PMID: 39330049 Free PMC article.
-
Update on Epithelial-Mesenchymal Plasticity in Cancer Progression.Annu Rev Pathol. 2024 Jan 24;19:133-156. doi: 10.1146/annurev-pathmechdis-051222-122423. Epub 2023 Sep 27. Annu Rev Pathol. 2024. PMID: 37758242 Free PMC article. Review.
References
-
- Hanahan D. Hallmarks of Cancer: New Dimensions. Cancer Discov. 2022;12:31–46. doi: 10.1158/2159-8290.CD-21-1059. - DOI - PubMed
Grants and funding
LinkOut - more resources
Full Text Sources
Miscellaneous
