. 2023 Feb 22;12(5):931.
doi: 10.3390/foods12050931.

Visualization of Sugar Content Distribution of White Strawberry by Near-Infrared Hyperspectral Imaging

Affiliations

Visualization of Sugar Content Distribution of White Strawberry by Near-Infrared Hyperspectral Imaging

Hayato Seki et al. Foods. .

Abstract

In this study, an approach to visualize the spatial distribution of sugar content in white strawberry fruit flesh using near-infrared hyperspectral imaging (NIR-HSI; 913-2166 nm) is developed. NIR-HSI data collected from 180 samples of "Tochigi iW1 go" white strawberries are investigated. In order to recognize the pixels corresponding to the flesh and achene on the surface of the strawberries, principal component analysis (PCA) and image processing are conducted after smoothing and standard normal variate (SNV) pretreatment of the data. Explanatory partial least squares regression (PLSR) analysis is performed to develop an appropriate model to predict Brix reference values. The PLSR model constructed from the raw spectra extracted from the flesh region of interest yields high prediction accuracy with an RMSEP and R2p values of 0.576 and 0.841, respectively, and with a relatively low number of PLS factors. The Brix heatmap images and violin plots for each sample exhibit characteristics feature of sugar content distribution in the flesh of the strawberries. These findings offer insights into the feasibility of designing a noncontact system to monitor the quality of white strawberries.

Keywords: hyperspectral imaging; image processing; partial least squares regression; principal component analysis; sugar content distribution; white strawberry.


Conflict of interest statement

The authors declare no conflict of interest.

Figures

Figure 1
Figure 1
Near-infrared hyperspectral imaging (NIR-HSI) system and Brix measurement method used in this work.
Figure 2
Figure 2
Preprocessing procedure for hyperspectral data with ROI extraction by thresholding (Fruit mask).
Figure 3
Figure 3
Preprocessing procedures for hyperspectral data, extraction of ROIs by PCA imaging and image processing, average spectra extracted from 6 ROIs (Fruit-bottom, Fruit-top, Flesh-bottom, Flesh-top, Achene-bottom and Achene-top).
Figure 4
Figure 4
Procedure for visualization of sugar content distribution. Violin plot (colored areas: distribution of data from kernel density estimation; red dots: median; black thick vertical line: interquartile range; horizontal colored lines: mean).
Figure 5
Figure 5
PC1 loadings of all samples obtained by principal component analysis from the pixels of the hyperspectral data measurement plane.
Figure 6
Figure 6
Number of pixels for ROI of fruit, flesh, and achene in strawberry, with ROIs defined by image masks created by preprocessing hyperspectral data.
Figure 7
Figure 7
Average reflectance spectra (the spectral range is the mean ± standard deviation) of: (a) fruit, (b) flesh, and (c) achene. Second derivative average reflectance spectra (Spectral range is mean ± standard deviation) of: (d) fruit, (e) flesh, and (f) achene in strawberries.
Figure 8
Figure 8
Sugar content (Brix%) references measured from blocks cut from the top and bottom of the fruit using a Brix meter (training dataset vs. testing dataset).
Figure 9
Figure 9
(a) Total of 35 key wavelengths (black points) selected by CARS method. (b) PLSR calibration result with training data set and prediction with testing dataset using the selected 35 key wavelengths and 8 LVs; the R2c and RMSEC are 0.866 and 0.530, whereas R2p and RMSEP are 0.841 and 0.576, respectively.
Figure 10
Figure 10
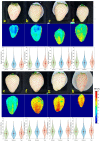
Prediction images and violin plots of Brix values using the PLSR model for white strawberries. Violin plots represent the distribution of pixel Brix values for each ROI (whole flesh, bottom flesh, and top flesh). In order to display representative samples, samples were selected from the lowest to the highest sugar content and arranged in (ah) order.

References

    1. da Silva F.L., Escribano-Bailón M.T., Alonso J.J.P., Rivas-Gonzalo J.C., Santos-Buelga C. Anthocyanin pigments in strawberry. Food Sci. Technol. 2007;40:374–382. doi: 10.1016/j.lwt.2005.09.018. - DOI
    1. Muñoz C., Hoffmann T., Escobar N.M., Ludemann F., Botella M.A., Valpuesta V., Schwab W. The strawberry fruit Fra a allergen functions in flavonoid biosynthesis. Mol. Plant. 2010;3:113–124. doi: 10.1093/mp/ssp087. - DOI - PubMed
    1. Salvatierra A., Pimentel P., Moya-León M.A., Herrera R. Increased accumulation of anthocyanins in Fragaria chiloensis fruits by transient suppression of FcMYB1 gene. Phytochemistry. 2013;90:25–36. doi: 10.1016/j.phytochem.2013.02.016. - DOI - PubMed
    1. Lin Y., Jiang L., Chen Q., Li Y., Zhang Y., Luo Y., Zhang Y., Sun B., Wang X., Tang H. Comparative Transcriptome Profiling Analysis of Red- and White-Fleshed Strawberry (Fragaria × ananassa) Provides New Insight into the Regulation of the Anthocyanin Pathway. Plant Cell Physiol. 2018;5:1844–1859. doi: 10.1093/pcp/pcy098. - DOI - PubMed
    1. Tsurumi R., Nakanishi T., Ishihara Y., Ohashi T., Kojima N., Saitou Y., Kobayashi Y., Hatakeyama A., Iimura K., Handa T. Breeding of a New Strawberry Cultivar with White Fruits ‘Tochigi i W1 go’. Bull. Tochigi Prefect. Agric. Exp. Stn. 2020;81:67–82.

LinkOut - more resources