

In-Line Near-Infrared Spectroscopy Gives Rapid and Precise Assessment of Product Quality and Reveals Unknown Sources of Variation-A Case Study from Commercial Cheese Production
- PMID: 36900546
- PMCID: PMC10001380
- DOI: 10.3390/foods12051026
In-Line Near-Infrared Spectroscopy Gives Rapid and Precise Assessment of Product Quality and Reveals Unknown Sources of Variation-A Case Study from Commercial Cheese Production
Abstract
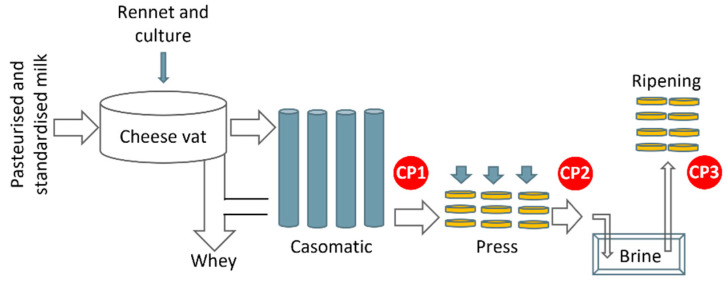
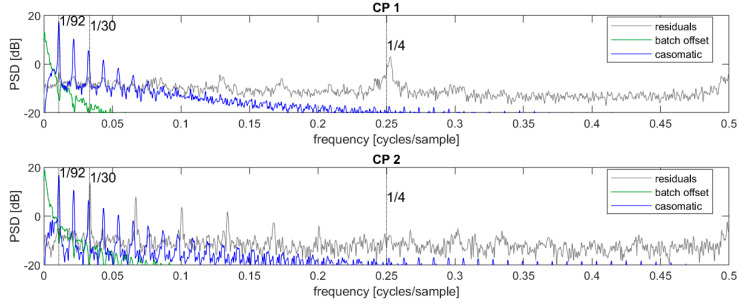
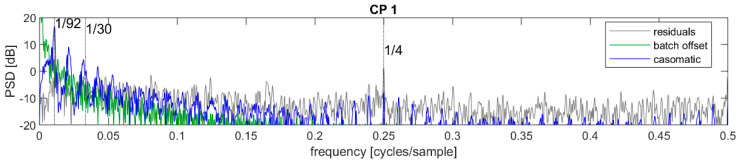
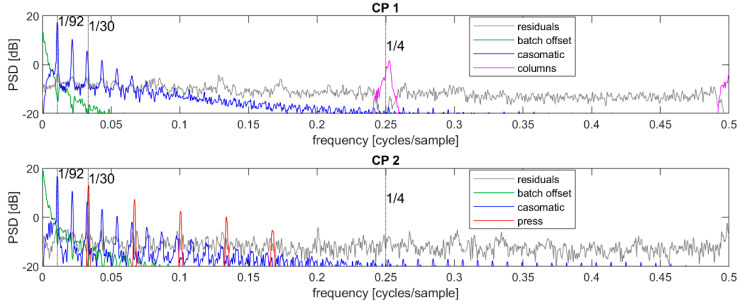
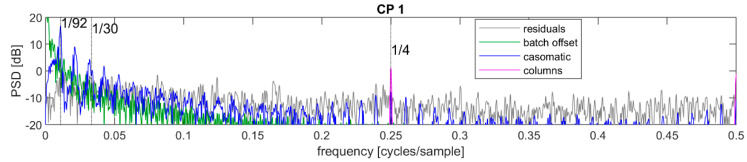
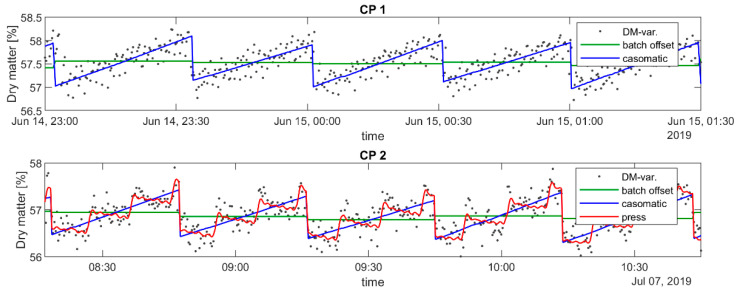
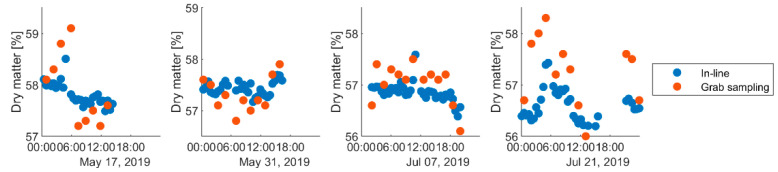
Quality testing in the food industry is usually performed by manual sampling and at/off-line laboratory analysis, which is labor intensive, time consuming, and may suffer from sampling bias. For many quality attributes such as fat, water and protein, in-line near-infrared spectroscopy (NIRS) is a viable alternative to grab sampling. The aim of this paper is to document some of the benefits of in-line measurements at the industrial scale, including higher precision of batch estimates and improved process understanding. Specifically, we show how the decomposition of continuous measurements in the frequency domain, using power spectral density (PSD), may give a useful view of the process and serve as a diagnostic tool. The results are based on a case regarding the large-scale production of Gouda-type cheese, where in-line NIRS was implemented to replace traditional laboratory measurements. In conclusion, the PSD of in-line NIR predictions revealed unknown sources of variation in the process that could not have been discovered using grab sampling. PSD also gave the dairy more reliable data on key quality attributes, and laid the foundation for future improvements.
Keywords: cheese production; in-line NIR; power spectral density; process analysis; sampling regime.
Conflict of interest statement
TINE SA has provided access to their cheese production line and has provided data to support analysis. As such, the company was not otherwise involved in decisions related to how the research was conducted, nor did they fund this research. As a researcher at TINE SA, Jorunn Øyaas’ role has been to contribute with an understanding of their cheese production and with inputs to methodological aspects. The authors declare no conflict of interests. The funders had no role in the design of the study; in the collection, analyses, or interpretation of data; in the writing of the manuscript; or in the decision to publish the results.
Figures
References
-
- Esbensen K. Introduction to the Theory and Practice of Sampling. IM Publications Open; Chichester, West Sussex: 2020.
-
- Petersen L., Minkkinen P., Esbensen K.H. Representative Sampling for Reliable Data Analysis: Theory of Sampling. Chemom. Intell. Lab. Syst. 2004;77:261–277. doi: 10.1016/j.chemolab.2004.09.013. - DOI
-
- Porep J.U., Kammerer D.R., Carle R. On-Line Application of near Infrared (NIR) Spectroscopy in Food Production. Trends Food Sci. Technol. 2015;46:211–230. doi: 10.1016/j.tifs.2015.10.002. - DOI
Grants and funding
LinkOut - more resources
Full Text Sources
Miscellaneous
