

Antioxidant Activities and Cytotoxicity of the Regulated Calcium Oxalate Crystals on HK-2 Cells of Polysaccharides from Gracilaria lemaneiformis with Different Molecular Weights
- PMID: 36900548
- PMCID: PMC10001015
- DOI: 10.3390/foods12051031
Antioxidant Activities and Cytotoxicity of the Regulated Calcium Oxalate Crystals on HK-2 Cells of Polysaccharides from Gracilaria lemaneiformis with Different Molecular Weights
Abstract
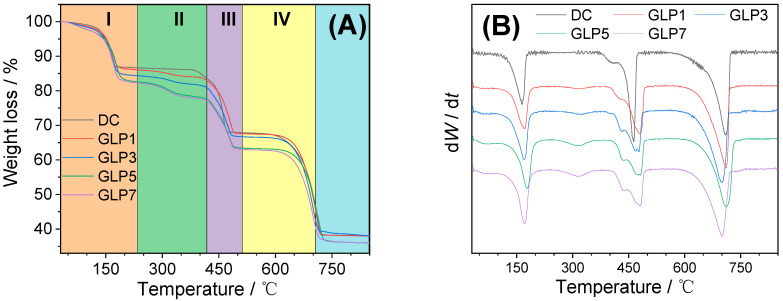
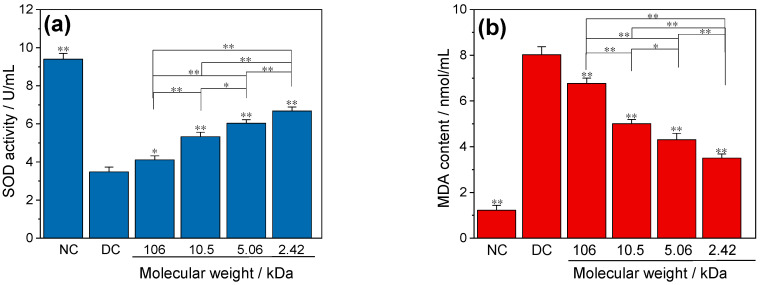
The antioxidant activities of seven degraded products (GLPs) with different molecular weights (Mw) of polysaccharides from Gracilaria lemaneiformis were compared. The Mw of GLP1-GLP7 were 106, 49.6, 10.5, 6.14, 5.06, 3.71 and 2.42 kDa, respectively. The results show that GLP2 with Mw = 49.6 kDa had the strongest scavenging capacity for hydroxyl radical, DPPH radical, ABTS radical and reducing power. When Mw < 49.6 kDa, the antioxidant activity of GLPs increased with the increase in Mw, but when Mw increased to 106 kDa, their antioxidant activity decreased. However, the ability of GLPs to chelate Fe2+ ions increased with the decrease in polysaccharide Mw, which was attributed to the fact that the polysaccharide active groups (-OSO3- and -COOH) were easier to expose, and the steric hindrance was smaller when GLPs chelated with Fe2+. The effects of GLP1, GLP3, GLP5 and GLP7 on the crystal growth of calcium oxalate (CaOx) were studied using XRD, FT-IR, Zeta potential and thermogravimetric analysis. Four kinds of GLPs could inhibit the growth of calcium oxalate monohydrate (COM) and induce the formation of calcium oxalate dihydrate (COD) in varying degrees. With the decrease in Mw of GLPs, the percentage of COD increased. GLPs increased the absolute value of the Zeta potential on the crystal surface and reduced the aggregation between crystals. Cell experiments showed that the toxicity of CaOx crystal regulated by GLPs to HK-2 cells was reduced, and the cytotoxicity of CaOx crystal regulated by GLP7 with the smallest Mw was the smallest, which was consistent with the highest SOD activity, the lowest ROS and MDA levels, the lowest OPN expression level and the lowest cell necrosis rate. These results suggest that GLPs, especially GLP7, may be a potential drug for the prevention and treatment of kidney stones.
Keywords: Gracilaria lemaneiformis polysaccharide; antioxidant activity; calcium oxalate; cytotoxicity; molecular weight.
Conflict of interest statement
The authors declare that they have no competing interests.
Figures


Similar articles
-
Bioactive Polysaccharides from Gracilaria lemaneiformis: Preparation, Structures, and Therapeutic Insights.Foods. 2024 Aug 31;13(17):2782. doi: 10.3390/foods13172782. Foods. 2024. PMID: 39272547 Free PMC article. Review.
-
Antioxidant Activity of Auricularia auricula Polysaccharides with Different Molecular Weights and Cytotoxicity Difference of Polysaccharides Regulated CaOx to HK-2 Cells.Bioinorg Chem Appl. 2023 Dec 23;2023:9968886. doi: 10.1155/2023/9968886. eCollection 2023. Bioinorg Chem Appl. 2023. PMID: 38161486 Free PMC article.
-
Structural Characterization and Repair Mechanism of Gracilaria lemaneiformis Sulfated Polysaccharides of Different Molecular Weights on Damaged Renal Epithelial Cells.Oxid Med Cell Longev. 2018 Aug 5;2018:7410389. doi: 10.1155/2018/7410389. eCollection 2018. Oxid Med Cell Longev. 2018. PMID: 30174781 Free PMC article.
-
Sulfated Undaria pinnatifida polysaccharide inhibits the formation of kidney stones by inhibiting HK-2 cell damage and reducing the adhesion of nano‑calcium oxalate crystals.Biomater Adv. 2022 Mar;134:112564. doi: 10.1016/j.msec.2021.112564. Epub 2021 Nov 25. Biomater Adv. 2022. PMID: 35525730
-
Extraction methods, structural characteristics, biological activities, and applications of the polysaccharides from Gracilaria lemaneiformis: A review.Int J Biol Macromol. 2025 Mar;293:139316. doi: 10.1016/j.ijbiomac.2024.139316. Epub 2024 Dec 29. Int J Biol Macromol. 2025. PMID: 39740720 Review.
Cited by
-
Bioactive Polysaccharides from Gracilaria lemaneiformis: Preparation, Structures, and Therapeutic Insights.Foods. 2024 Aug 31;13(17):2782. doi: 10.3390/foods13172782. Foods. 2024. PMID: 39272547 Free PMC article. Review.
-
Carboxymethylated Rhizoma alismatis Polysaccharides Regulate Calcium Oxalate Crystals Growth and Reduce the Regulated Crystals' Cytotoxicity.Biomolecules. 2023 Jun 27;13(7):1044. doi: 10.3390/biom13071044. Biomolecules. 2023. PMID: 37509080 Free PMC article.
-
Research Advances of Modification and Nutraceutical Properties of Polysaccharide.Foods. 2023 Aug 15;12(16):3065. doi: 10.3390/foods12163065. Foods. 2023. PMID: 37628063 Free PMC article.
References
-
- Kvsrg P., Sujatha D., Bharathi K. Herbal drugs in urolithiasis-a review. Pharmacogn. Rev. 2007;1:175–178.
-
- Sun X.Y., Ouyang J.M., Li Y.B., Wen X.L. Mechanism of cytotoxicity of micron/nano calcium oxalate monohydrate and dihydrate crystals on renal epithelial cells. RSC Adv. 2015;5:45393–45406. doi: 10.1039/C5RA02313K. - DOI
Grants and funding
LinkOut - more resources
Full Text Sources
Research Materials
