. 2023 Feb 22;20(5):3898.
doi: 10.3390/ijerph20053898.

Atmospheric Deposition around the Industrial Areas of Milazzo and Priolo Gargallo (Sicily-Italy)-Part A: Major Ions

Affiliations

Atmospheric Deposition around the Industrial Areas of Milazzo and Priolo Gargallo (Sicily-Italy)-Part A: Major Ions

Filippo Brugnone et al. Int J Environ Res Public Health. .

Abstract

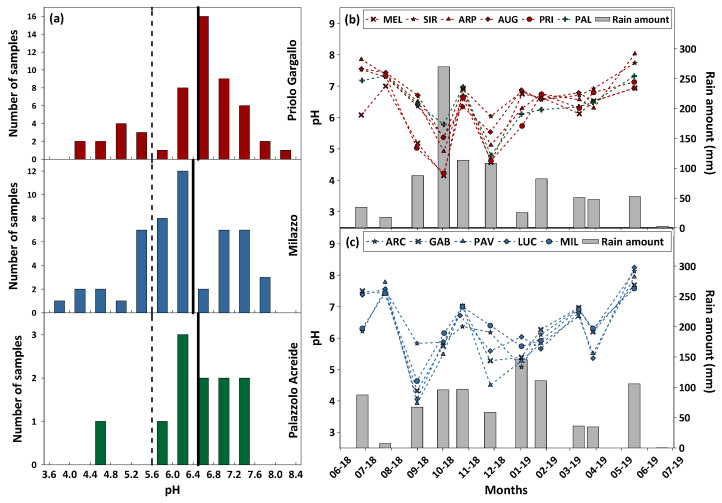
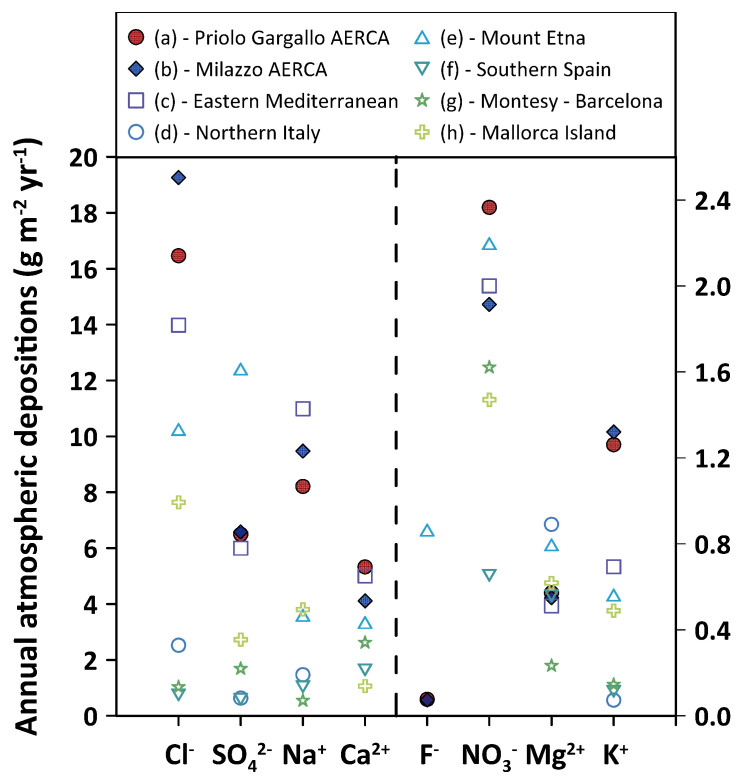
The chemical composition of rainwater was studied in two highly-industrialised areas in Sicily (southern Italy), between June 2018 and July 2019. The study areas were characterised by large oil refining plants and other industrial hubs whose processes contribute to the release of large amounts of gaseous species that can affect the chemical composition of atmospheric deposition As in most of the Mediterranean area, rainwater acidity (ranging in the study area between 3.9 and 8.3) was buffered by the dissolution of abundant geogenic carbonate aerosol. In particular, calcium and magnesium cations showed the highest pH-neutralizing factor, with ~92% of the acidity brought by SO42- and NO3- neutralized by alkaline dust. The lowest pH values were observed in samples collected after abundant rain periods, characterised by a less significant dry deposition of alkaline materials. Electrical Conductivity (ranging between 7 µS cm-1 and 396 µS cm-1) was inversely correlated with the amount of rainfall measured in the two areas. Concentrations of major ionic species followed the sequence Cl- > Na+ > SO42- ≃ HCO3- > ≃ Ca2+ > NO3- > Mg2+ > K+ > F-. High loads of Na+ and Cl- (with a calculated R2 = 0.99) reflected proximity to the sea. Calcium, potassium, and non-sea-salt magnesium had a prevalent crustal origin. Non-sea salt sulphate, nitrate, and fluoride can be attributed mainly to anthropogenic sources. Mt. Etna, during eruptive periods, may be also considered, on a regional scale, a significant source for fluoride, non-sea salt sulphate, and even chloride.

Keywords: acidity neutralization; anthropogenic source; atmospheric deposition; major ions; marine source.


Conflict of interest statement

The authors declare no conflict of interest.

Figures

Figure 1
Figure 1
Milazzo AERCA (a) and Priolo Gargallo AERCA (b) (red dashed areas); location of the SIAS weather station (yellow squares), and monitoring sites (white triangles). Box (c) shows the wind speeds and directions recorded at 2 m above the ground at SIAS weather stations. Base map: Google Earth.
Figure 2
Figure 2
Temperature (°C), relative humidity (%), and rain amount (mm) at the SIAS automatic weather station of Milazzo (a), Augusta (b), Siracusa (c), and Palazzolo Acreide (d), during the study period.
Figure 3
Figure 3
Sum of anions vs. sum of cations binary diagram. ∑ anions = Cl + NO3 + SO42− + HCO3 + F and ∑ cations = Ca2+ + Na+ + Mg2+ + K+. The black line (1:1) represents the charge balance between anions and cations. The area between the two black curves represents the acceptable balance error following the standard analytical methods (APHA, AWWA, WEF, 2005 [51]).
Figure 4
Figure 4
Major ions’ relative abundances (%), on an equivalent basis, in the study areas of Priolo Gargallo (red), Milazzo (blue), and Palazzolo Acreide (green).
Figure 5
Figure 5
(a) The pH values of bulk deposition samples collected from June 2018 to June 2019 at Priolo Gargallo, Milazzo, and Palazzolo Acreide. The dashed line indicates the theoretical pH value expected for unpolluted cloud water at equilibrium with 410 ppm of atmospheric CO2. The solid lines indicate the median pH values in the study areas. On the right side, seasonal variability of the pH values and average rain amount at Priolo Gargallo (b) and Milazzo (c) study areas.
Figure 6
Figure 6
Correlation between pH values and nssCa2+ (meq L−1) (a), pH and nnsSO42− (meq L−1) (b), and between nssCa2+ (meq L−1) and nnsSO42− (meq L−1) (c), in all study areas.
Figure 7
Figure 7
(a) The EC distribution (Log10) of rainwater samples that were collected from June 2018 to June 2019 at Priolo Gargallo, Milazzo, and Palazzolo Acreide study areas, respectively. On the right side, seasonal variability of the EC values and average rain amount at Priolo Gargallo (b) and Milazzo (c) study areas.
Figure 8
Figure 8
Major anions (a) and cations (b) concentrations (mg L−1) for Priolo Gargallo AERCA, Milazzo AERCA, and Palazzolo Acreide background area.
Figure 9
Figure 9
Correlations, in (meq L−1), in Priolo, Milazzo, and Palazzolo Acreide study areas, between Na+ and Cl (a), Na+ and Mg2+ (b), nss-SO42− and NO3 (c), Cl and F (d). In (a,b,d) the dotted line represents the ratio of ions in seawater (Keene, 1986 [9]).
Figure 10
Figure 10
Gaseous species (CO2, SOx, NOx) emissions and sources at Milazzo AERCA (a) and Priolo Gargallo AERCA (b) (ARPA, 2022, [62]).
Figure 11
Figure 11
Monthly atmospheric depositions (mg m−2) for sulphate (a), chloride (b), fluoride (c), and calcium (d) at Priolo Gargallo AERCA. The solid black lines are mean values; the dashed lines are median values.
Figure 12
Figure 12
Monthly atmospheric depositions (mg m−2) for sulphate (a), chloride (b), fluoride (c), and calcium (d) at Milazzo AERCA. The solid black lines are average values; the dashed lines are median values.
Figure 13
Figure 13
Annual atmospheric depositions (g m−2 yr−1). (a) this study—Priolo Gargallo AERCA; (b) this study—Milazzo AERCA; (c) Izmir, Turkey (Al-Momani et al. 1995 [53]); (d) northern Italy (Pieri et al. 2010 [64]); (e) Mount Etna (Calabrese et al. 2011 [42]); (f) southern Spain (Morales-Baquero et al. 2013 [65]); (g) Montesy–Barcelona (Castillo et al. 2017 [66]); (h) Mallorca Island (Cerro et al. 2020 [67]). For chloride, sulphate, sodium, and calcium see the axis on the left; for fluoride, nitrate, magnesium, and potassium see the axis on the right.

Similar articles

Cited by

References

    1. D’Alessandro W., Katsanou K., Lambrakis N., Bellomo S., Brusca L., Liotta M. Chemical and isotopic characterisation of bulk deposition in the Louros basin (Epirus, Greece) Atmos. Res. 2013;132–133:399–410. doi: 10.1016/j.atmosres.2013.07.007. - DOI
    1. Galy-Lacaux C., Laouali D., Descroix L., Gobron N., Liousse C. Long term precipitation chemistry and wet deposition in a remote dry savanna site in Africa (Niger) Atmos. Chem. Phys. 2009;9:1579–1595. doi: 10.5194/acp-9-1579-2009. - DOI
    1. Amodio M., Catino S., Dambruoso P.R., De Gennaro G., Di Gilio A., Giungato P., Laiola E., Marzocca A., Mazzone A., Sardaro A., et al. Atmospheric deposition: Sampling procedures, analytical methods, and main recent findings from the scientific literature. Adv. Meteorol. 2014;2014:161730. doi: 10.1155/2014/161730. - DOI
    1. Schlesinger W.H. Biogeochemistry: An Analysis of Global Change. Academic Press; New York, NY, USA: 1997.
    1. Tang A., Zhuang G., Wang Y., Yuan H., Sun Y. The chemistry of precipitation and its relation to aerosol in Beijing. Atmos. Environ. 2005;39:3397–3406. doi: 10.1016/j.atmosenv.2005.02.001. - DOI

Publication types