

A Dual Coverage Monitoring of the Bile Acids Profile in the Liver-Gut Axis throughout the Whole Inflammation-Cancer Transformation Progressive: Reveal Hepatocellular Carcinoma Pathogenesis
- PMID: 36901689
- PMCID: PMC10001964
- DOI: 10.3390/ijms24054258
A Dual Coverage Monitoring of the Bile Acids Profile in the Liver-Gut Axis throughout the Whole Inflammation-Cancer Transformation Progressive: Reveal Hepatocellular Carcinoma Pathogenesis
Abstract
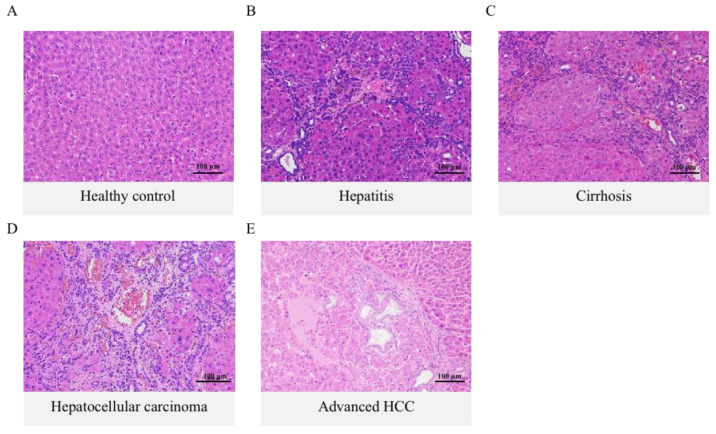
Hepatocellular carcinoma (HCC) is the terminal phase of multiple chronic liver diseases, and evidence supports chronic uncontrollable inflammation being one of the potential mechanisms leading to HCC formation. The dysregulation of bile acid homeostasis in the enterohepatic circulation has become a hot research issue concerning revealing the pathogenesis of the inflammatory-cancerous transformation process. We reproduced the development of HCC through an N-nitrosodiethylamine (DEN)-induced rat model in 20 weeks. We achieved the monitoring of the bile acid profile in the plasma, liver, and intestine during the evolution of "hepatitis-cirrhosis-HCC" by using an ultra-performance liquid chromatography-tandem mass spectrometer for absolute quantification of bile acids. We observed differences in the level of primary and secondary bile acids both in plasma, liver, and intestine when compared to controls, particularly a sustained reduction of intestine taurine-conjugated bile acid level. Moreover, we identified chenodeoxycholic acid, lithocholic acid, ursodeoxycholic acid, and glycolithocholic acid in plasma as biomarkers for early diagnosis of HCC. We also identified bile acid-CoA:amino acid N-acyltransferase (BAAT) by gene set enrichment analysis, which dominates the final step in the synthesis of conjugated bile acids associated with the inflammatory-cancer transformation process. In conclusion, our study provided comprehensive bile acid metabolic fingerprinting in the liver-gut axis during the inflammation-cancer transformation process, laying the foundation for providing a new perspective for the diagnosis, prevention, and treatment of HCC.
Keywords: BAAT; bile acids; enterohepatic circulation; hepatocellular carcinoma; inflammation-cancer transformation process; liver–gut axis.
Conflict of interest statement
The authors declare no conflict of interest.
Figures


Similar articles
-
Hepatocellular carcinoma: Novel understandings and therapeutic strategies based on bile acids (Review).Int J Oncol. 2022 Oct;61(4):117. doi: 10.3892/ijo.2022.5407. Epub 2022 Aug 5. Int J Oncol. 2022. PMID: 35929515 Free PMC article. Review.
-
Quantitative profiling of 19 bile acids in rat plasma, liver, bile and different intestinal section contents to investigate bile acid homeostasis and the application of temporal variation of endogenous bile acids.J Steroid Biochem Mol Biol. 2017 Sep;172:69-78. doi: 10.1016/j.jsbmb.2017.05.015. Epub 2017 Jun 3. J Steroid Biochem Mol Biol. 2017. PMID: 28583875
-
Altered Microbiota Diversity and Bile Acid Signaling in Cirrhotic and Noncirrhotic NASH-HCC.Clin Transl Gastroenterol. 2020 Mar;11(3):e00131. doi: 10.14309/ctg.0000000000000131. Clin Transl Gastroenterol. 2020. PMID: 32352707 Free PMC article.
-
Comparison of bile acids profiles in the enterohepatic circulation system of mice and rats.J Steroid Biochem Mol Biol. 2022 Jun;220:106100. doi: 10.1016/j.jsbmb.2022.106100. Epub 2022 Mar 25. J Steroid Biochem Mol Biol. 2022. PMID: 35341917
-
The gut microbiome-bile acid axis in hepatocarcinogenesis.Biomed Pharmacother. 2021 Jan;133:111036. doi: 10.1016/j.biopha.2020.111036. Epub 2020 Nov 28. Biomed Pharmacother. 2021. PMID: 33378947 Review.
Cited by
-
Bile acids, gut microbiota, and therapeutic insights in hepatocellular carcinoma.Cancer Biol Med. 2023 Dec 23;21(2):144-62. doi: 10.20892/j.issn.2095-3941.2023.0394. Cancer Biol Med. 2023. PMID: 38148326 Free PMC article. Review.
-
Deciphering the Oncogenic Landscape of Hepatocytes Through Integrated Single-Nucleus and Bulk RNA-Seq of Hepatocellular Carcinoma.Adv Sci (Weinh). 2025 Apr;12(14):e2412944. doi: 10.1002/advs.202412944. Epub 2025 Feb 17. Adv Sci (Weinh). 2025. PMID: 39960344 Free PMC article.
-
LncRNA DERCNC in Hepatocellular Carcinoma with Cirrhosis Aggravates Tumor Proliferation by Targeting SOX9.Curr Cancer Drug Targets. 2025;25(6):665-679. doi: 10.2174/0115680096310229240626102449. Curr Cancer Drug Targets. 2025. PMID: 39041258
-
Understanding crosstalk between the gut and liver microbiome: pathogenesis to therapeutic approaches in liver cancer.Cancer Cell Int. 2025 Jul 29;25(1):291. doi: 10.1186/s12935-025-03840-9. Cancer Cell Int. 2025. PMID: 40730999 Free PMC article. Review.
-
Insights into the gut-liver axis: mechanisms and emerging therapies in hepatocellular carcinoma.Front Pharmacol. 2025 May 19;16:1595853. doi: 10.3389/fphar.2025.1595853. eCollection 2025. Front Pharmacol. 2025. PMID: 40458800 Free PMC article. Review.
References
MeSH terms
Substances
Grants and funding
LinkOut - more resources
Full Text Sources
Medical
