. 2023 Feb 21;24(5):4270.
doi: 10.3390/ijms24054270.

Back to Basics: A Simplified Improvement to Multiple Displacement Amplification for Microbial Single-Cell Genomics

Affiliations

Back to Basics: A Simplified Improvement to Multiple Displacement Amplification for Microbial Single-Cell Genomics

Morgan S Sobol et al. Int J Mol Sci. .

Abstract

Microbial single-cell genomics (SCG) provides access to the genomes of rare and uncultured microorganisms and is a complementary method to metagenomics. Due to the femtogram-levels of DNA in a single microbial cell, sequencing the genome requires whole genome amplification (WGA) as a preliminary step. However, the most common WGA method, multiple displacement amplification (MDA), is known to be costly and biased against specific genomic regions, preventing high-throughput applications and resulting in uneven genome coverage. Thus, obtaining high-quality genomes from many taxa, especially minority members of microbial communities, becomes difficult. Here, we present a volume reduction approach that significantly reduces costs while improving genome coverage and uniformity of DNA amplification products in standard 384-well plates. Our results demonstrate that further volume reduction in specialized and complex setups (e.g., microfluidic chips) is likely unnecessary to obtain higher-quality microbial genomes. This volume reduction method makes SCG more feasible for future studies, thus helping to broaden our knowledge on the diversity and function of understudied and uncharacterized microorganisms in the environment.

Keywords: cell sorting; contact-free liquid dispenser; microbial dark matter; miniaturization; whole genome amplification.


Conflict of interest statement

The authors declare no conflict of interest.

Figures

Figure A1
Figure A1
Overview of WGA methods. (A) MDA, multiple displacement amplification; WGA-X, 88 whole genome amplification—X. (B) PTA, primary template-directed amplification. (C) MALBAC, 89 multiple annealing and looping based amplification cycles. Made with Biorender.com.
Figure A2
Figure A2
Genome coverage by sequencing effort of MDA in 1.25µL reaction volumes. Trimmed reads were down-sampled from all 1.25 µL samples (n = 5) to 200×, 100×, 80×, 60×, 40×, 20× using BBmap reformat.sh [76]. Down-sampled reads were then mapped to E. coli MG1655 reference genome with bbmap.sh. Standard error bars were calculated using all five replicates.
Figure 1
Figure 1
General overview of a single-cell genomics pipeline. (A) Environmental samples should be immediately processed, or deep-frozen in the presence of a cryoprotectant that preserves the integrity of the cell. (B) Cells are typically stained with a non-specific fluorescent dye, such as DAPI or SYBR® Green, but they can also be specifically labeled, e.g., with fluorescence in situ hybridization. (C) Fluorescence activated cell sorting (FACS) is the most common choice for physical isolation of a single cell into multi-well plates (D). Once isolated, the single cells are lysed, typically with a combination of alkaline buffer and freeze-thaw cycling, to release the DNA from the cell. (E) Whole genome amplification (WGA) is required to generate sufficient amounts of DNA for library preparation since a typical prokaryotic cell only contains a few femtograms of DNA. (F) Once DNA libraries are prepared, short- and/or long-read sequencing platforms such as Illumina® and Oxford Nanopore Technologies®, respectively, can be employed. (G) Finally, bioinformatics is utilized to conduct the quality assessment, assembly, classification, ORF calling, and annotation of the sequences. Created with BioRender.com. Modified from Kaster & Sobol (2020) [17].
Figure 2
Figure 2
Characteristic comparison of the different microbial SCG volume reduction methods. (A) Circuit microfluidics. (B) Droplet microfluidics. (C) Micro/Nanowells. (D) Planar substrates. (E) Hydrogels. The color code indicates the relative advantage of a particular approach based on a given feature, from green (better advantage), through orange, to red (less advantage). Table was generated with information from Zhou et al., Fung et al., and Nguyen et al. [54,55,57], as well as from our own experiences with droplet microfluidics, microwells, and planar substrates. Made with Biorender.com.
Figure 3
Figure 3
MDA reaction statistics overview. (A) Average MDA reaction kinetics by reaction size. Standard error bars represent the standard deviation calculated using all five replicates from each reaction volume. (B) Average MDA amplification yield by reaction size. Relative fluorescence units (RFU) refer to the fluorescent signal of SYTO™-13 measured with a real-time thermo-cycler. SYTO™-13 is used to monitor the progression of MDA because it binds to double-stranded DNA as it is amplified. The boxes’ middle line represents the median, and the x represents the mean. Five replicates were used for calculation.
Figure 4
Figure 4
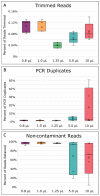
Read processing statistics. (A) Percentage of reads removed during quality trimming. (B) Percentage of PCR duplicates removed. (C) Percentage of reads kept after read contaminant filtering. The boxes’ middle line represents the median, and the x represents the mean. Five replicates were used for calculation.
Figure 5
Figure 5
Genome coverage and coverage uniformity bias. (A) Read depth from each replicate was calculated in 10 kb bins across the E. coli genome. Plots show the average across all replicates for each reaction volume. Cov. is the average coverage breadth, i.e., the percentage of genome positions covered by at least one read. (B) Uniformity of read coverage and depth were calculated across 10 kb bins along the E. coli genome and averaged for all five replicates of each reaction volume.
Figure 6
Figure 6
Single-amplified genome (SAG) assembly statistics. (A) Final sequence depth, calculated as the estimated number of times each base within the genome was sequenced on average. (B) The total average length of the assemblies, (C) N50 average, the minimum contig length needed to support 50% of the genome assembly, and (D) the percent coverage of the assemblies across the E. coli MG1655 reference genome, were all determined with QUAST [70]. (E) The completeness of the assembled genome and (F) percent of contaminated bases in the assemblies, were determined by MDMCleaner [12]. The boxes’ middle line represents the median, and the x represents the mean. Five replicates were used for calculation.

References

    1. Wu D., Raymond J., Wu M., Chatterji S., Ren Q., Graham J.E., Bryant D.A., Robb F., Colman A., Tallon L.J., et al. Complete Genome Sequence of the Aerobic CO-Oxidizing Thermophile Thermomicrobium Roseum. PLoS ONE. 2009;4:e4207. doi: 10.1371/journal.pone.0004207. - DOI - PMC - PubMed
    1. McDonald D., Price M.N., Goodrich J., Nawrocki E.P., Desantis T.Z., Probst A., Andersen G.L., Knight R., Hugenholtz P. An Improved Greengenes Taxonomy with Explicit Ranks for Ecological and Evolutionary Analyses of Bacteria and Archaea. ISME J. 2012;6:610–618. doi: 10.1038/ismej.2011.139. - DOI - PMC - PubMed
    1. Hug L.A., Baker B.J., Anantharaman K., Brown C.T., Probst A.J., Castelle C.J., Butterfield C.N., Hernsdorf A.W., Amano Y., Ise K. A New View of the Tree of Life. Nat. Microbiol. 2016;1:16048. doi: 10.1038/nmicrobiol.2016.48. - DOI - PubMed
    1. Lloyd K.G., Steen A.D., Ladau J., Yin J., Crosby L. Phylogenetically Novel Uncultured Microbial Cells Dominate Earth Microbiomes. mSystems. 2018;3:e00055-18. doi: 10.1128/mSystems.00055-18. - DOI - PMC - PubMed
    1. Solden L., Lloyd K., Wrighton K. The Bright Side of Microbial Dark Matter: Lessons Learned from the Uncultivated Majority. Curr. Opin. Microbiol. 2016;31:217–226. doi: 10.1016/j.mib.2016.04.020. - DOI - PubMed

LinkOut - more resources