. 2023 Feb 21;24(5):4326.
doi: 10.3390/ijms24054326.

TCF-1 Is Required for CD4 T Cell Persistence Functions during AlloImmunity

Affiliations

TCF-1 Is Required for CD4 T Cell Persistence Functions during AlloImmunity

Mahinbanu Mammadli et al. Int J Mol Sci. .

Abstract

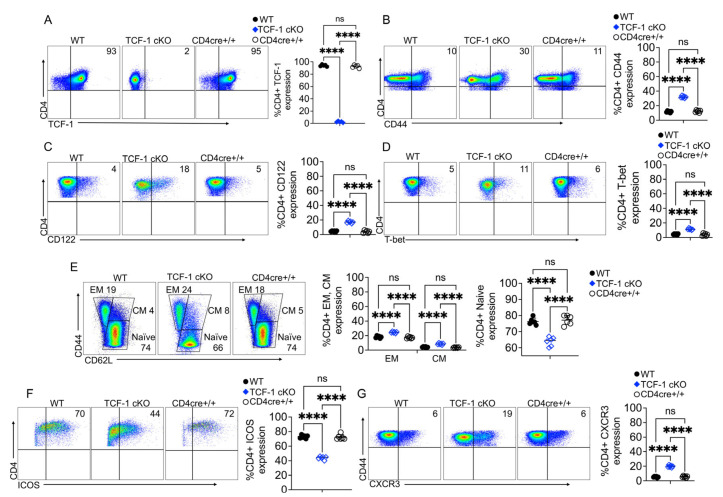
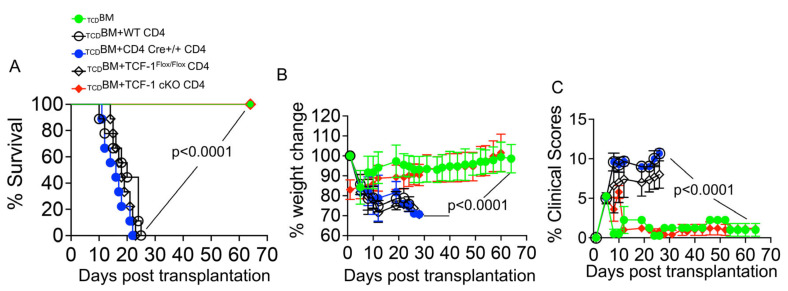
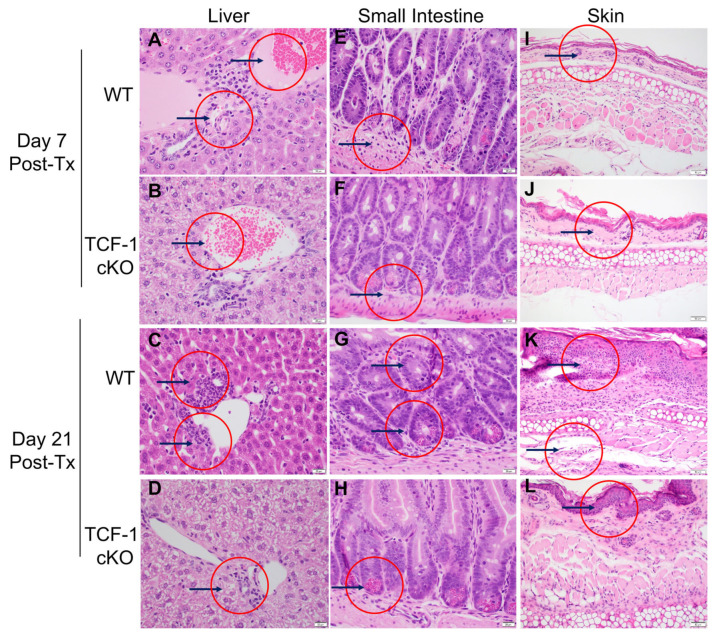
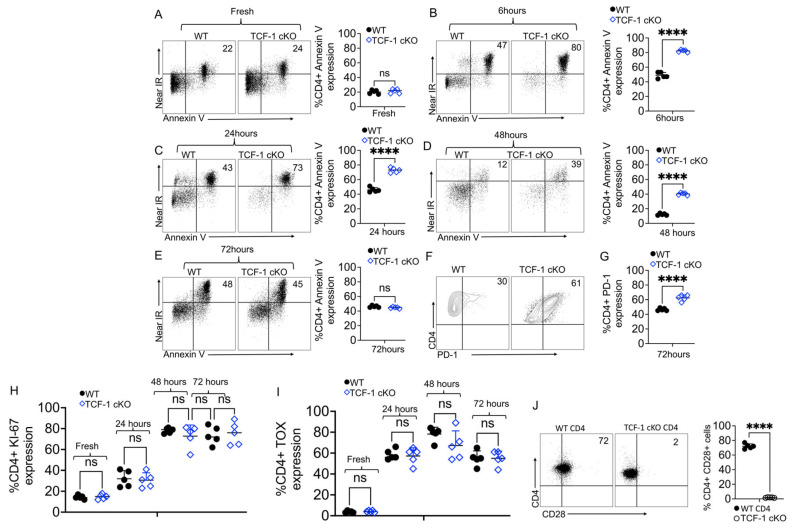
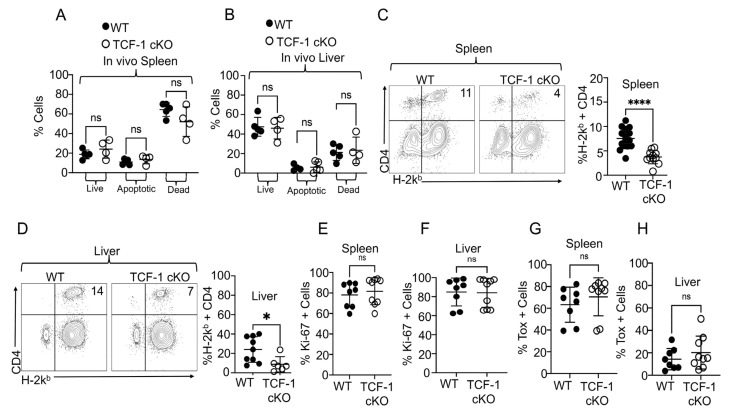
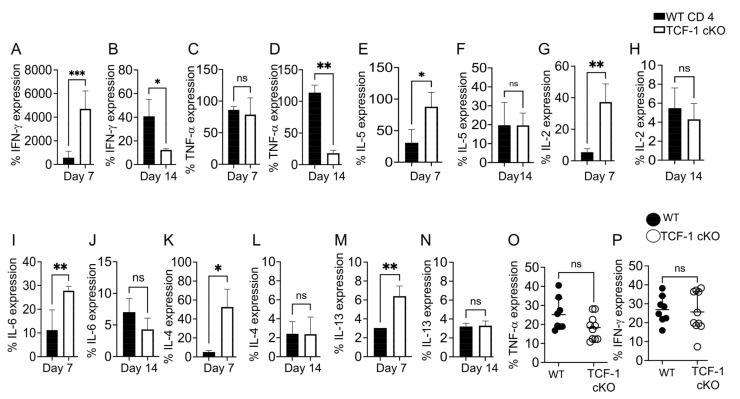
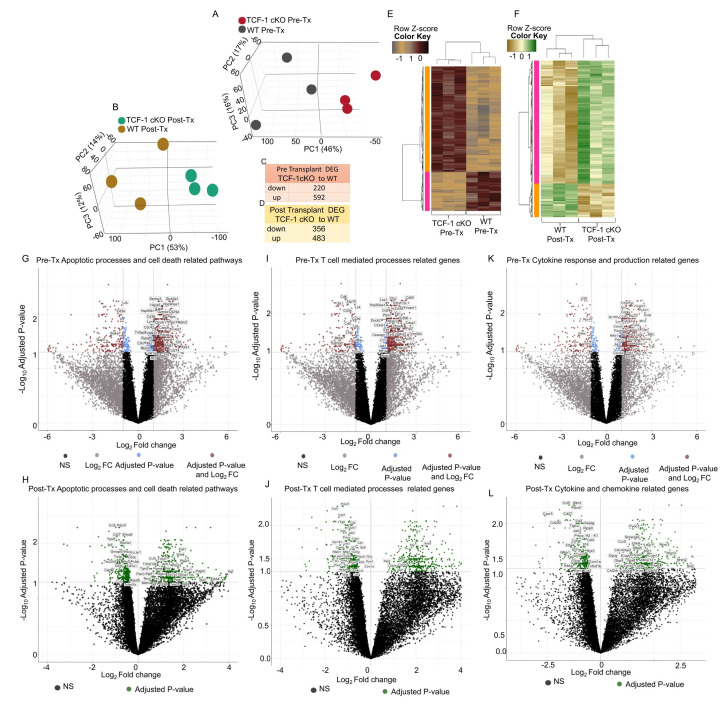
The transcription factor T cell factor-1 (TCF-1) is encoded by Tcf7 and plays a significant role in regulating immune responses to cancer and pathogens. TCF-1 plays a central role in CD4 T cell development; however, the biological function of TCF-1 on mature peripheral CD4 T cell-mediated alloimmunity is currently unknown. This report reveals that TCF-1 is critical for mature CD4 T cell stemness and their persistence functions. Our data show that mature CD4 T cells from TCF-1 cKO mice did not cause graft versus host disease (GvHD) during allogeneic CD4 T cell transplantation, and donor CD4 T cells did not cause GvHD damage to target organs. For the first time, we showed that TCF-1 regulates CD4 T cell stemness by regulating CD28 expression, which is required for CD4 stemness. Our data showed that TCF-1 regulates CD4 effector and central memory formation. For the first time, we provide evidence that TCF-1 differentially regulates key chemokine and cytokine receptors critical for CD4 T cell migration and inflammation during alloimmunity. Our transcriptomic data uncovered that TCF-1 regulates critical pathways during normal state and alloimmunity. Knowledge acquired from these discoveries will enable us to develop a target-specific approach for treating CD4 T cell-mediated diseases.

Keywords: CD4 T cell serum level cytokine production; CD4 T cells stemness; TCF-1; alloimmunity.


Conflict of interest statement

The authors have declared that no conflict of interest exists.

Figures

Figure 1
Figure 1
TCF-1 regulates CD4 T cell phenotypes and memory formation. (AG) Splenocytes from WT, CD4cre+/+ or TCF-1 cKO donor mice were isolated, and stained for flow cytometry, and run on a BD LSRFortessa flow cytometer. (A) Flow plot of CD4 T cells expressing TCF-1 and statistical analysis of the percent of CD4 T cells expressing TCF-1 with a quantitative analysis. (B) Flow plot of CD4 T cells expressing CD44 and a statistical analysis of the percent of CD4 T cells expressing CD44 with a quantitative analysis graph. (C) Flow plot of CD4 T cells expressing CD122 and a statistical analysis of the percent of CD4 T cells expressing CD122 with a quantitative analysis graph. (D) Flow plot of CD4 T cells expressing T-bet and a statistical analysis of the percent of CD4 T cells expressing T-bet. Quantitative analysis of several mice presented as a graph. (E) Flow plot of the memory phenotype of CD4 T cells by expression of CD44 and CD62L and a statistical analysis of the percent of CD4 T cells with memory phenotypes. Quantitative analysis of several mice presented as a graph. (F) Flow plot of effector memory CD4 T cells expressing ICOS and a statistical analysis of the percent of the effector memory CD4 T cells expressing ICOS. (G) Flow plot of CD4 T cells expressing CXCR3 and a statistical analysis of the percent of CD4 T cells expressing CXCR3. All data are shown as individual points with mean and SD, all data were analyzed with Student’s t-test or one-way ANOVA (depending on data groups) followed by Tukey’s multiple comparisons. For naïve mice n = 3–5 per group of mice are shown. For chimeric mice n = 5 per group of mice and one experiment is shown (carried out once). **** means p-value ≤ 0.0001.
Figure 2
Figure 2
Loss of TCF-1 in donor CD4 T cells reduces severity and persistence of GvHD symptoms. Recipient BALB/c mice (MHC haplotype d) were lethally irradiated and allotransplanted with 10 × 106 WT C57Bl/6 TCDBM cells and 1 × 10⁶ CD4 T cells from WT, CD4cre+/+, TCF-1Flox/Flox or TCF-1 cKO donor mice (C57Bl6 background, MHC haplotype b). The mice were weighed and given a GvHD clinical score three times per week for almost 70 days. Score was determined by the combined scores for fur texture, activity level, posture, skin integrity, weight loss, and diarrhea. (A) Survival of mice in each group over the 70 day experiment, analyzed with Kaplan–Meier survival statistics. (B) Changes in weight, as determined three times a week over 70 days. (C) Clinical scores were determined three times a week over 70 days. Mean and SD plotted, analyzed by one-way ANOVA. n = 4 mice/group for BM alone: n = 5 experimental mice/group for all other groups. Survival is a combination of two experiments. Each experiment is repeated twice.
Figure 3
Figure 3
TCF-1 regulates chemokine/chemokine receptor expression in mature CD4 T cells during alloactivation. To perform the qPCR, BALB/c mice were lethally irradiated and allotransplanted, as described above. Donor CD4 T cells from WT and TCF-1 cKO mice were FACS sorted both pre- and post-transplant (7 days after transplant), from the spleen (both pre and day 7) and liver (day 7 only). The cells were sorted in TRizol, and RNA was extracted using chloroform and converted into cDNA using a synthesis kit (more details in Methods). cDNA was added to premade mouse chemokine/chemokine receptor primer plates (Invitrogen Carlsbad CA USA) and run on a Quant Studio 3 thermocycler. Results are shown as a heatmap of fold change per gene, compared to 18S reference gene for each plate. Boxes with an “X” represent signals too low to detect or otherwise unreadable due to technical error. Heatmaps compare WT versus TCF-1 cKO CD4 T cells in (A) pre-transplant spleen, (B) post-transplant spleen and (C) post-transplant liver. One sample was used per donor type and condition, with n = 5 mice into one sample per condition for (B,C), carried out once. Each experiment was performed twice, one experiment of two experiments is presented.
Figure 4
Figure 4
TCF-1 regulates CD4 T cells damage to GVHD target organs. We collected organs from mice allotransplanted, as described above. At day 7 and day 21 post-transplant, organs were taken from recipient mice for histology analyses. Skin, liver, and small intestine (SI) were sectioned, stained with H&E, and analyzed by a pathologist. Representative sections for each organ per group and timepoint are shown. Day 7—H&E liver image of recipient BALB/c mice transplanted with CD4 T cells from (A) WT mice and (B) TCF-1 cKO mice. Day 21—Liver of recipient mice transplanted with CD4 T cells from (C) WT mice and (D) from TCF-1 cKO mice. Day 7—SI of the recipient mice transplanted with CD4 T cells from (E) WT mice and (F) from TCF-1 cKO mice. Day 21—SI of the recipient mice transplanted with CD4 T cells from (G) WT mice and (H) from TCF-1 cKO mice. Day 7—Skin of the recipient mice transplanted with CD4 T cells from (I) WT mice and (J) from TCF-1 cKO mice. Day 21- Skin of the recipient mice transplanted with CD4 T cells from (K) WT mice and (L) from TCF-1 cKO mice. Arrows show lymphocyte infiltration and tissue damage One of the two experiments is presented.
Figure 5
Figure 5
TCF-1 regulates CD4 T cell survival and persistence. (AE) Splenocytes from either WT or TCF-1 cKO mice were isolated and either activated with anti-CD3/CD28 antibodies for 6, 24, 48, or 72 h in culture or left unstimulated, and cells were stained for Annexin V and Near IR to determine the dead, apoptotic and live cells. (A) Flow plots of CD4 T cells from either WT or TCF-1 cKO mice with quantitative and statistical analyses are shown at 0 h of the dead, apoptotic, and live cells in unstimulated (B) CD4 T cells from either WT or TCF-1 cKO mice were stimulated with CD3/CD28, at 6 h with quantitative and statistically analyzed. (C) CD4 T cells from WT or TCF-1 cKO mice stimulated with CD3/CD28 for 24 h, shown with quantitative analyses (D), CD4 T cells stimulated with CD3/CD28 for 48 h, shown with statistical analyses (E) CD4 T cells stimulated with CD3/CD28 for 72 h, shown with statistical analyses. (F,G) Splenocytes from TCF-1 cKO mice and WT mice were isolated and either activated with anti-CD3/CD28 antibodies for 24, 48, or 72 h in culture or left unstimulated, and were stained for PD-1. (H) Splenocytes from TCF-1 cKO mice and WT mice were isolated and either activated with anti-CD3/CD28 antibodies for 24, 48, or 72 h in culture or left unstimulated, and were stained for Ki-67 with quantitative analyses are presented. (I) Splenocytes from TCF-1 cKO mice and WT mice were isolated and either activated with anti-CD3/CD28 antibodies for 24, 48, or 72 h in culture or left unstimulated, and were stained for TOX with quantitative analyses are presented. (J) CD8 T cells from WT, or TCF-1 cKO mice were examined for CD28 expression. n = 4, one representative of 3 experiments is shown. **** means p-value ≤ 0.0001.
Figure 6
Figure 6
TCF-1 regulates donor T cell presence but has no effect on T cell exhaustion during alloimmunity. Recipient mice were allotransplanted, as described in Figure 1 with CD4 T cells from WT or TCF-1 cKO mice. At day 7, spleens and livers were taken from euthanized recipients. Lymphocytes were isolated and stained for H2Kb to identify donor cells then gated on CD3, CD4, and with annexin V-FITC and LIVE/DEAD near IR. Cells were identified as live (Ann.V-, IR-), apoptotic (Ann.V+, IR-), or dead (Ann.V+, IR+), in both (A) spleen and (B) liver. Flow plots and statistical analyses of CD4+ H2kb+ donor CD4 T cells from (C) spleen and (D) liver at day 7 post-transplant. (EH) Recipient mice were allotransplanted as before, and at day 7, spleens and livers were obtained from euthanized recipients. Lymphocytes were isolated, and the cells were stained for H2Kb, CD3, CD4, CD8, and Ki67 to identify proliferating/activated cells in (E) the spleen and (F) liver. Donor CD4 T cells were also stained for TOX to identify the exhausted cells in (G) the spleen and (H) liver. All individual points are shown with mean and SD. For A-B N = 3–5 per group with one representative of two experiments shown. For C-H, n = 3–5 per group with combined data from two experiments shown. * Means p-value ≤ 0.05, **** means p-value ≤ 0.0001.
Figure 7
Figure 7
TCF-1 regulates serum levels of cytokines during alloimmunity. Recipient BALB/c mice were allotransplanted with WT or TCF-1 cKO donor CD4 T cells, as before. Serum was obtained from cardiac blood of euthanized recipient mice at day 7 and day 14 post-transplant and was tested using a LEGENDplex multiplex ELISA kit. Serum concentration (pg/mL) over time for WT versus TCF-1 cKO-transplanted mice. (A,B) day 7 and at day 14 post-transplant of IFN-γ. (C) Day 7 TNF-α. (D) Day 14 TNF-α. (E) Day 7 IL-5, (F) Day 14 IL-5. (G) Day 7 IL-2. (H) Day 14 IL-2. (I) Day 7 IL-6. (J) Day 14 IL-6. (K) Day 7 IL-4. (L) Day 14 IL-4. (M) Day 7 IL-13. (N) Day 7 IL-13. At day 7 post-transplant, donor splenocytes were obtained and restimulated with 6 h of culturing with anti-CD3/anti-CD28 or PBS (control), along with GolgiPlug. Donor cells were stained for H2Kb, CD3, and CD4, then fixed/permeabilized and stained with anti-IFN-γ and anti-TNF-α. Production of (O) TNF-α and (P) IFN-γ was measured by flow cytometry, using percent cytokine-positive cells. All individual points are shown with mean and SD. n = 3–5 per group for A-K with one representative of two experiments shown. For L-M, n = 3–5 per group with data from two experiments are shown. All data were analyzed with Student’s t-test. * Means p-value ≤ 0.05, ** means p-value ≤ 0.01, and *** means p-value ≤ 0.001.
Figure 8
Figure 8
TCF-1 regulates key signaling pathways in donor CD4 T cells. Recipient BALB/c mice were allotransplanted with WT or TCF-1 cKO donor CD4 T cells, as before. Pre-transplant (Pre-Tx) donor CD4 T cells were FACS-sorted from the spleens of donor mice prior to transplant, and at day 7 post-transplant (Post-Tx), donor CD4 T cells were FACS-sorted back from the recipient spleen. Cells were sorted into TRizol, then RNA was extracted, and paired-end sequencing was carried out on an Illumina sequencer. Data were analyzed using the statistical computing environment R (v4.0.4), the Bioconductor suite of packages for R, and Rstudio (v1.4.1106). Three dimensional PCA plots of the pre-transplant samples (A) and post-transplant samples (B) are shown. Tables showing up- and downregulated differentially expressed genes—DEGs (FDR < 0.05, LogFC = 1) of pre-transplanted samples (C), and DEGs (FDR < 0.05) of post-transplanted samples (D) are given. (E,F) Gene ontology enrichment analysis was conducted using the g: Profiler toolset; g: GOSt tool. (G,H) Volcano plots showing DEGs of pre-transplanted samples (G) and post-transplanted samples (H), with important genes that play a role in cell death and apoptotic processes are labeled. (I,J) Volcano plots showing DEGs of pre-transplanted samples (I) and post-transplanted samples (J), with important genes that play a role in T cell-mediated processes are labeled. (K,L) Volcano plots showing DEGs of pre-transplanted samples (K) and post-transplanted samples (L), with important genes that play a role in cytokine and chemokine regulation are labeled. For each condition we used three or four mice.

Similar articles

Cited by

References

    1. Weber B.N., Chi A.W., Chavez A., Yashiro-Ohtani Y., Yang Q., Shestova O., Bhandoola A. A critical role for TCF-1 in T-lineage specification and differentiation. Nature. 2011;476:63–68. doi: 10.1038/nature10279. - DOI - PMC - PubMed
    1. Escobar G., Mangani D., Anderson A.C. T cell factor 1: A master regulator of the T cell response in disease. Sci. Immunol. 2020;5:eabb9726. doi: 10.1126/sciimmunol.abb9726. - DOI - PMC - PubMed
    1. Im S.J., Hashimoto M., Gerner M.Y., Lee J., Kissick H.T., Burger M.C., Shan Q., Hale J.S., Lee J., Nasti T.H., et al. Defining CD8+ T cells that provide the proliferative burst after PD-1 therapy. Nature. 2016;537:417–421. doi: 10.1038/nature19330. - DOI - PMC - PubMed
    1. He R., Hou S., Liu C., Zhang A., Bai Q., Han M., Yang Y., Wei G., Shen T., Yang X., et al. Follicular CXCR5- expressing CD8(+) T cells curtail chronic viral infection. Nature. 2016;537:412–428. doi: 10.1038/nature19317. - DOI - PubMed
    1. Ferber I.A., Brocke S., Taylor-Edwards C., Ridgway W., Dinisco C., Steinman L., Dalton D., Fathman C.G. Mice with a disrupted IFN-gamma gene are susceptible to the induction of experimental autoimmune encephalomyelitis (EAE) J. Immunol. 1996;156:5–7. doi: 10.4049/jimmunol.156.1.5. - DOI - PubMed