. 2023 Feb 23;24(5):4450.
doi: 10.3390/ijms24054450.

TERT Extra-Telomeric Roles: Antioxidant Activity and Mitochondrial Protection

Affiliations

TERT Extra-Telomeric Roles: Antioxidant Activity and Mitochondrial Protection

Jessica Marinaccio et al. Int J Mol Sci. .

Abstract

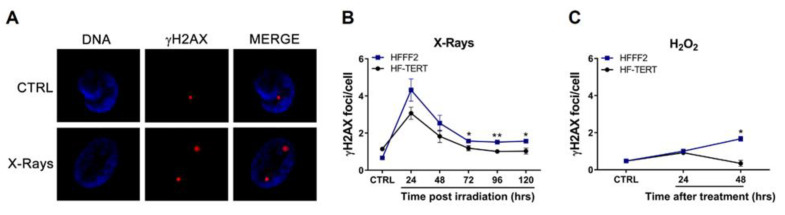
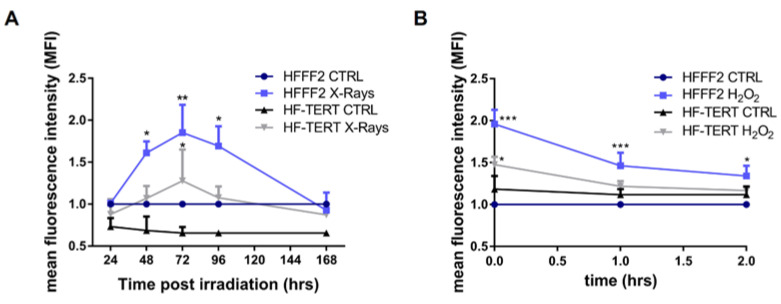
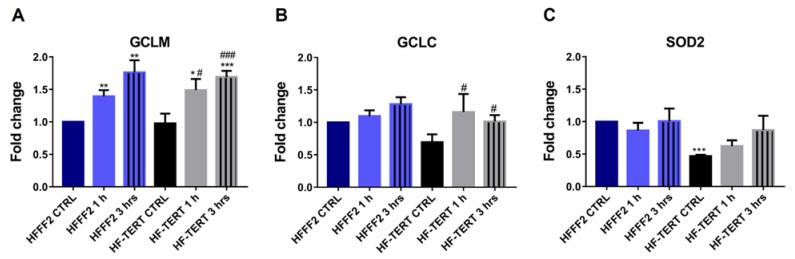
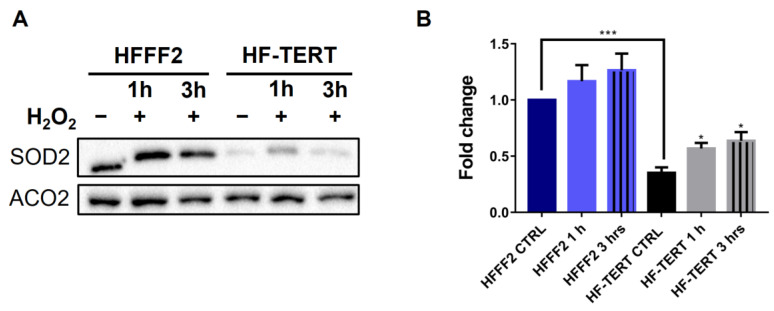
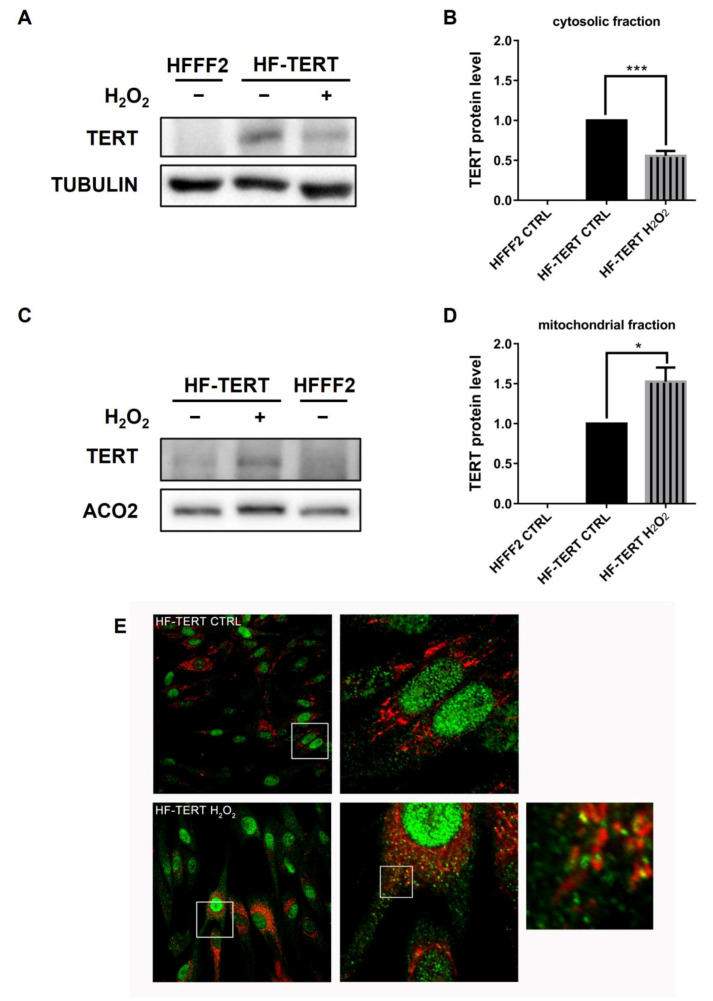
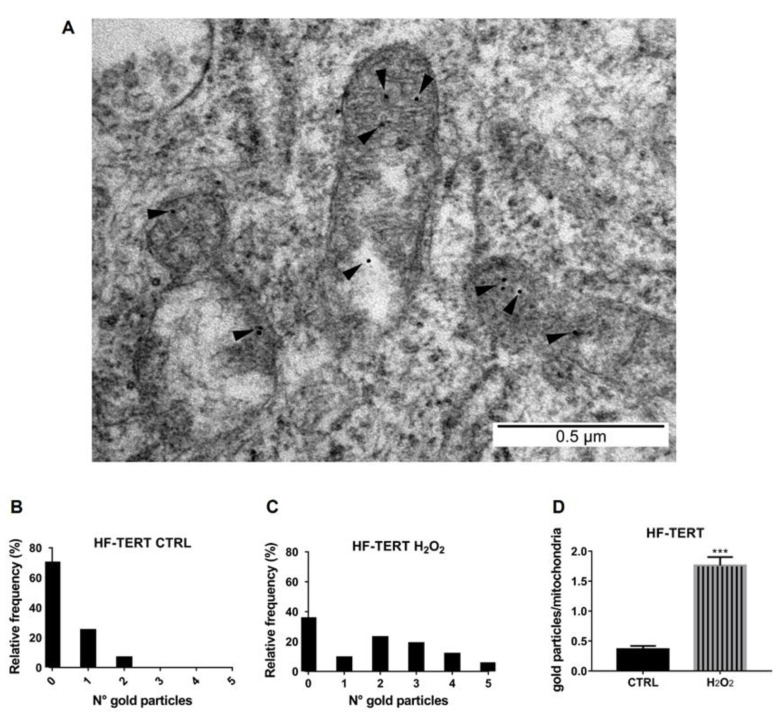
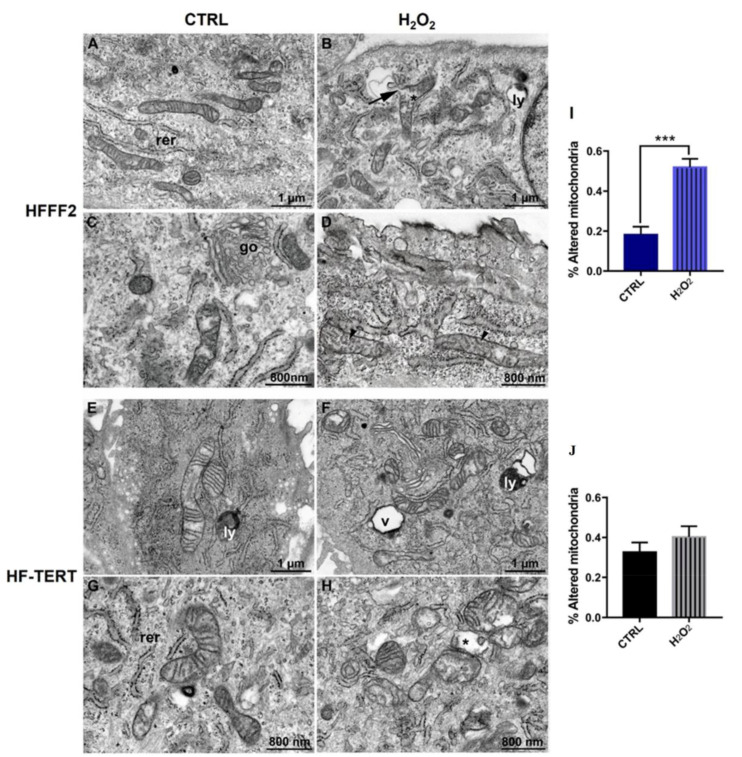
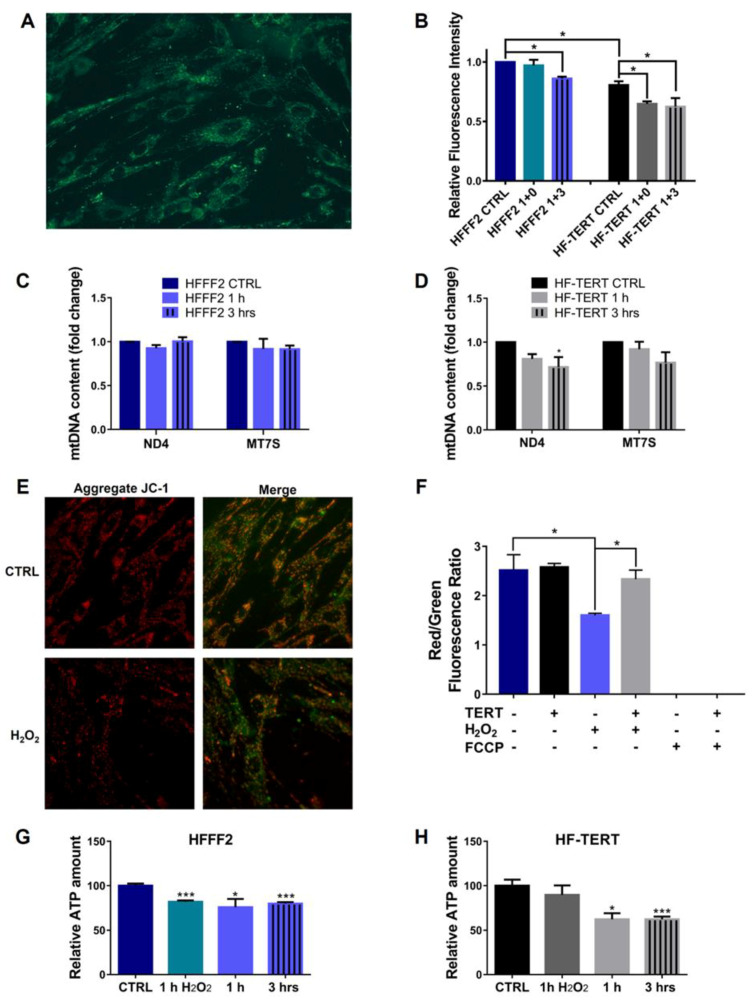
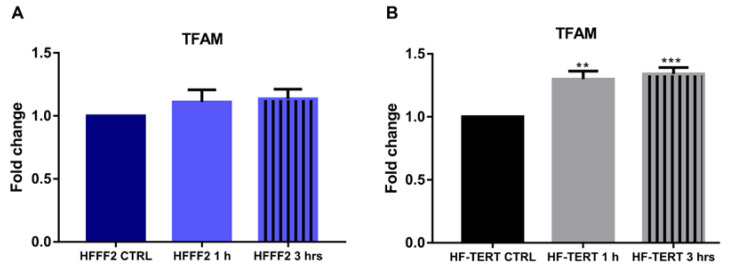
Telomerase reverse transcriptase (TERT) is the catalytic subunit of telomerase holoenzyme, which adds telomeric DNA repeats on chromosome ends to counteract telomere shortening. In addition, there is evidence of TERT non-canonical functions, among which is an antioxidant role. In order to better investigate this role, we tested the response to X-rays and H2O2 treatment in hTERT-overexpressing human fibroblasts (HF-TERT). We observed in HF-TERT a reduced induction of reactive oxygen species and an increased expression of the proteins involved in the antioxidant defense. Therefore, we also tested a possible role of TERT inside mitochondria. We confirmed TERT mitochondrial localization, which increases after oxidative stress (OS) induced by H2O2 treatment. We next evaluated some mitochondrial markers. The basal mitochondria quantity appeared reduced in HF-TERT compared to normal fibroblasts and an additional reduction was observed after OS; nevertheless, the mitochondrial membrane potential and morphology were better conserved in HF-TERT. Our results suggest a protective function of TERT against OS, also preserving mitochondrial functionality.

Keywords: electron microscopy; mitochondrion; oxidative response; primary cell lines; telomerase catalytic subunit.


Conflict of interest statement

The authors declare no conflict of interest.

Figures

Figure 1
Figure 1
Detection of genomic DNA damage induced by X-ray irradiation or H2O2 treatment. (A) Representative images of immunofluorescence staining of γH2AX (red spot) in HF-TERT cells, before (CTRL) and after X-rays irradiation (X-rays). (B,C) Graphs evidencing data about the frequency of γH2AX after irradiation and hydrogen peroxide treatment. Bars correspond to standard error of γH2AX. Statistical analysis is performed between HFFF2 and HF-TERT cells. * p < 0.05; ** p < 0.01 by t-test.
Figure 2
Figure 2
Measure of oxidative stress after X-rays irradiation or H2O2 treatment. (A) ROS level in control and irradiated samples for both cell lines for 168 h post-X-rays treatment. (B) The graph represents the comparison between both cell lines after H2O2 treatment. Measure of the level of oxidative stress in all samples was done immediately after 1 h (t0) H2O2 treatment. Successively, cells are recovered with culture media and oxidative stress is measured after 1 and 2 h (t1, t2). All results are normalized to the control values of HFFF2 cells and are expressed as mean values ± SEM of the ratio between the relative fluorescence intensity and the cell number for each day analyzed. Statistical analysis is performed between treated and control samples for both cell lines. * p < 0.05; ** p < 0.01; *** p < 0.001; by one-way ANOVA test with Tukey’s post-test.
Figure 3
Figure 3
Expression level of GCLM, GCLC and SOD2 genes. RT-qPCR of GLCM (A), GCLC (B) and SOD2 (C) in untreated and treated normal and hTERT-overexpressing cells after 1 and 3 h of recovery. The values are normalized to the control HFFF2 cells and are expressed as mean values ± SEM. Statistical analysis (*) is performed between each sample and control HFFF2 cells (* p < 0.05; ** p < 0.01; *** p < 0.001; t-test), or between treated and untreated HF-TERT cells (# p < 0.05; ### p < 0.001; t-test).
Figure 4
Figure 4
SOD2 protein level evaluated after H2O2 treatment. (A) Western blot of SOD2 and Aconitase 2 (ACO2, used as a control) in HFFF2 and HF-TERT cells at 1 or 3 h of recovery after H2O2 treatment. (B) Quantification of SOD2 protein level in both cell lines after H2O2 treatment. Data represent mean ± SEM. Statistical analysis is performed between HF-TERT and HFFF2 untreated cells, or between treated and untreated HF-TERT. * p < 0.05; *** p < 0.001 by t-test.
Figure 5
Figure 5
TERT localization in mitochondrial and cytosolic fraction. (A) Representative Western blot shows specific bands for cytosolic level of TERT and tubulin, used as control protein, in untreated and treated HFFF2 or HF-TERT cells. (B) Level of TERT protein in cytosol after 3 h of H2O2 treatment, normalized to tubulin signal. (C) Representative Western blot of mitochondrial level of TERT and ACO2, used as control protein, in untreated HFFF2 and in untreated and treated HF-TERT cells 3 h after treatment. (D) Quantification of mitochondrial level of TERT protein, normalized to ACO2 signal. (E) Image of cells stained for TERT antibody (green) and Mitospy (red) in untreated (upper panel) and treated (lower panel) HF-TERT cells. The enlarged images show localization of TERT protein into mitochondria. Data represent mean ± SEM. * p < 0.05; *** p < 0.001; by t-test.
Figure 6
Figure 6
TERT detection within the mitochondria. (A) TEM representative micrograph of mitochondria in H2O2-treated HF-TERT cells. Magnification of TERT immunogold labeling in mitochondria (see black arrowheads). Scale bar: 0.5 µm. (B) Frequency of mitochondria containing a different number of gold particles in HF-TERT cells. (C) Frequency of mitochondria containing a different number of gold particles in HF-TERT H2O2 cells. The frequency of mitochondria scored was about 100. (D) Quantification of TERT particles in mitochondria. *** p < 0. 001; by t-test.
Figure 7
Figure 7
FIB/SEM micrographs illustrating mitochondrial morphology in HFFF2 (AD) and HF-TERT (EH) cells, treated and untreated with H2O2. In untreated cells, mitochondria display a typically elongated shape and numerous parallel-oriented cristae. Following treatment, mitochondrial swelling (asterisks), with matrix expansion and cristae dysmorphic features, including numerical reduction, spatial disorganization and/or fragmentation (arrowheads) are observed. Rupture of the outer membrane is occasionally found (arrow). The diagrams report mitochondria alteration in untreated and treated (I) HFFF2 cells and (J) HF-TERT cells after 3-hour recovery. Data represent mean ± SEM. *** p < 0.001; by Student’s t-test. Acronyms: (go) Golgi complex, (ly) lysosome, (rer) rough endoplasmic reticulum, (v) vacuole.
Figure 8
Figure 8
Mitochondrial function and amount in untreated and treated HFFF2 and HF-TERT. (A) Representative image of HFFF2 cells stained with MitoTracker Green. (B) Mitochondrial mass in untreated and treated HFFF2 cells and HF-TERT cells immediately after 1 h, after 1 and 3 h of recovery from H2O2 treatment. (C,D) qPCR for ND4 and MT-7S mitochondrial genes in untreated and treated HFFF2 (C) and HF-TERT cells (D) after 1 and 3 h of recovery. (E) Mitochondrial membrane potential (ΔΨm) measured by JC-1, red to green fluorescence intensity ratio. (F) Quantification data of JC-1 after 1 h of H2O2. FCCP (10 μM) is used as the positive control. ATP level in untreated and treated HFFF2 (G) and HF-TERT (H) cells. All values are expressed as mean values ± SEM. Statistical analysis is performed between treated and control samples of both cells. * p < 0.05; *** p < 0.001; by t-test.
Figure 9
Figure 9
Expression level of TFAM gene in untreated and treated HFFF2 (A) and HF-TERT (B) after H2O2 treatment. The values are expressed as mean values ± SEM. Statistical analysis is performed between treated and control samples. ** p < 0.01; *** p < 0.001; by t-test.

References

    1. Greider C.W., Blackburn E.H. The telomere terminal transferase of Tetrahymena is a ribonucleoprotein enzyme with two kinds of primer specificity. Cell. 1987;51:887–898. doi: 10.1016/0092-8674(87)90576-9. - DOI - PubMed
    1. Olovnikov A.M. Principle of marginotomy in template synthesis of polynucleotides. Dokl. Akad. Nauk SSSR. 1971;201:1496–1499. - PubMed
    1. Olovnikov A.M. A theory of marginotomy. The incomplete copying of template margin in enzymic synthesis of polynucleotides and biological significance of the phenomenon. J. Theor. Biol. 1973;41:181–190. doi: 10.1016/0022-5193(73)90198-7. - DOI - PubMed
    1. Wellinger R.J., Sen D. The DNA structures at the ends of eukaryotic chromosomes. Eur. J. Cancer. 1997;33:735–749. doi: 10.1016/S0959-8049(97)00067-1. - DOI - PubMed
    1. Feng J., Funk W.D., Wang S.S., Weinrich S.L., Avilion A.A., Chiu C.P., Adams R.R., Chang E., Allsopp R.C., Yu J., et al. The RNA component of human telomerase. Science. 1995;269:1236–1241. doi: 10.1126/science.7544491. - DOI - PubMed