. 2023 Feb 24;24(5):4516.
doi: 10.3390/ijms24054516.

An Oxalate Transporter Gene, AtOT, Enhances Aluminum Tolerance in Arabidopsis thaliana by Regulating Oxalate Efflux

Affiliations

An Oxalate Transporter Gene, AtOT, Enhances Aluminum Tolerance in Arabidopsis thaliana by Regulating Oxalate Efflux

Zongming Yang et al. Int J Mol Sci. .

Abstract

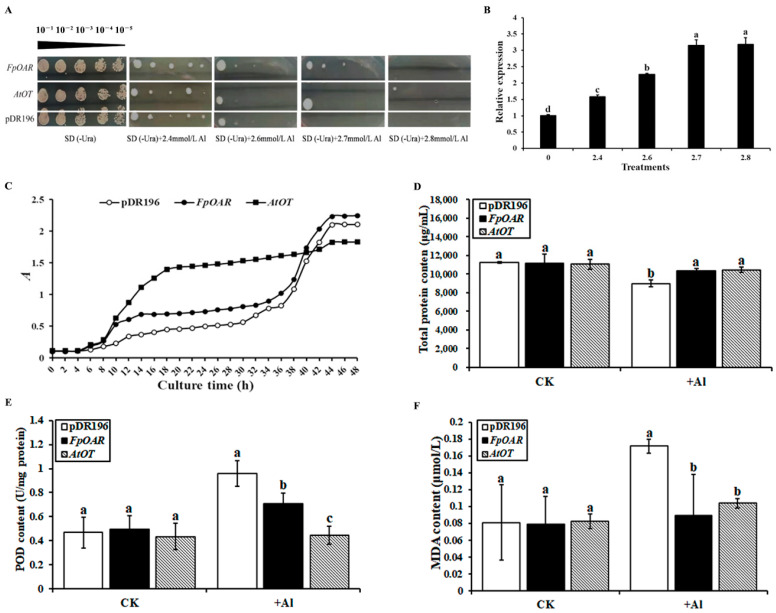
Secretion and efflux of oxalic acid from roots is an important aluminum detoxification mechanism for various plants; however, how this process is completed remains unclear. In this study, the candidate oxalate transporter gene AtOT, encoding 287 amino acids, was cloned and identified from Arabidopsis thaliana. AtOT was upregulated in response to aluminum stress at the transcriptional level, which was closely related to aluminum treatment concentration and time. The root growth of Arabidopsis was inhibited after knocking out AtOT, and this effect was amplified by aluminum stress. Yeast cells expressing AtOT enhanced oxalic acid resistance and aluminum tolerance, which was closely correlated with the secretion of oxalic acid by membrane vesicle transport. Collectively, these results underline an external exclusion mechanism of oxalate involving AtOT to enhance oxalic acid resistance and aluminum tolerance.

Keywords: Arabidopsis thaliana; AtOT; aluminum toxicity; functional characterization; gene expression; oxalate transporter.


Conflict of interest statement

The authors declare no conflicts of interest.

Figures

Figure 1
Figure 1
Multiple sequence alignment of FpOAR, HbOT1, HbOT2, and AtOT. Different secondary structures are labelled above a specific sequence, black boxes represent the transmembrane domains (TM1–TM5) of the protein, and the yellow highlighted fragment represents the SNARE-assoc conserved domain of the protein. Conserved and similar residues are identified by red shadows and blue boxes, respectively.
Figure 2
Figure 2
Expression pattern of the AtOT gene in Arabidopsis. (A) Phenotype of wild-type Col-0 under 0 (CK), 25, 50, 100, 150, and 200 μM of AlCl3·6H2O for 48 h. (B) qRT-PCR analysis of AtOT transcripts in different tissues. (C) qRT-PCR analysis of AtOT under 0 (CK), 25, 50, 100, 150, and 200 μM Al3+ for 48 h in the root of Arabidopsis wild-type Col-0. (D) qRT-PCR analysis of AtOT under 100 μM Al3+ for 0 (CK), 3, 6, 12, 24, and 48 h in the root of Arabidopsis wild-type Col-0. Different letters above the bars indicate significant differences among the treatments at p < 0.05.
Figure 3
Figure 3
Subcellular localization of AtOT in tobacco leaves. The 35S::AtOT-GFP fusion protein was transiently expressed in tobacco (N. benthamiana) leaf epidermal cells. The bars indicate the length of 20 um.
Figure 4
Figure 4
Effects of aluminum on the wild-type and atot mutant Arabidopsis. (A) Confirmation of the homozygosity of the atot mutant plants. Information on the atot mutant (SALK_002559C) can be found at http://signal.salk.edu/cgi-bin/tdnaexpress/ (accessed on 7 January 2022), and plants no. 1, 4, and 5 which showed a clear band for the LBb1.3 + RP primers but no bands for the LP + RP primers in the three primers PCR method were identified as homozygotes and utilized for the subsequent experiments. (B) Phenotype of the wild-type Col-0 and atot mutant under 0 (CK), 100, and 200 μM Al3+ for 2 weeks. (C) Root length comparison of the wild-type Col-0 and atot mutant under 0 (CK), 25, 50, 100, 150, and 200 μM Al3+ for 2 weeks. (D) Proline content of the wild-type Col-0 and atot mutant under 0 (CK), 25, 50, 100, 150, and 200 μM Al3+. (E) Malonaldehyde content of the wild-type Col-0 and atot mutant under 0 (CK), 25, 50, 100, 150, and 200 μM Al3+. Different letters above the bars indicate significant differences among the treatment concentrations and the asterisk (*) represents significant differences between the wild-type Col-0 and atot mutant Arabidopsis at p < 0.05.
Figure 5
Figure 5
Growth of yeast transformants under different concentrations of oxalic acid. (A) Colony phenotype of yeast transformants under different concentrations of oxalic acid for 4 days. The yeast concentrations for each treatment were 10−1, 10−2, 10−3, 10−4, and 10−5 from left to right. (B) qRT-PCR analysis of AtOT under 0 (CK), 2, 4, 8, and 10 mM oxalic acid stresses in yeast cells. Different letters above the bars indicate significant differences among treatments at p < 0.05.
Figure 6
Figure 6
Changes in oxalic acid contents in the medium and cells of the yeast transformants under 2 mmol/L oxalic acid stress. (A) Changes in oxalic acid contents in the yeast transformants under 2 mM oxalic acid stress. (B) Changes in oxalic acid contents in the culture medium under 2 mM oxalic acid stress. Different letters indicate significant differences among different recombinant yeast cells at p < 0.05.
Figure 7
Figure 7
[13C]oxalic acid residue in the filtrate of pDR196- (negative control), FpOAR- (positive control), and AtOT-transformed yeast membrane vesicles. Different letters in the figure indicated significant differences among the recombinant yeast cells at p < 0.05.
Figure 8
Figure 8
Effects of AtOT on yeast cell aluminum tolerance. (A) Effect of AtOT aluminum on yeast cell colony phenotype. (B) qRT-PCR analysis of AtOT in the AtOT-recombinant yeast cells under 0 (CK), 2.4, 2.6, 2.7, and 2.8 mM Al3+. (C) Growth curve of yeast transformants under 2.7 mM Al3+ stress. (D) Determination of total protein content of yeast transformants under 2.7 mM Al3+ stress for 48 h. (E) Determination of malondialdehyde (MDA) content in yeast transformants under 2.7 mM Al3+ stress for 48 h. (F) Determination of peroxidase (POD) content in yeast transformants under 2.7 mM Al3+ stress for 48 h. Different letters above bars in (CE) indicate significant differences among various recombinant yeast cells at p < 0.05.

References

    1. Kochian L.V., Hoekenga O.A., Piñros M.A. How do crop plants tolerate acid soils? Mechanisms of aluminum tolerance and phosphorous efficiency. Annu. Rev. Plant Biol. 2004;55:459–493. doi: 10.1146/annurev.arplant.55.031903.141655. - DOI - PubMed
    1. Silambarasan S., Logeswari P., Valentine A., Cornejo P. Role of Curtobacterium herbarum strain CAH5 on aluminum bioaccumulation and enhancement of Lactuca sativa growth under aluminum and drought stresses. Ecotoxicol. Environ. Saf. 2019;183:109573.1–109573.10. doi: 10.1016/j.ecoenv.2019.109573. - DOI - PubMed
    1. Feng Y.M., Yu M., Wang C.Q., Liu J.Y. Aluminum toxicity induced cell responses in higher plants. J. Huazhong Agric. Univ. 2005;24:320–324.
    1. Zhang H., Zhang G.L., Zhao Y.G., Zhao W.J., Qi Z.P. Chemical degradation of a Ferralsol (Oxisol) under intensive rubber (Hevea Brasiliensis) farming in tropical China. Soil Tillage Res. 2007;93:109–116. doi: 10.1016/j.still.2006.03.013. - DOI
    1. Wang H., Chen R.F., Iwashita T., Ma J.F. Physiological characterization of aluminum tolerance and accumulation in tartary and wild buckwheat. New Phytol. 2015;205:273–279. doi: 10.1111/nph.13011. - DOI - PubMed

MeSH terms

LinkOut - more resources